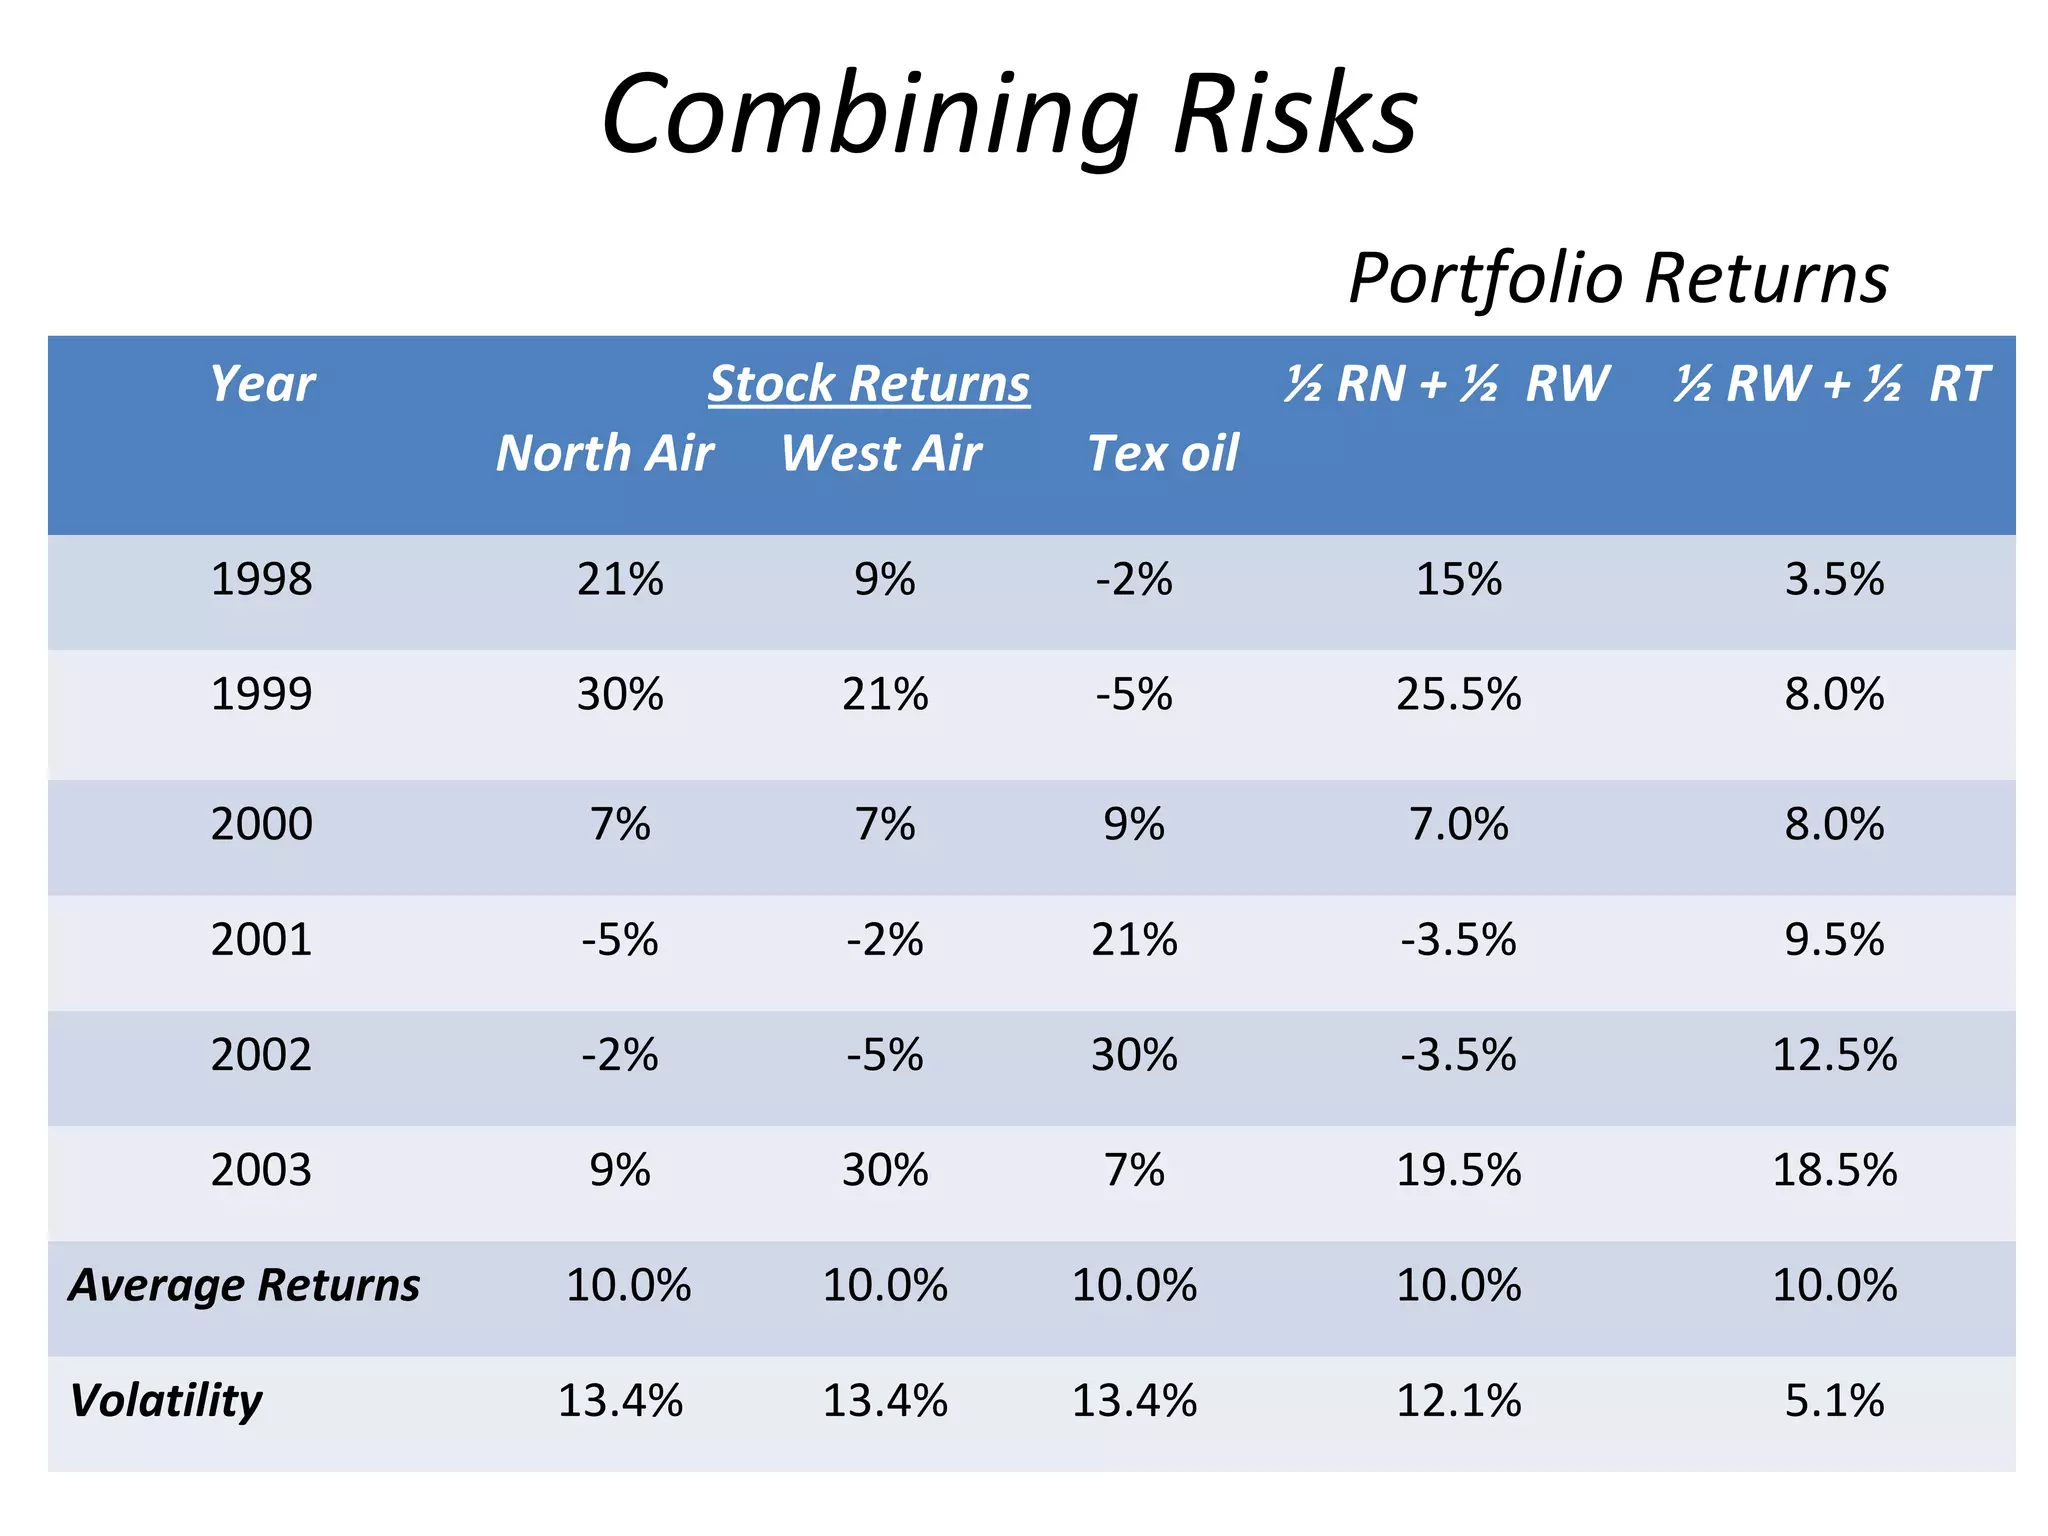
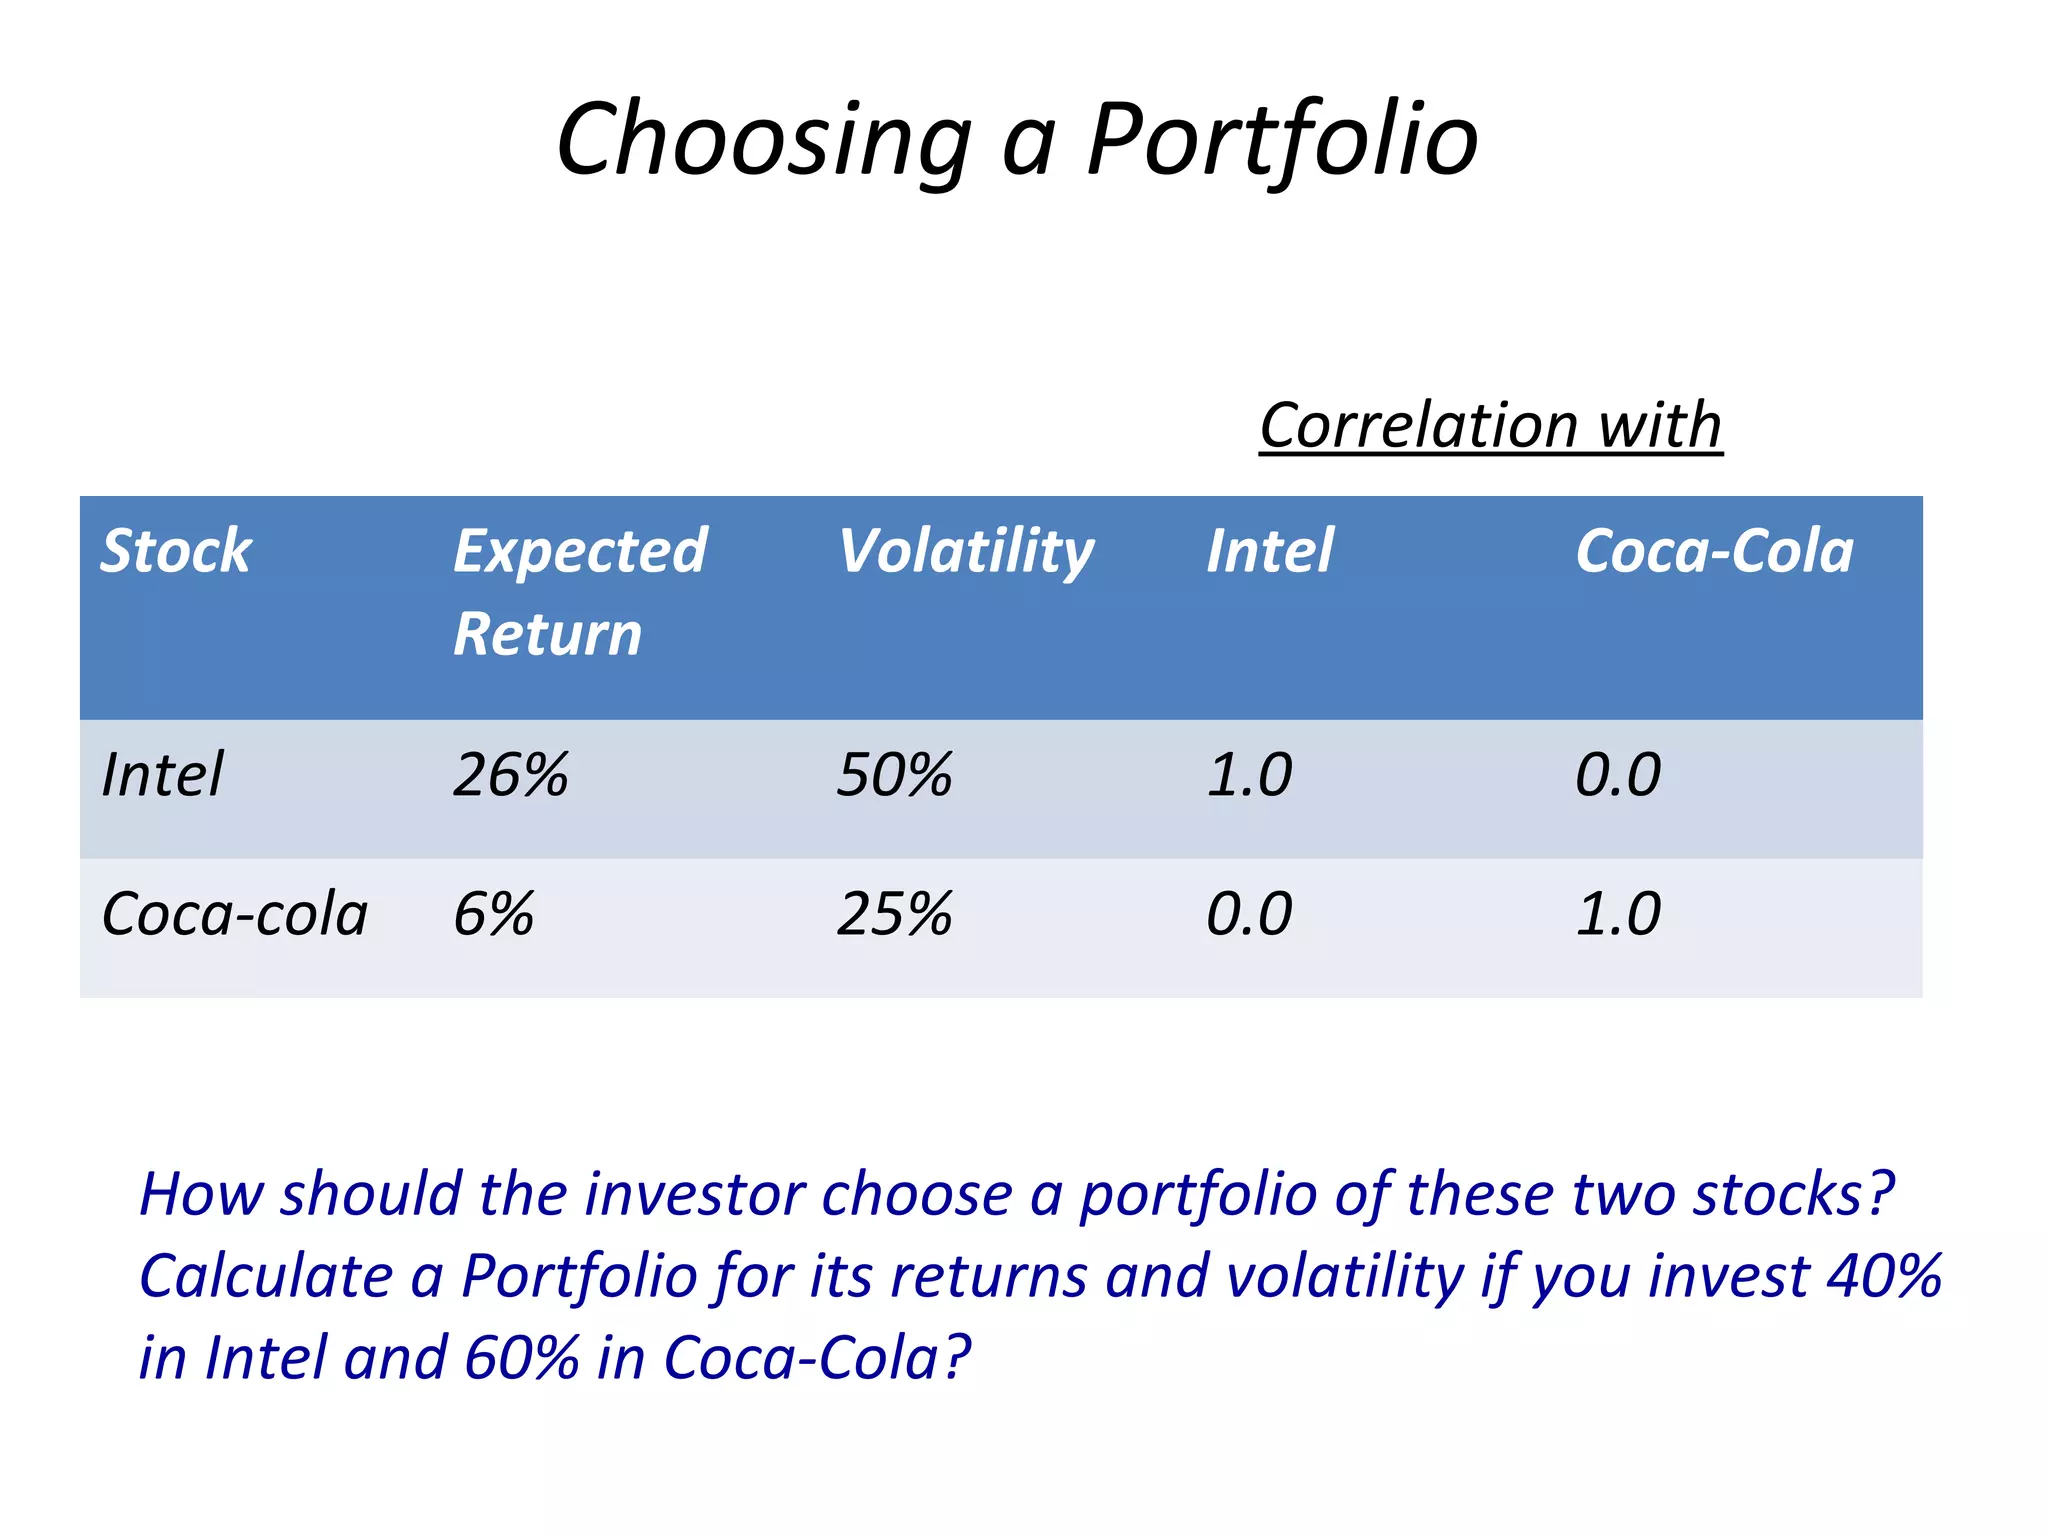
This document discusses concepts related to portfolio optimization and the capital asset pricing model (CAPM). It provides information on calculating expected portfolio returns and volatility based on the returns and correlations of individual stocks. It also discusses how adding risk-free assets such as Treasury bills affects the efficient frontier and introduces the capital allocation line. The Sharpe ratio is presented as a measure of portfolio return relative to risk. The separation theorem and using the tangent portfolio to maximize returns for a given risk level are also summarized.

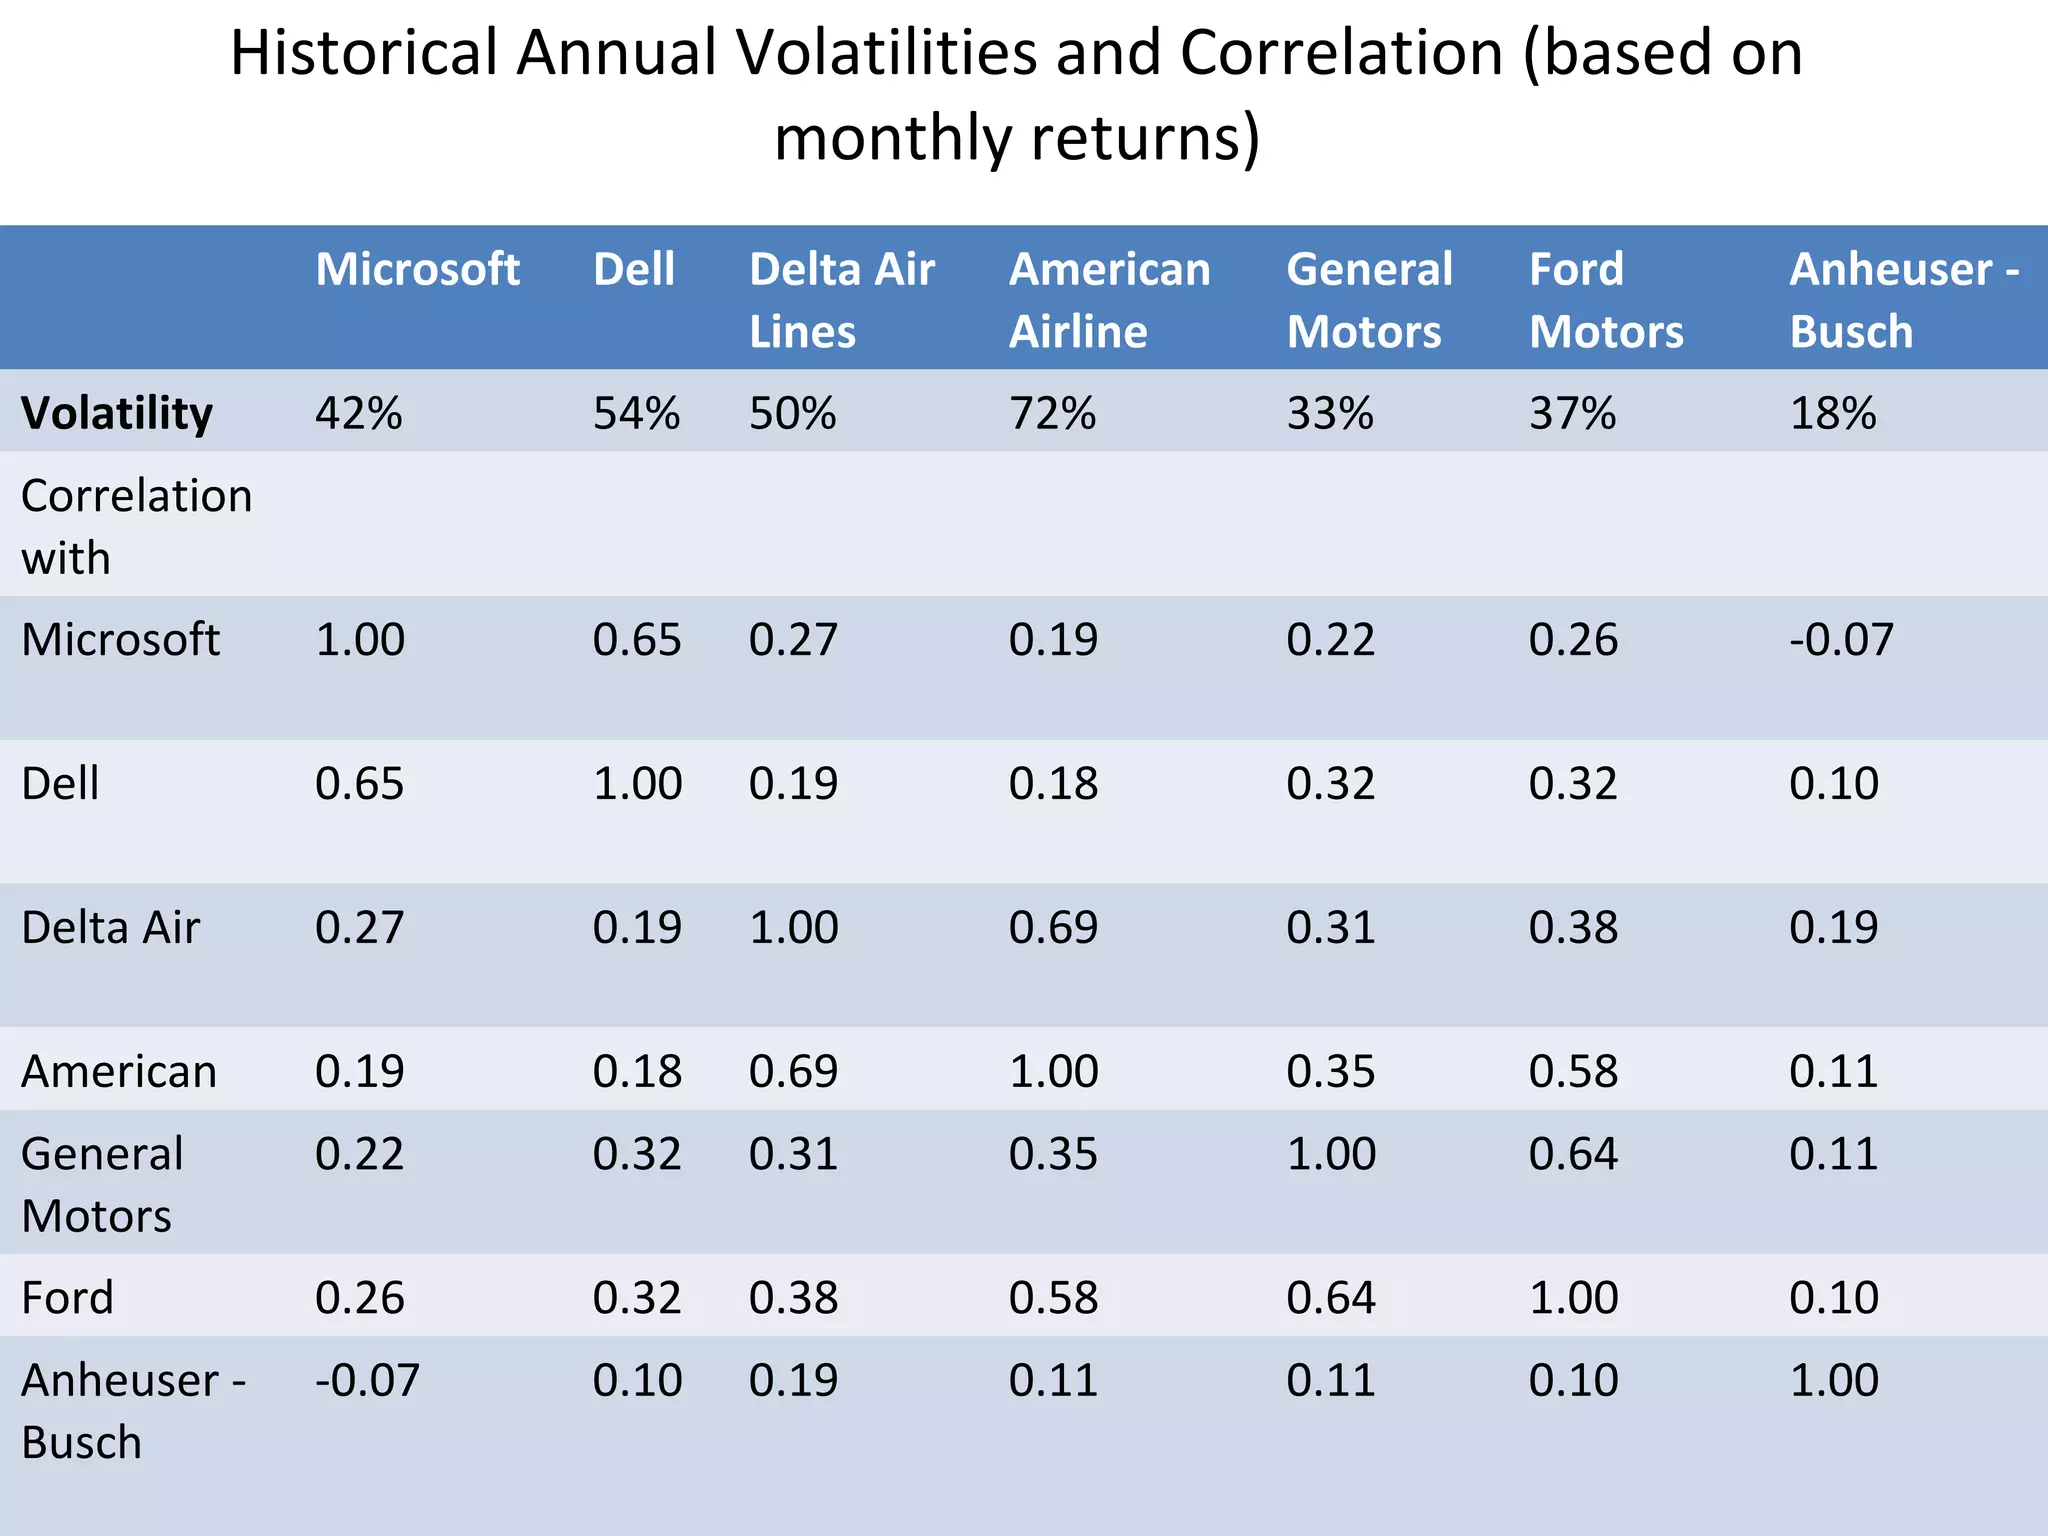
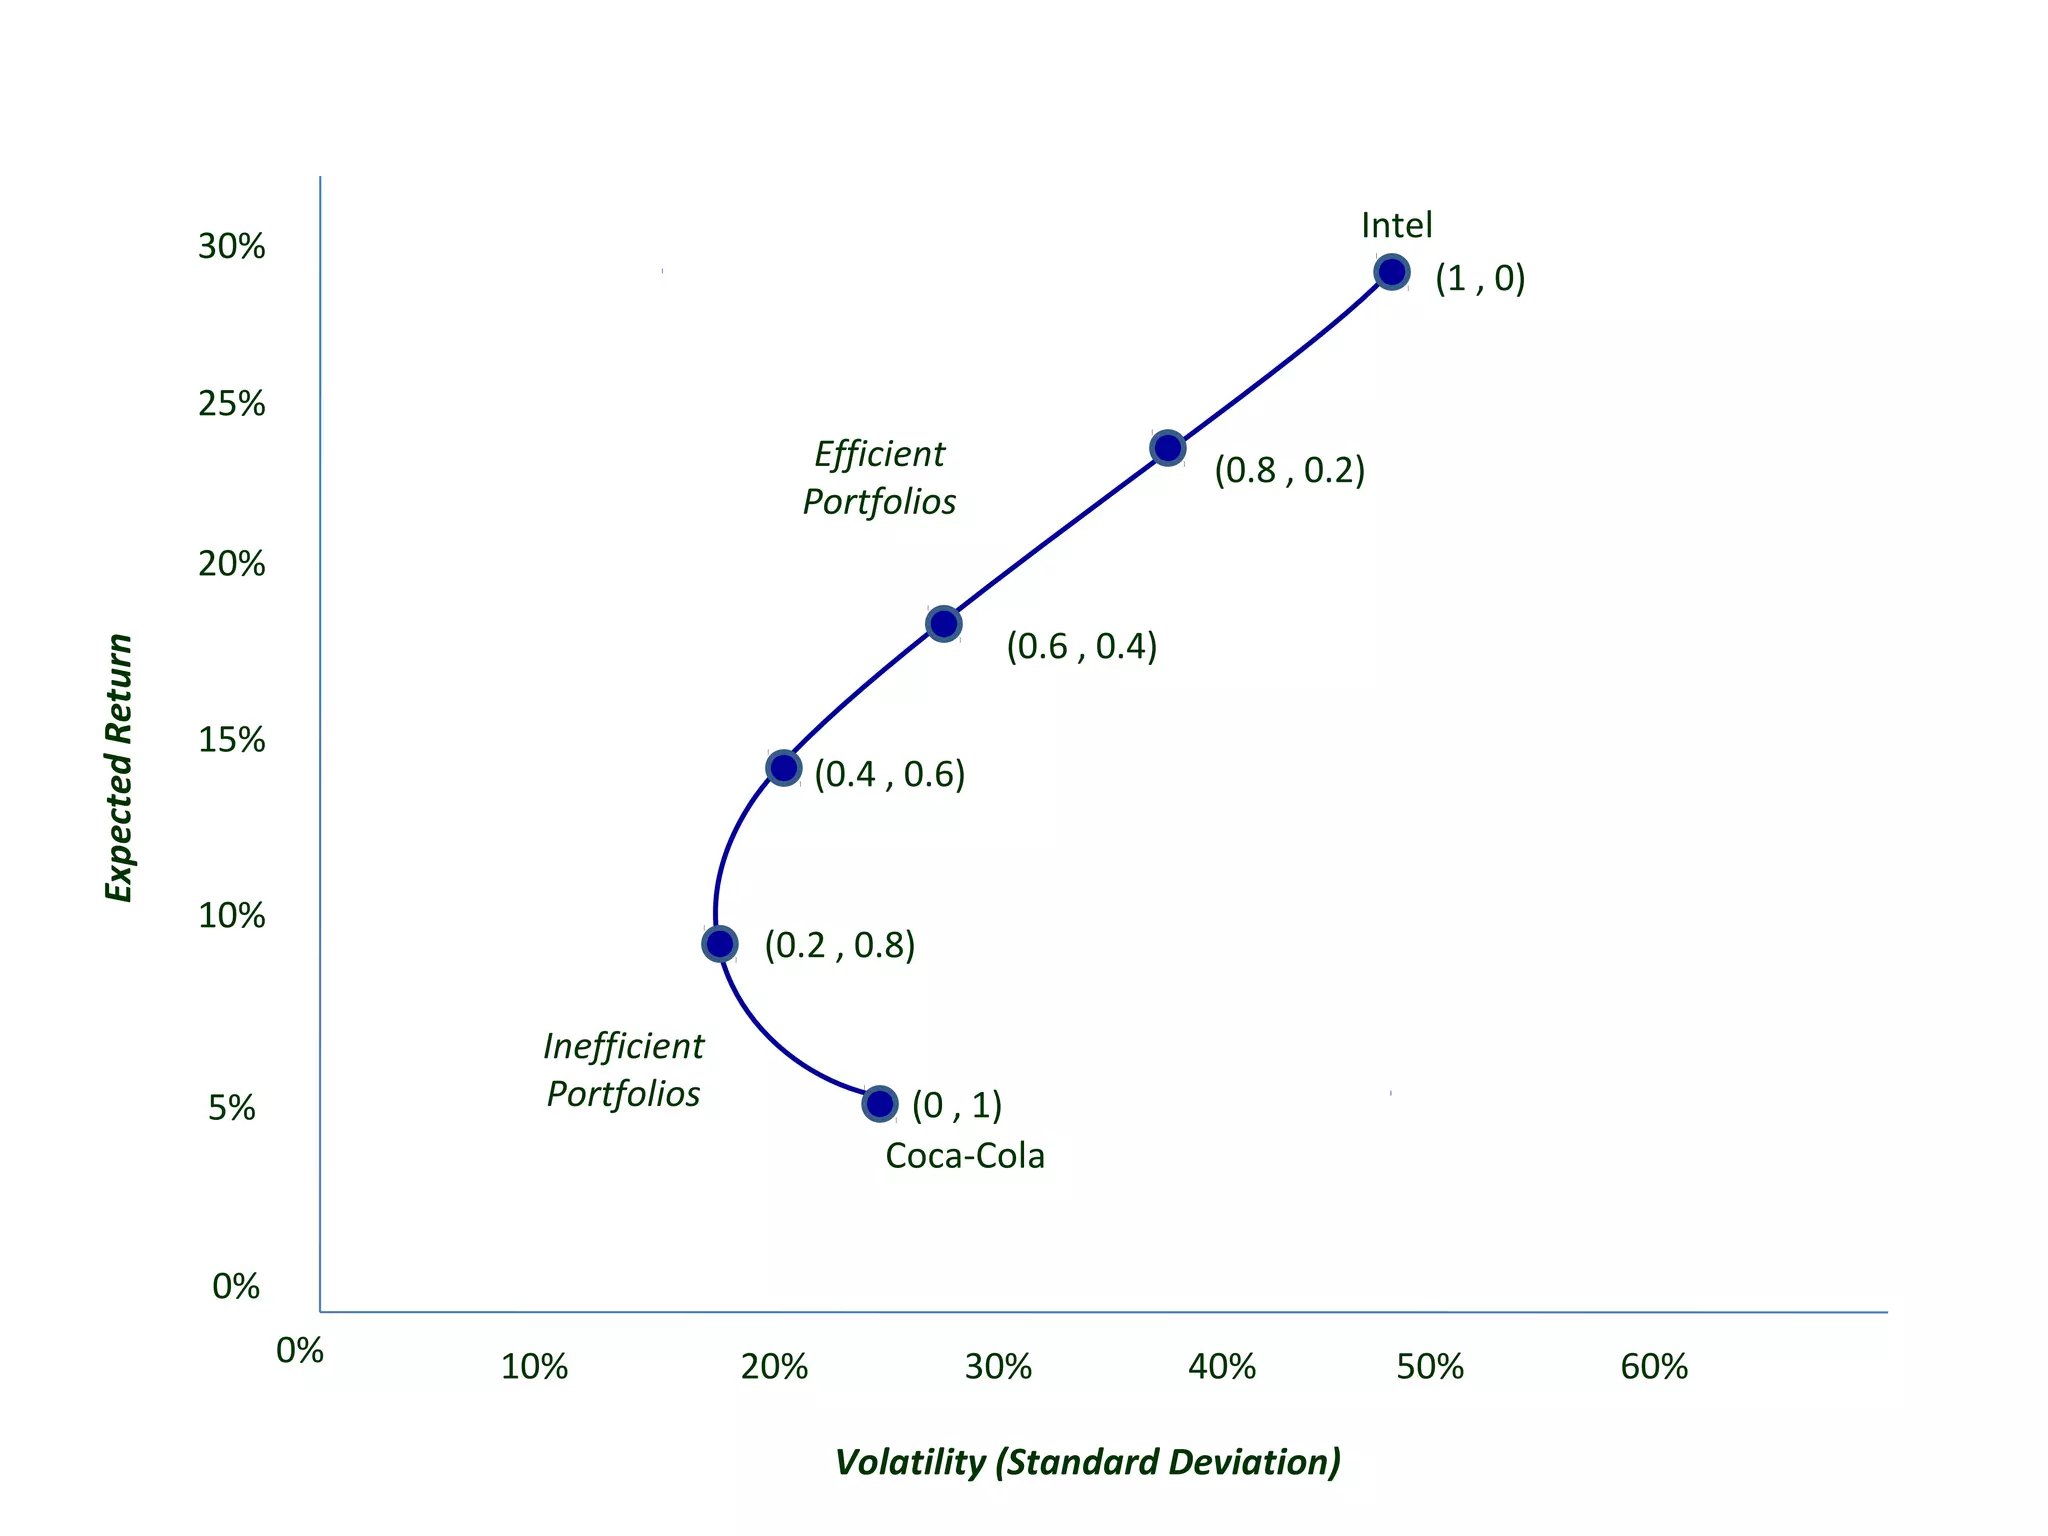
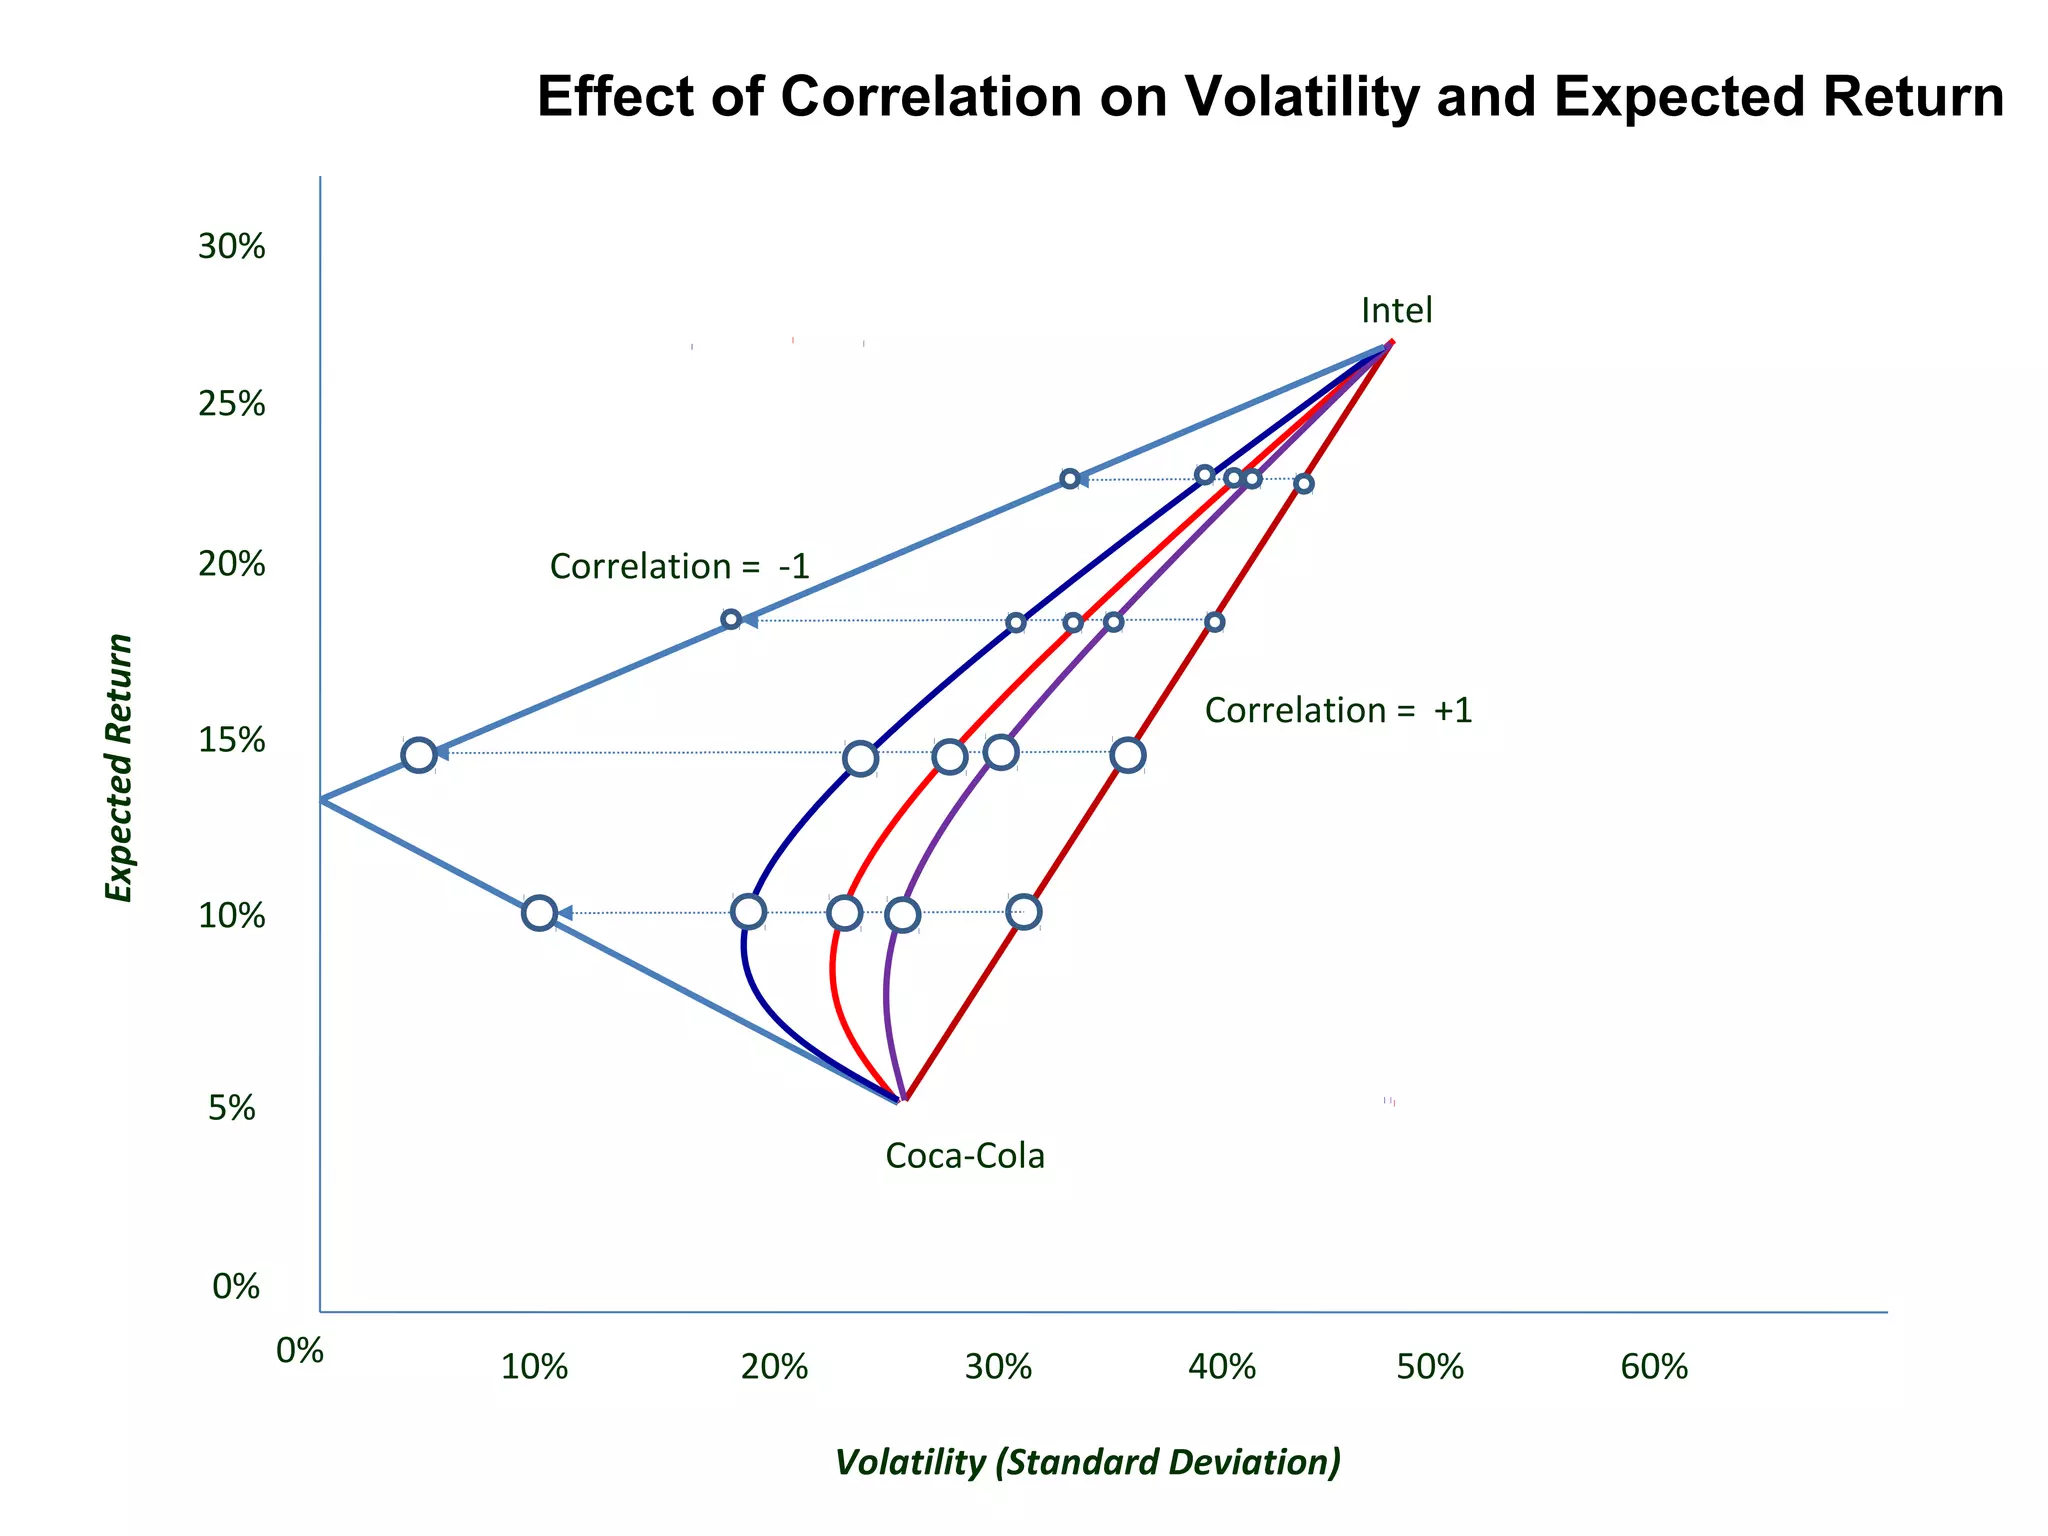
![Expected Returns and Volatility for Different
Portfolios of Two Stocks
Portfolio Weights Expected Return(%) Volatility (%)
X(Intel) X(Coca-cola) Expected return of Portfolio SD [R p]
1.00 0.00 26% 50%
0.80 0.20 22% 40.3%
0.60 0.40 18% 31.6%
0.40 0.60 14% 25%
0.20 0.80 10% 22.3%
0.00 1.00 6% 25%](https://image.slidesharecdn.com/52f574ef-c685-411a-9eef-22b7400c3ee7-161101093153/75/Optimal-Portfolio-Choice-13-2048.jpg)
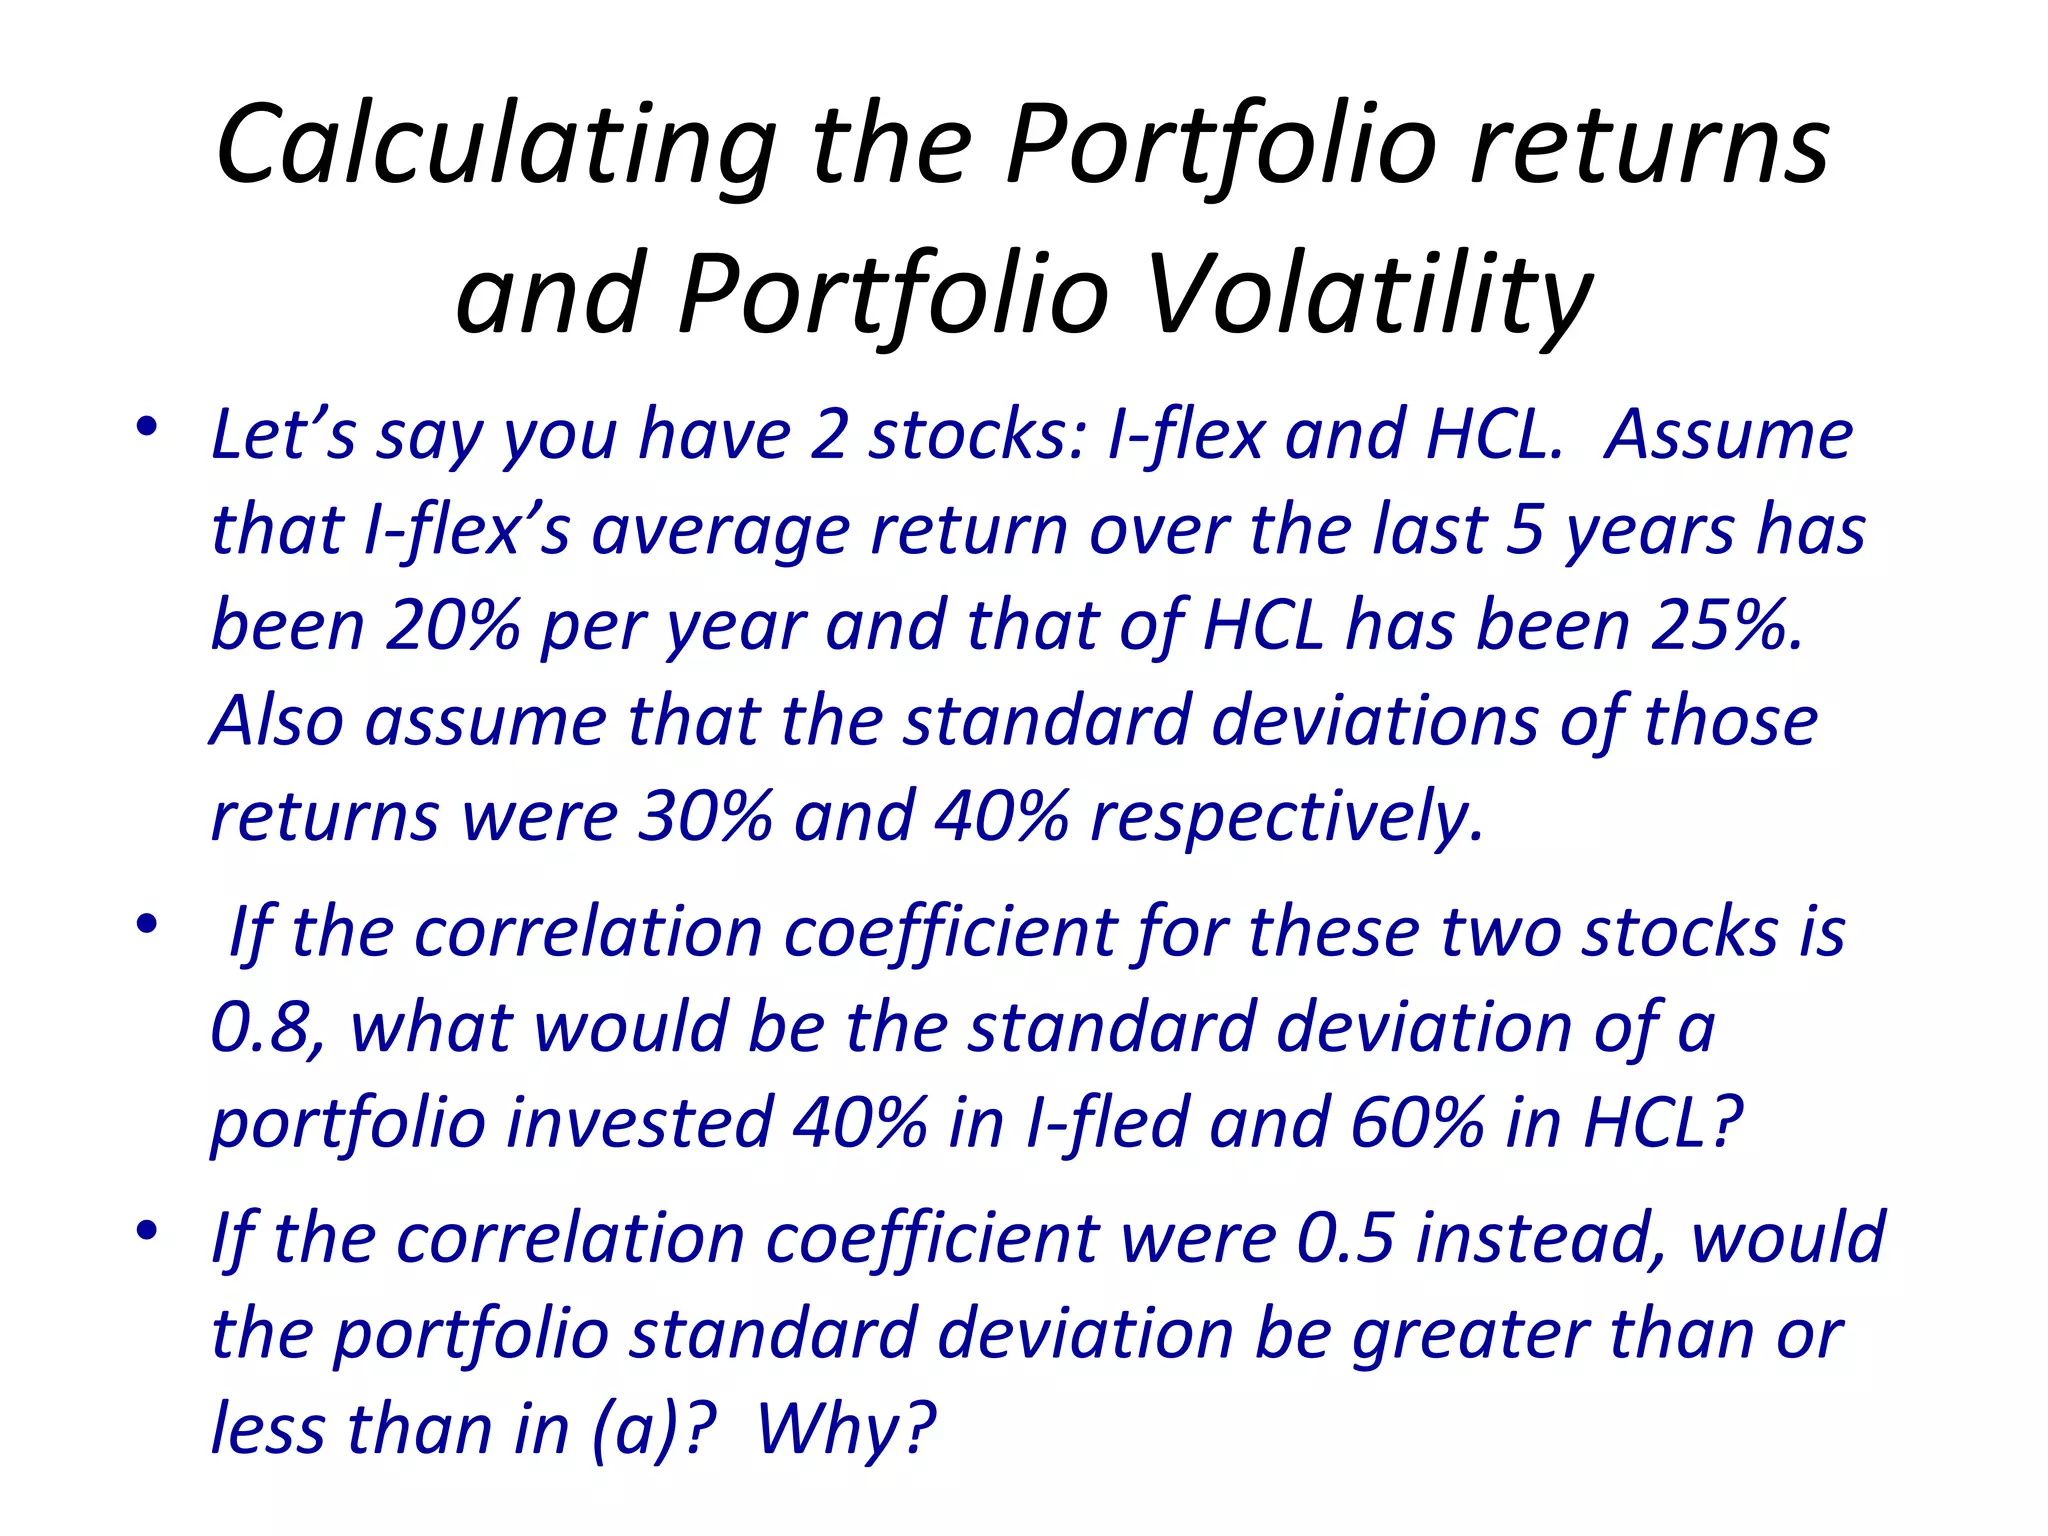
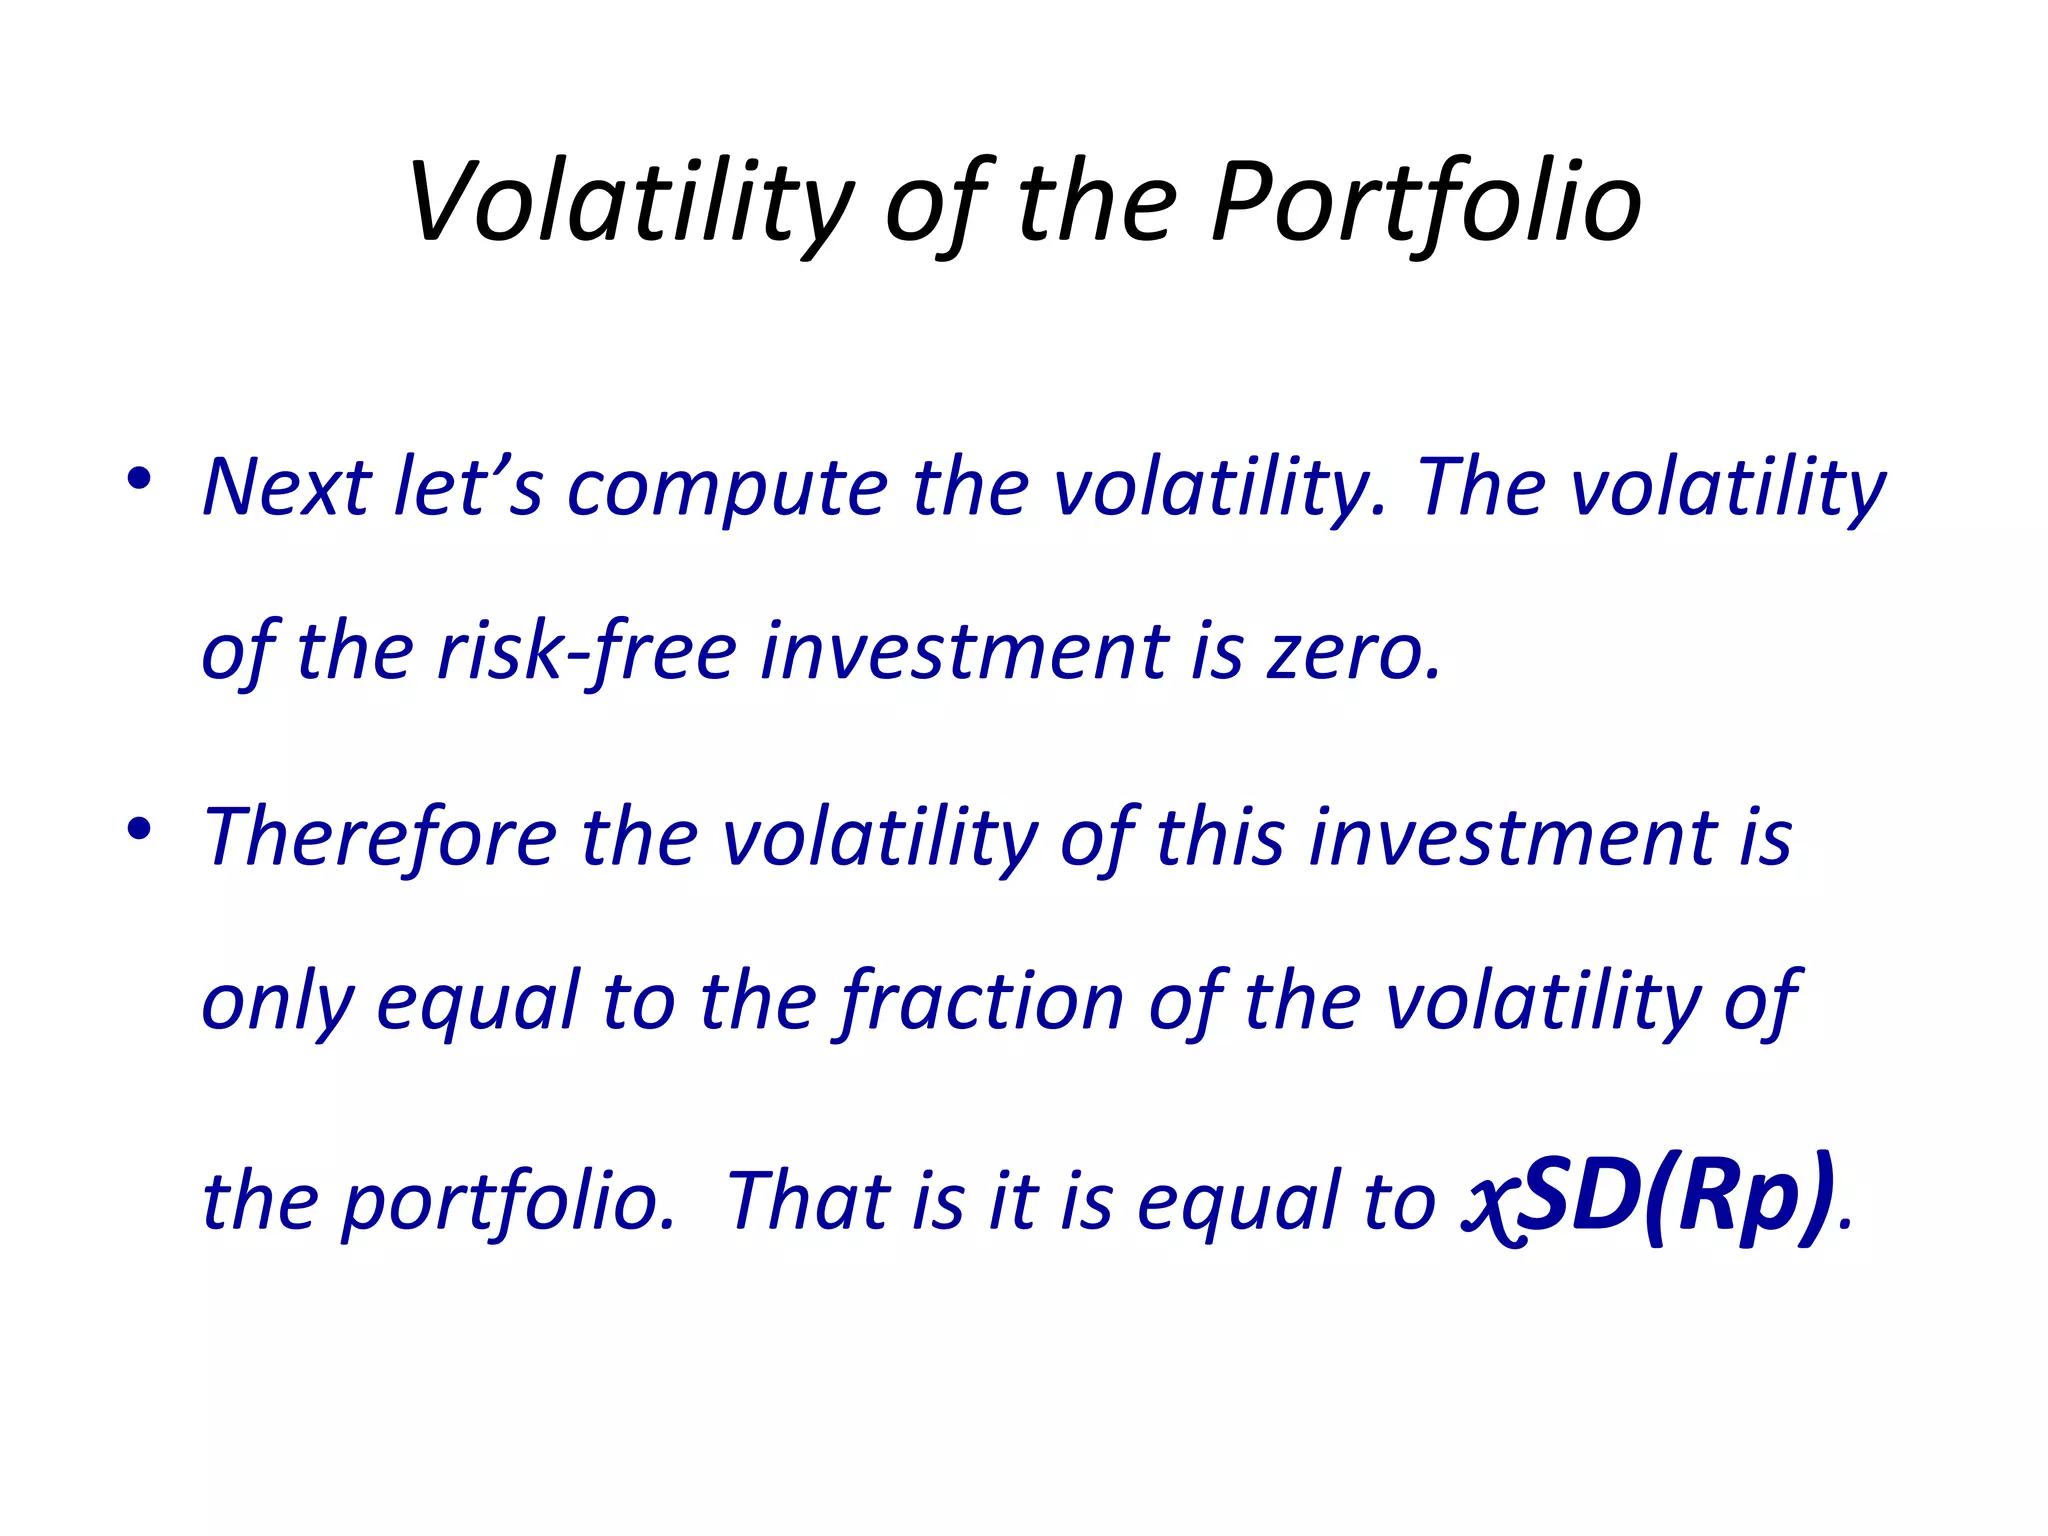
![Risk-Free Saving and Borrowing
Consider an arbitrary risky portfolio with
returns Rp. Lets look at the effect on risk
and return of putting a fraction x of our
money in the portfolio, while leaving the
remaining fraction (1-x) in risk-free
Treasury bills with a yield of rf .
E[Rxp] = rf + x(E[Rp] – rf)](https://image.slidesharecdn.com/52f574ef-c685-411a-9eef-22b7400c3ee7-161101093153/75/Optimal-Portfolio-Choice-20-2048.jpg)

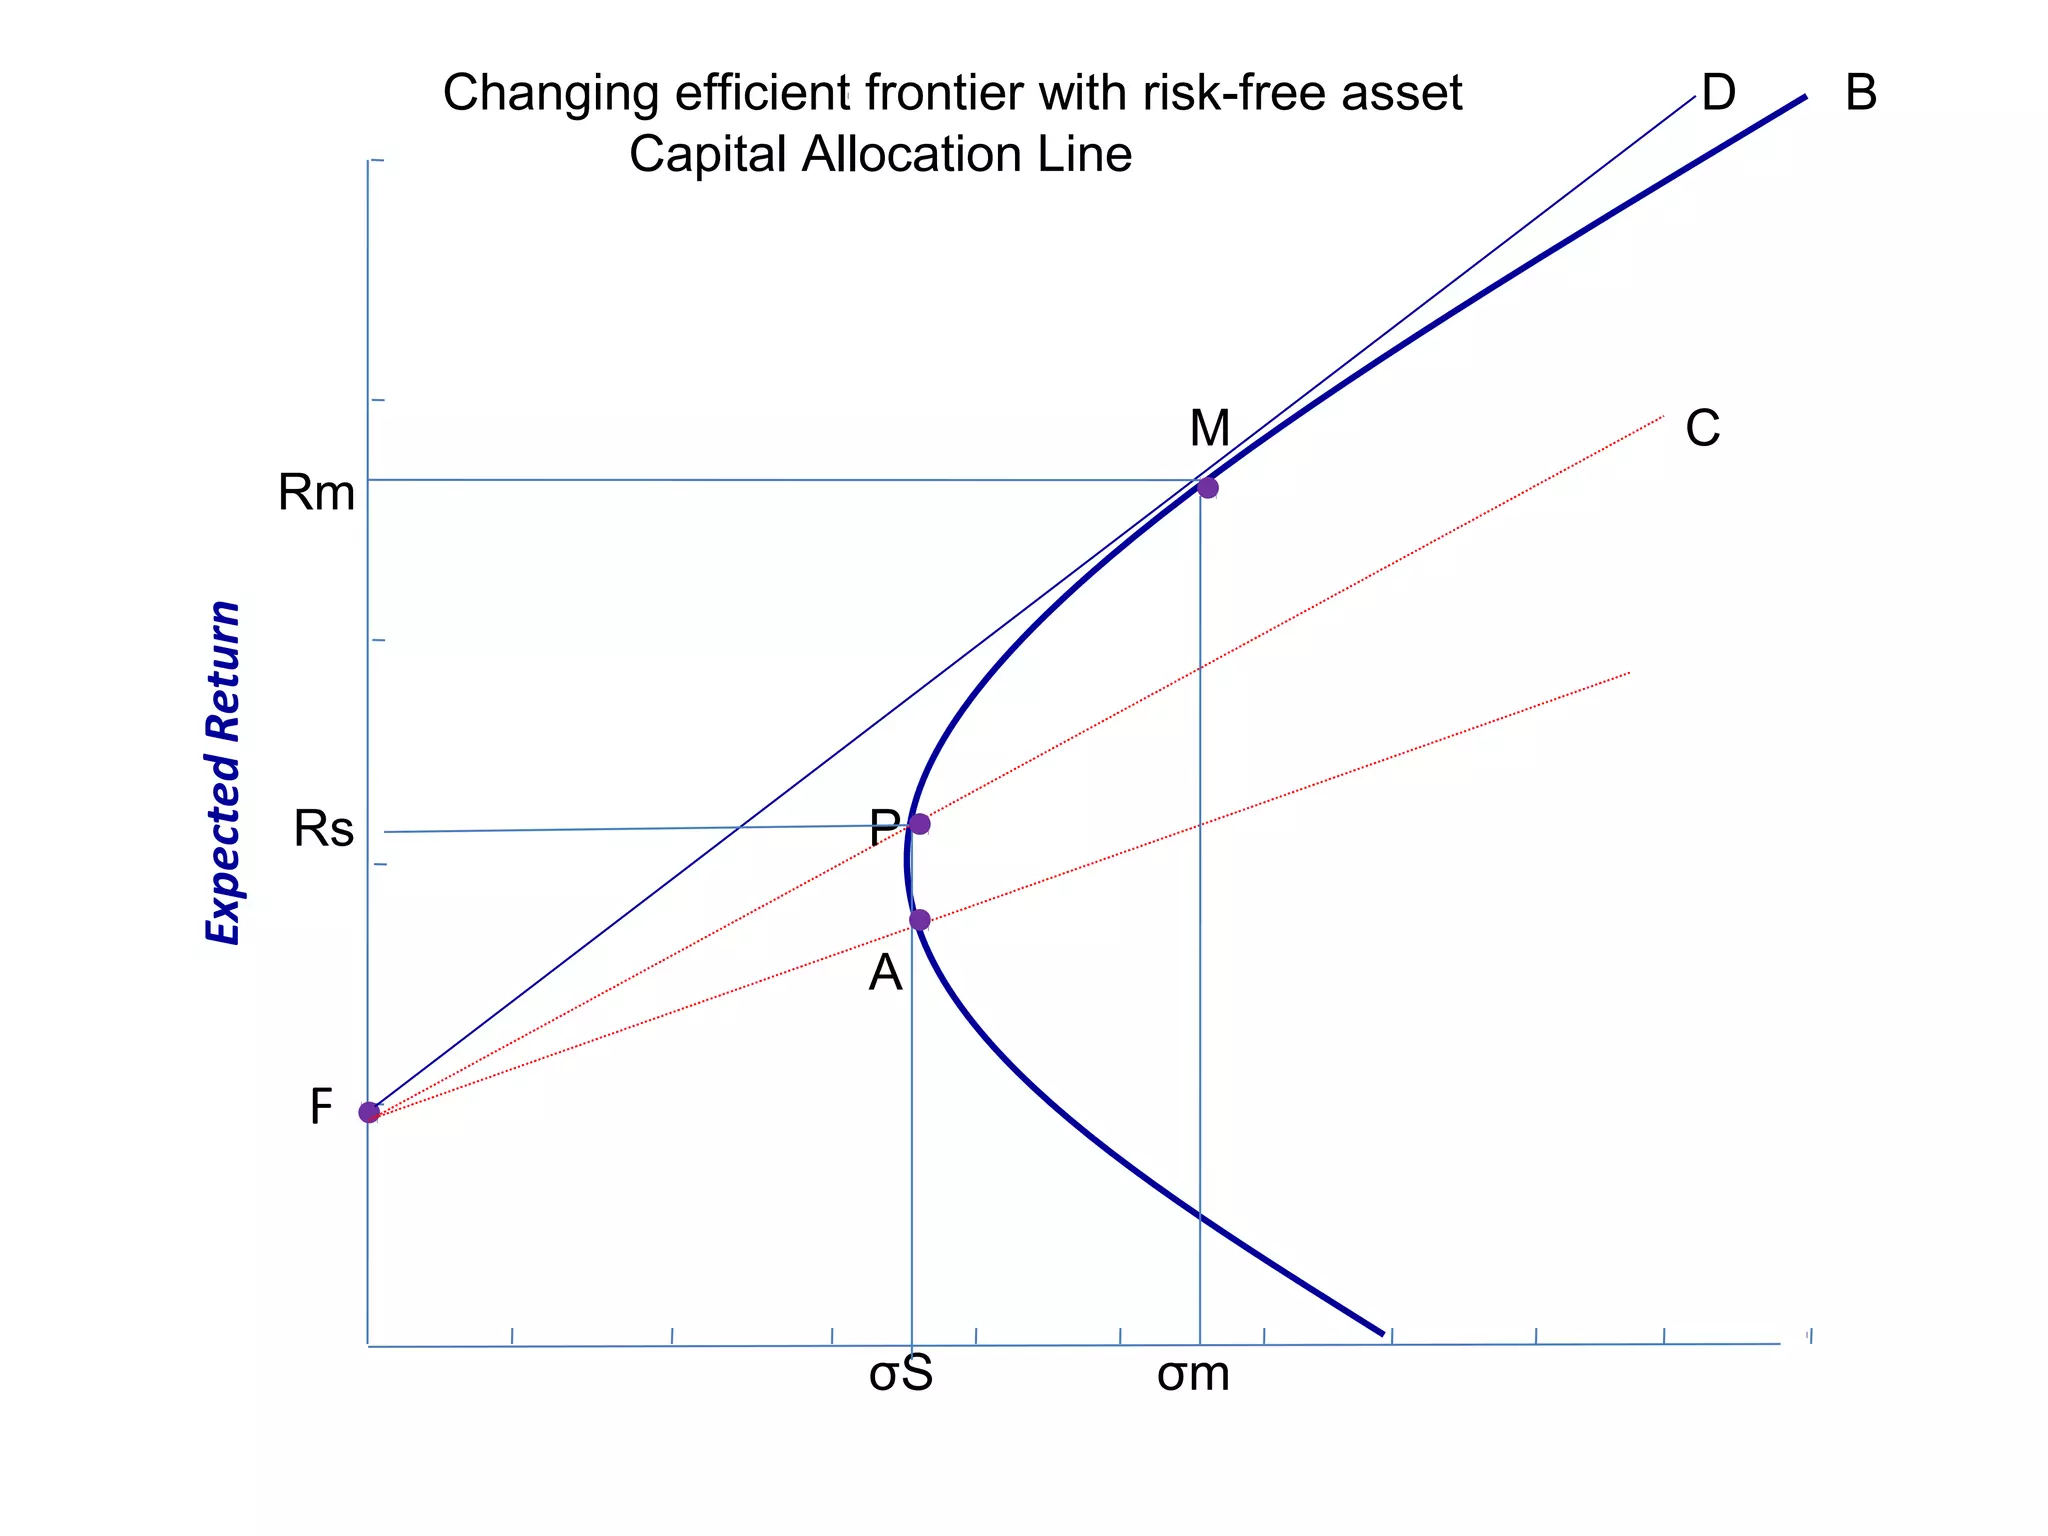
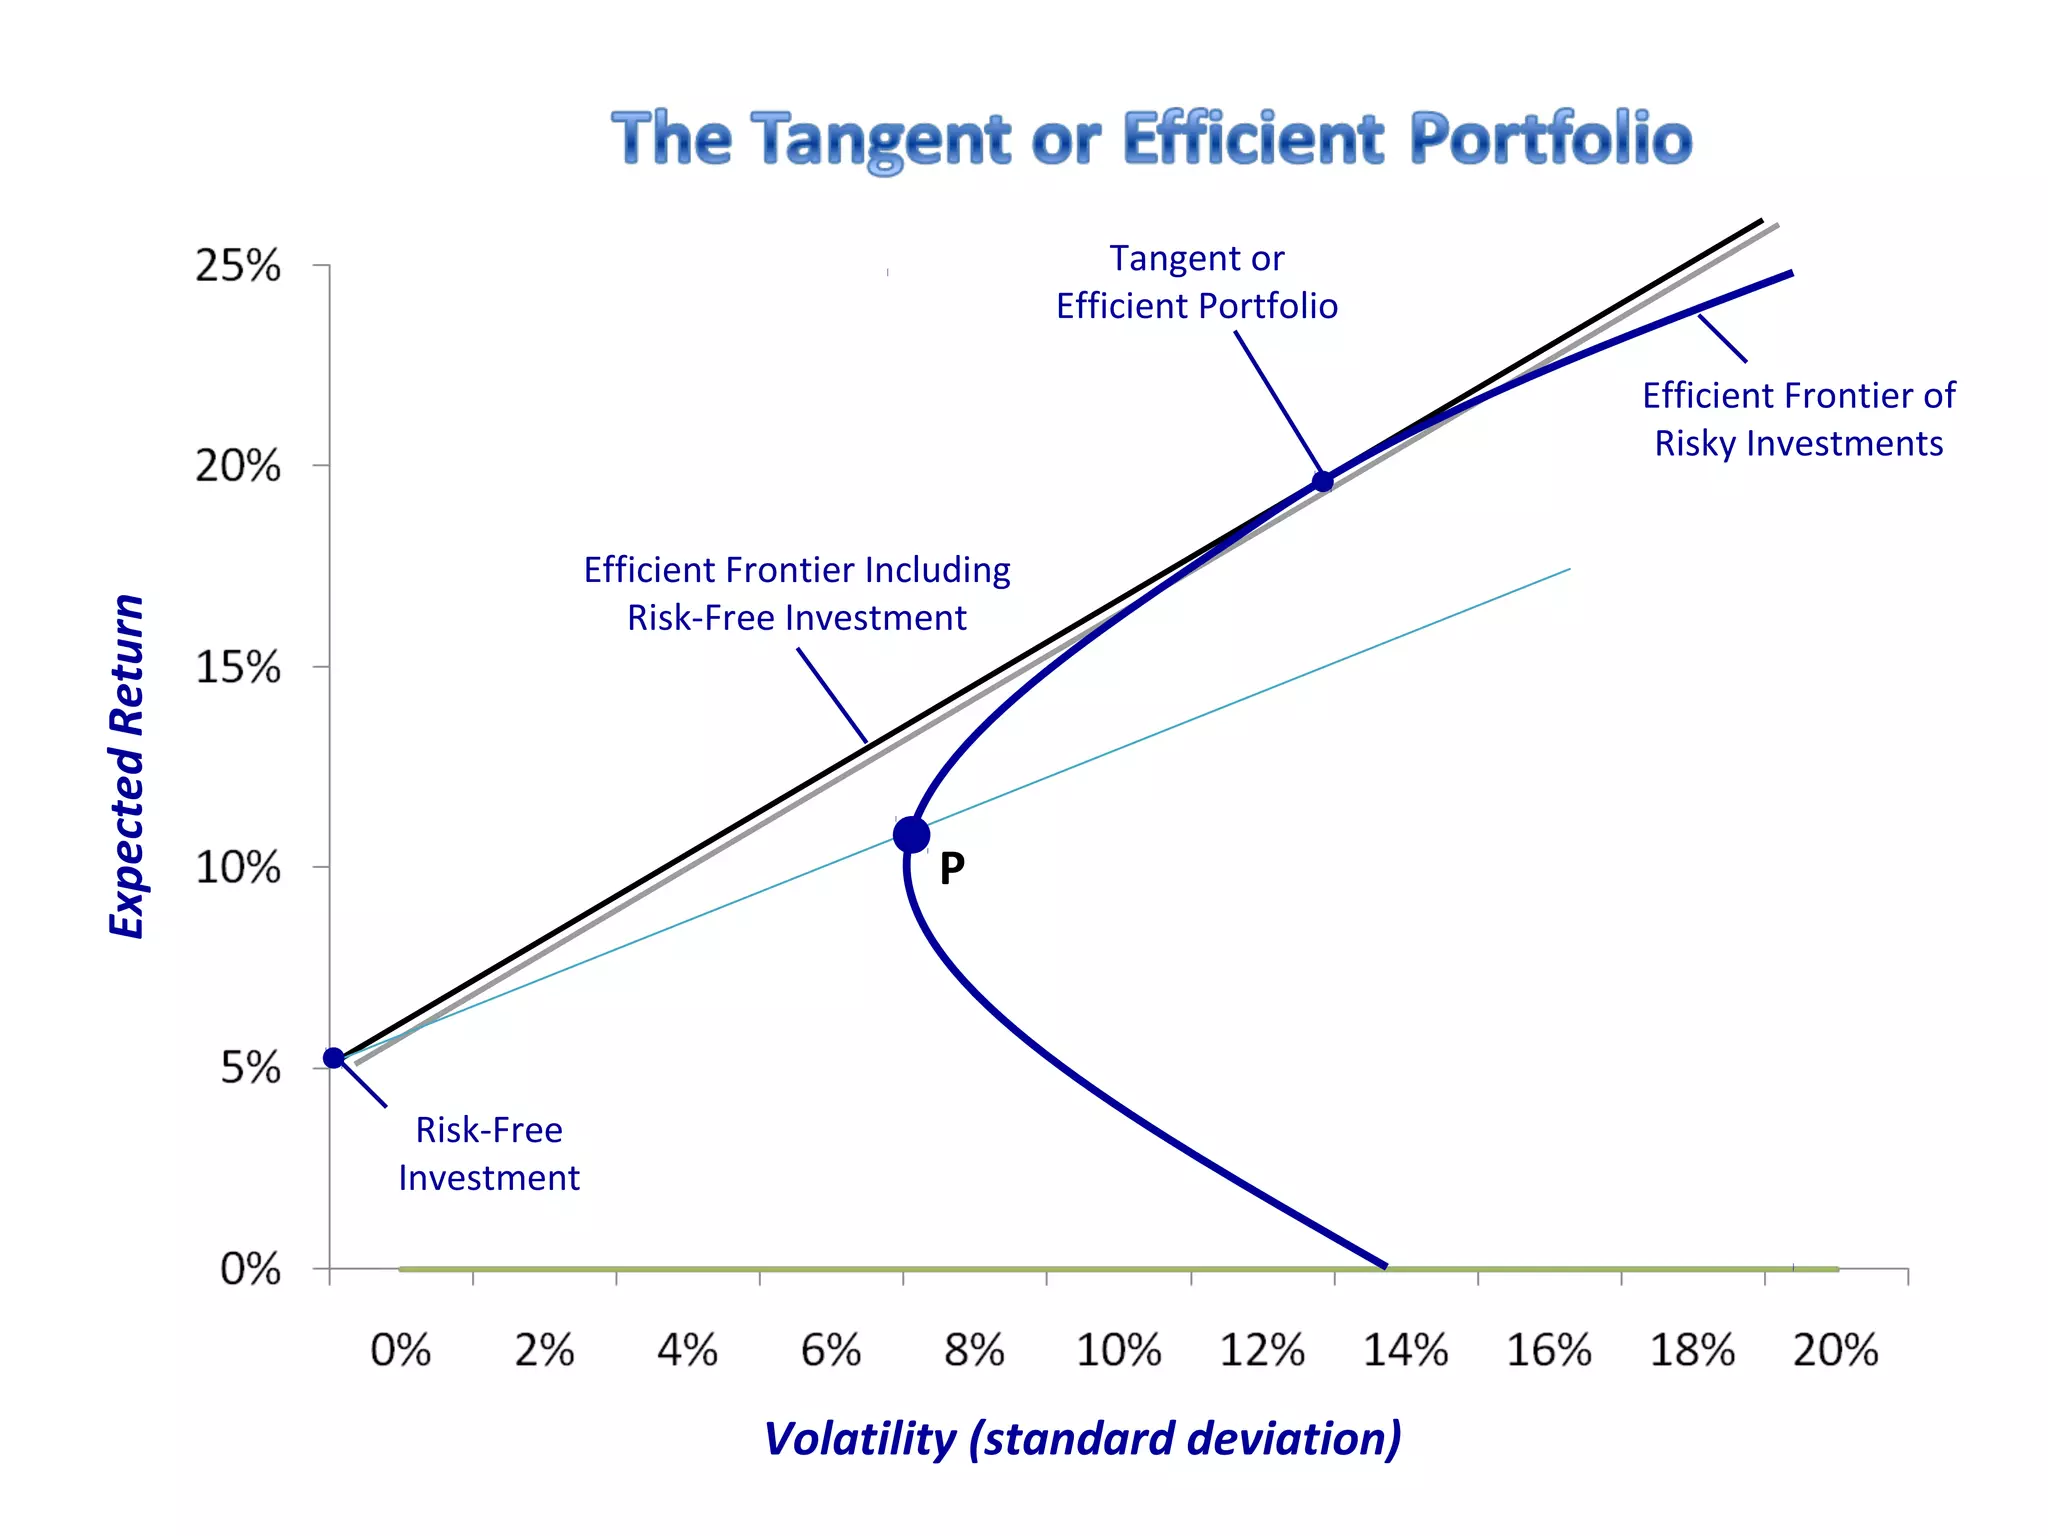
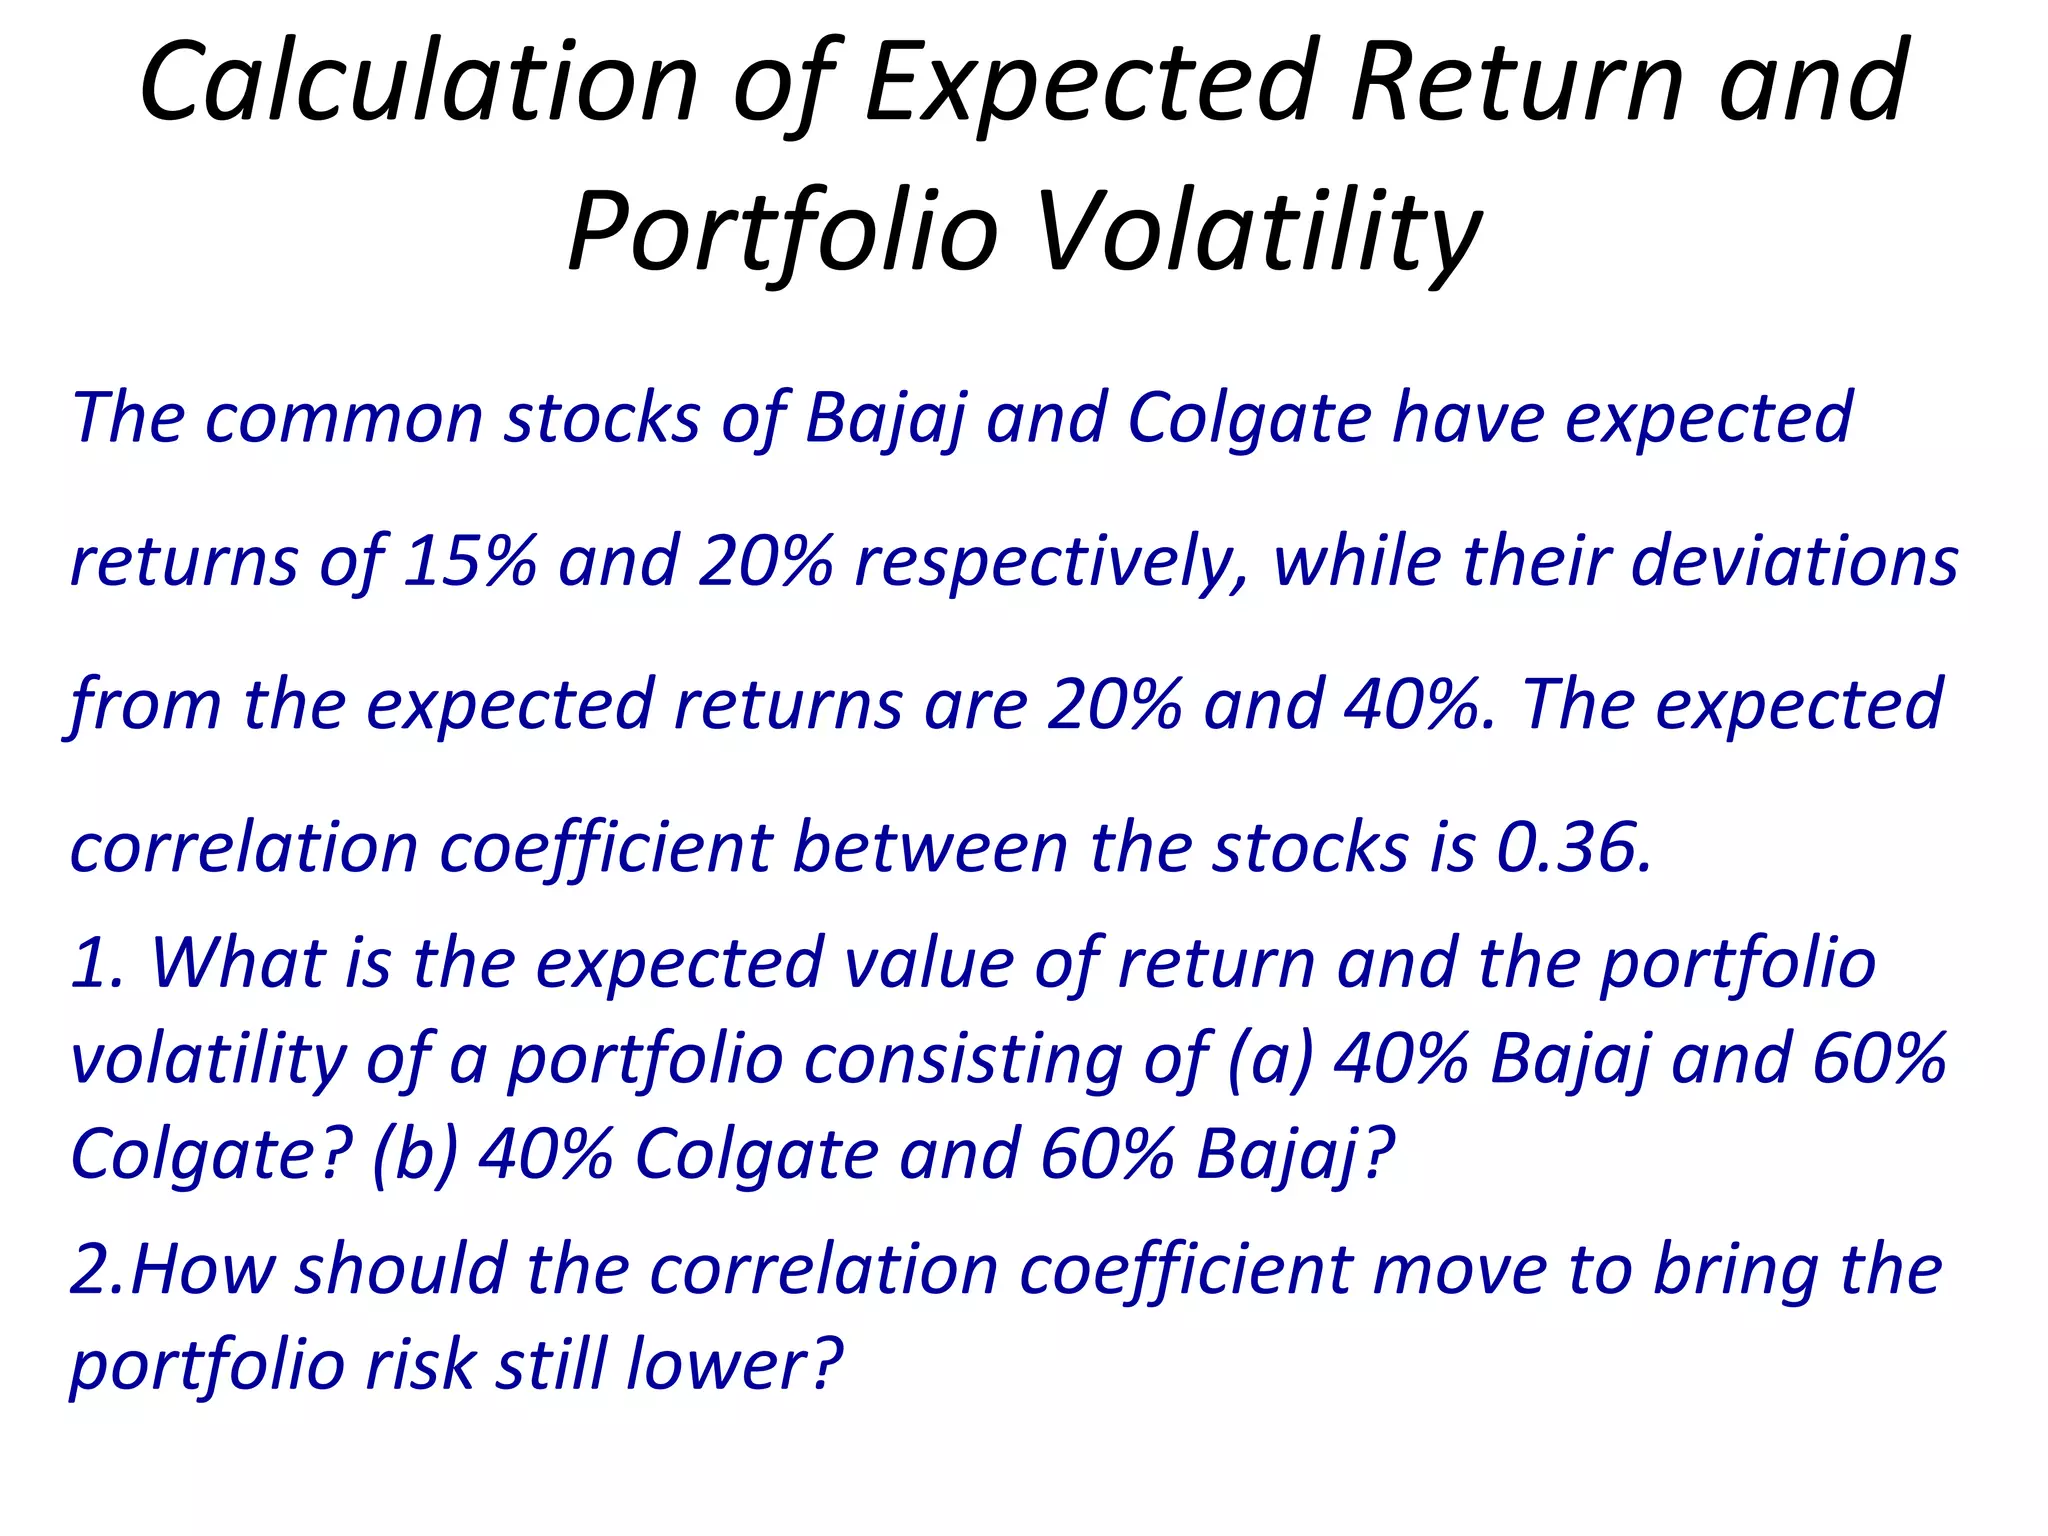
![Sharpe Ratio
The slope of the return through a given portfolio
P is often referred to as the Sharpe ratio of the
portfolio.
Sharpe Ratio = Portfolio Excess Return
Portfolio Volatility
= E[Rp] – rf
σ p
The Sharpe ratio measures the ratio of reward-
to-volatility provided by a portfolio.](https://image.slidesharecdn.com/52f574ef-c685-411a-9eef-22b7400c3ee7-161101093153/75/Optimal-Portfolio-Choice-28-2048.jpg)