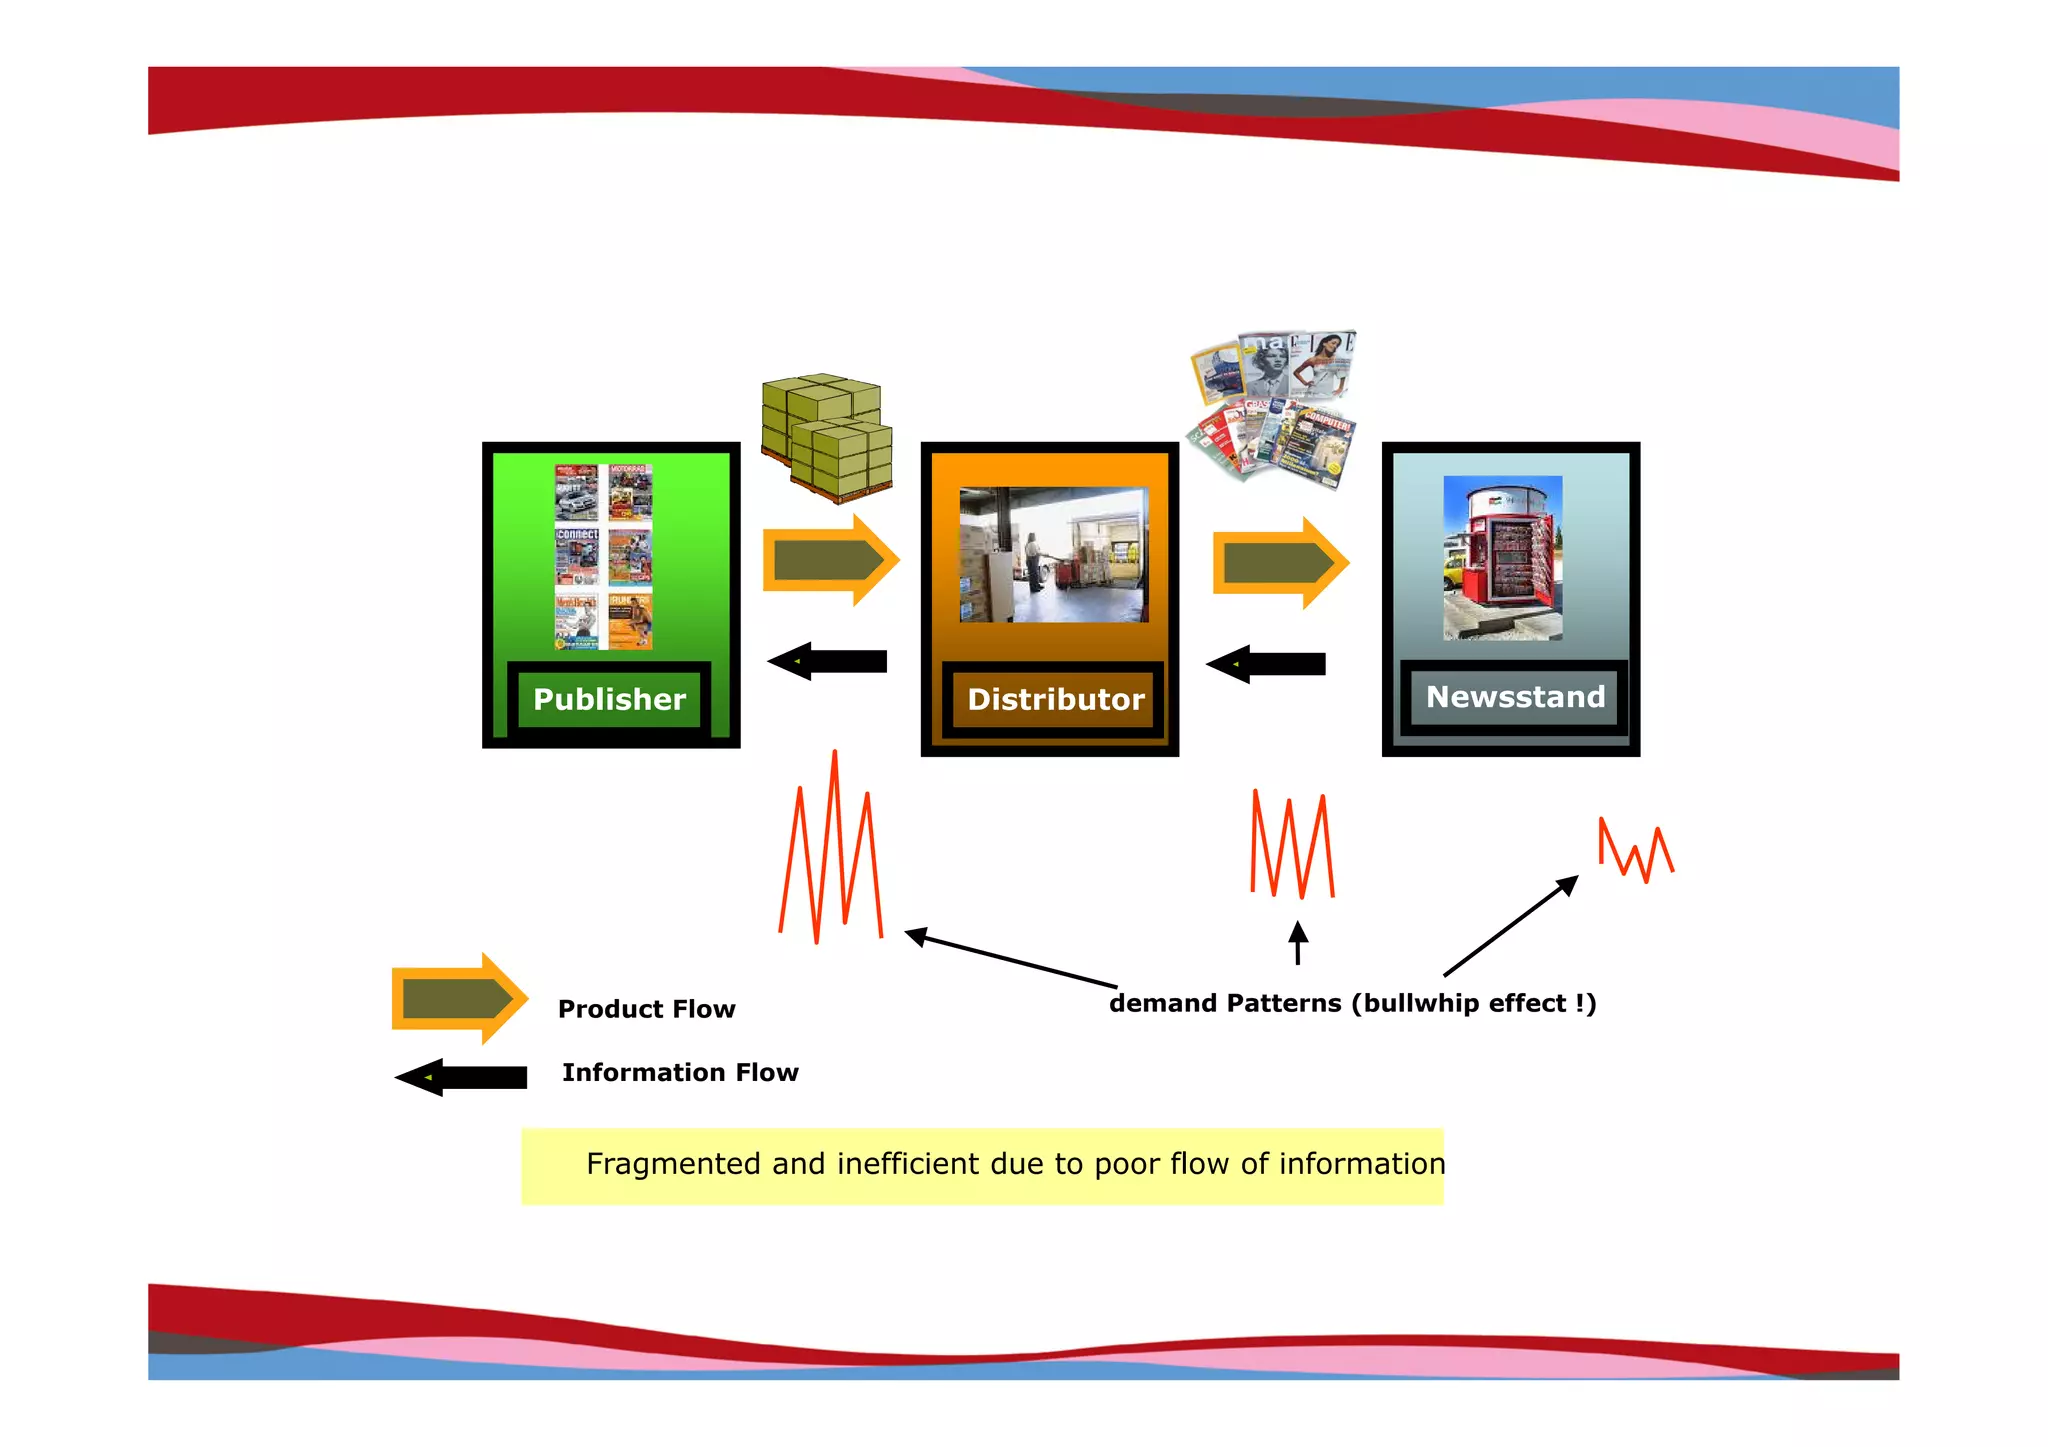
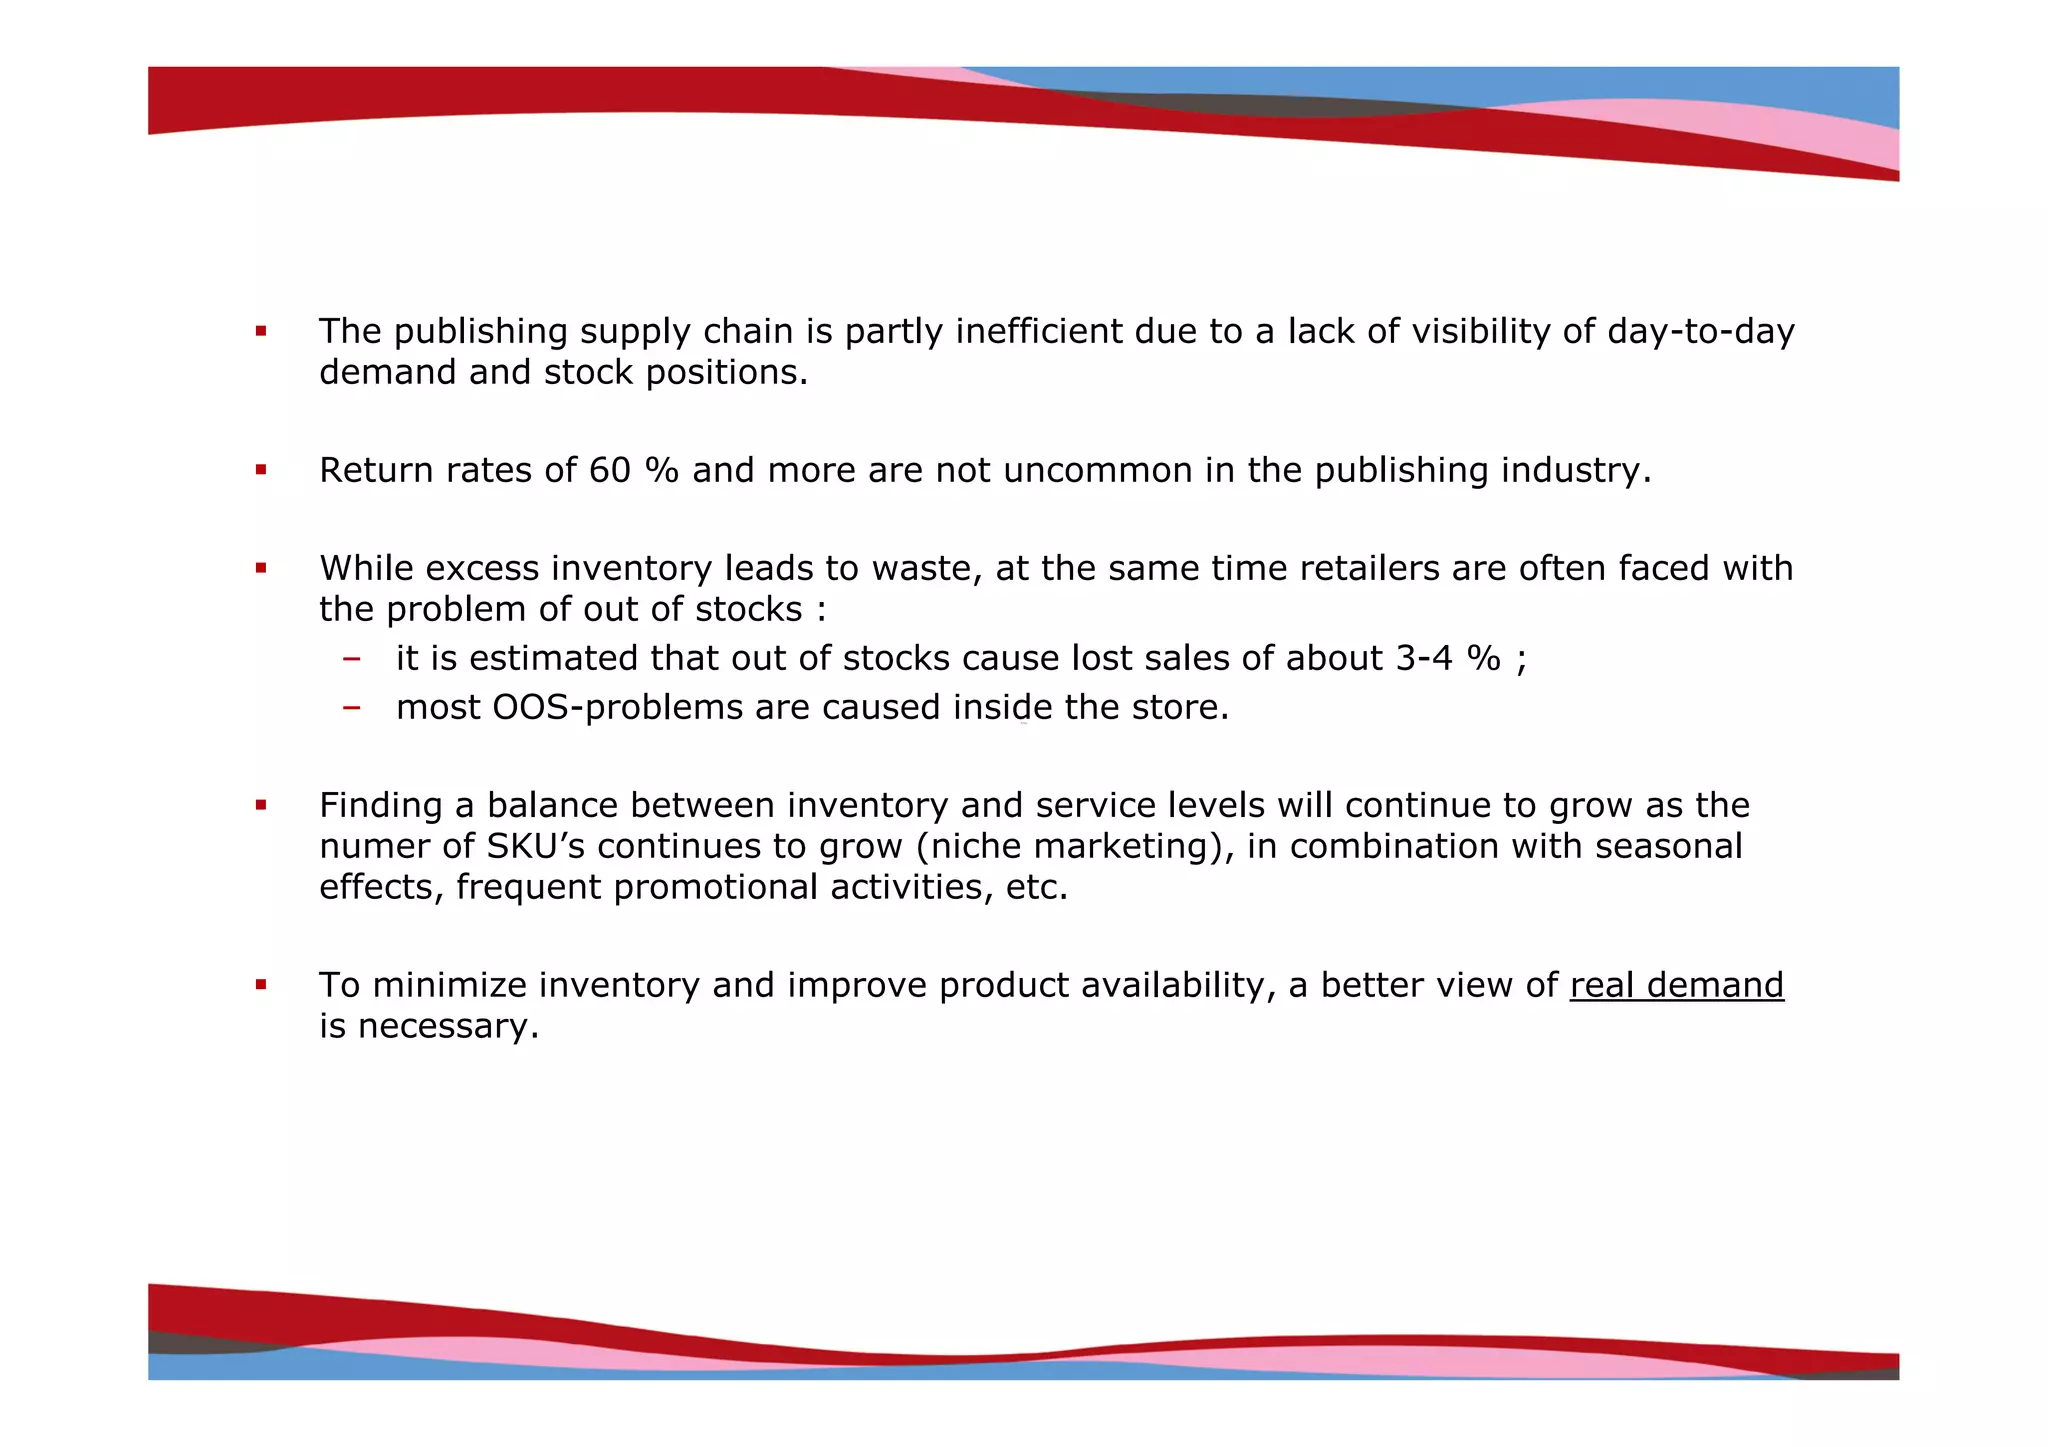
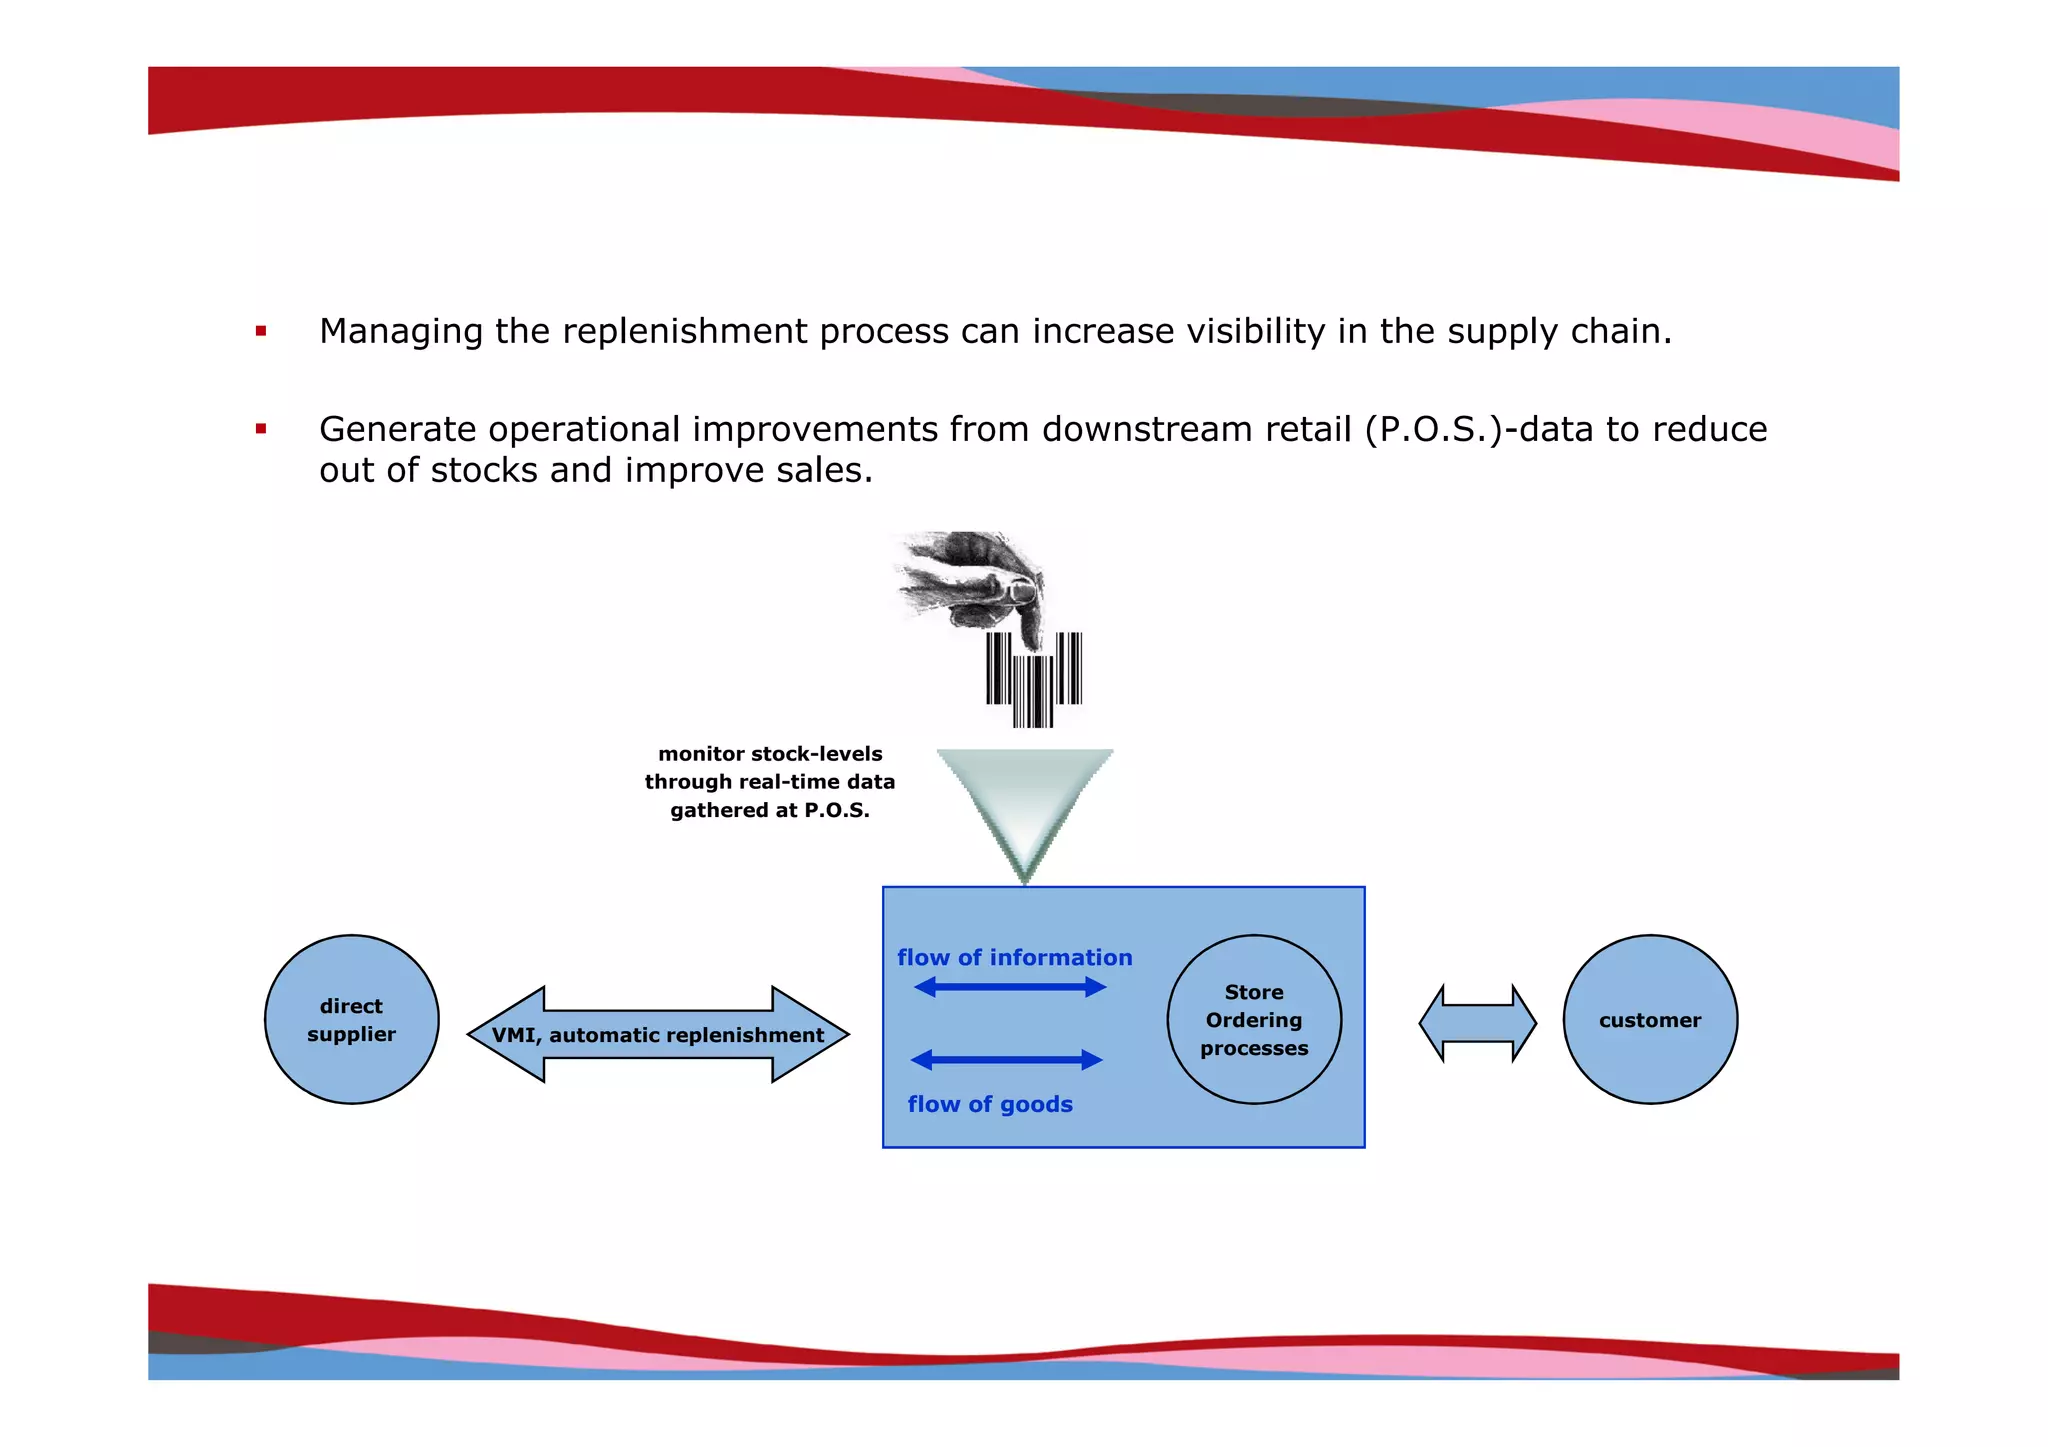
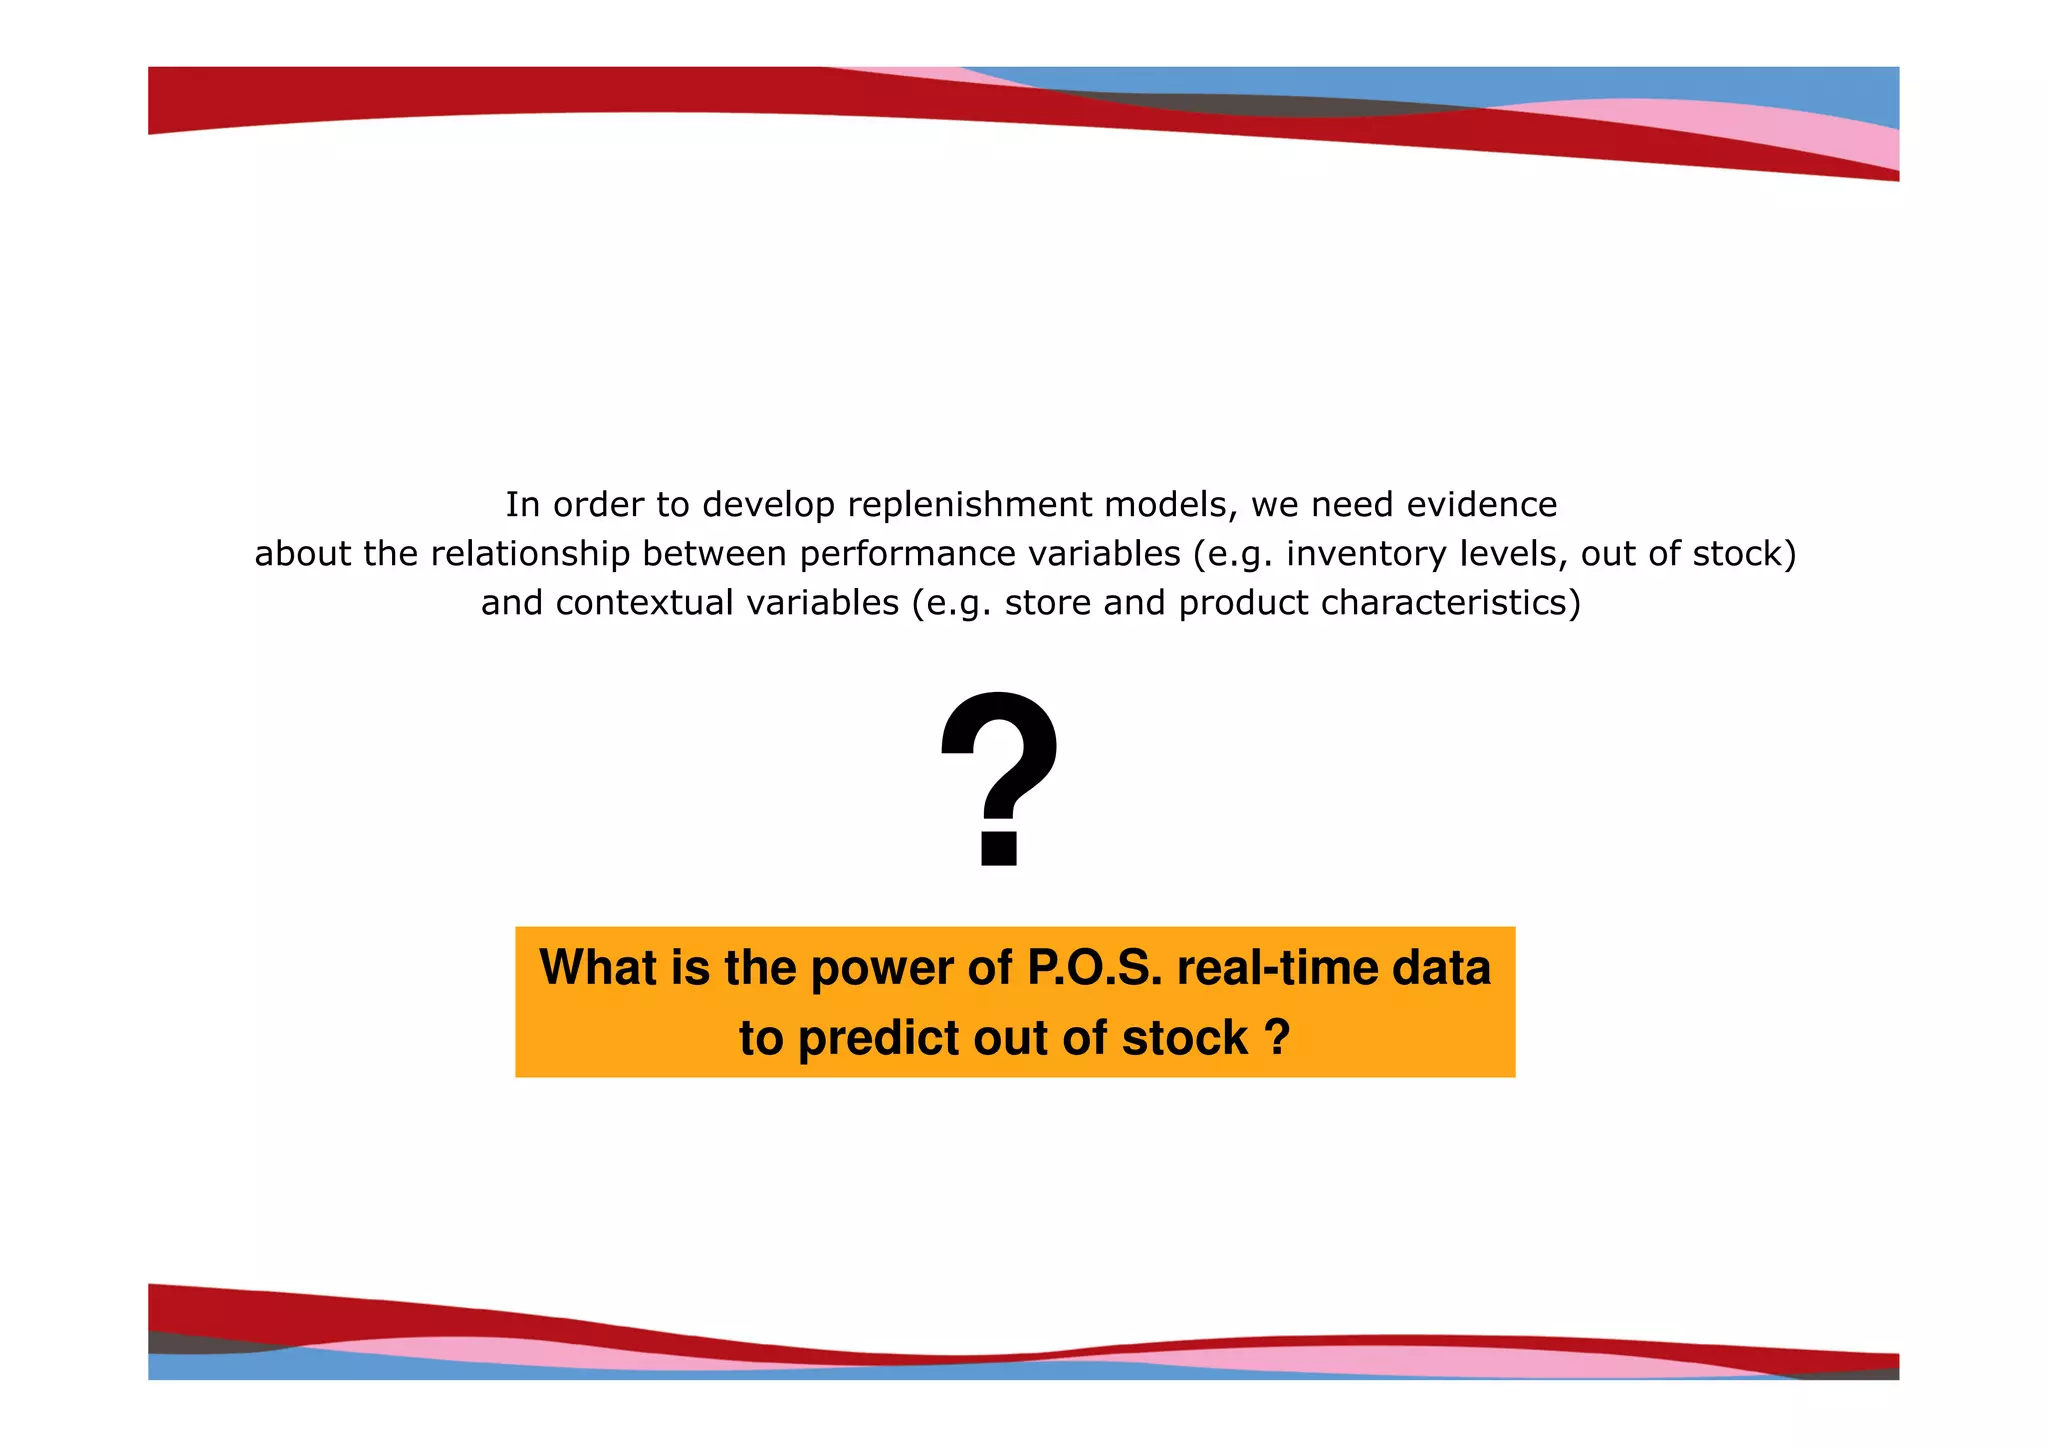
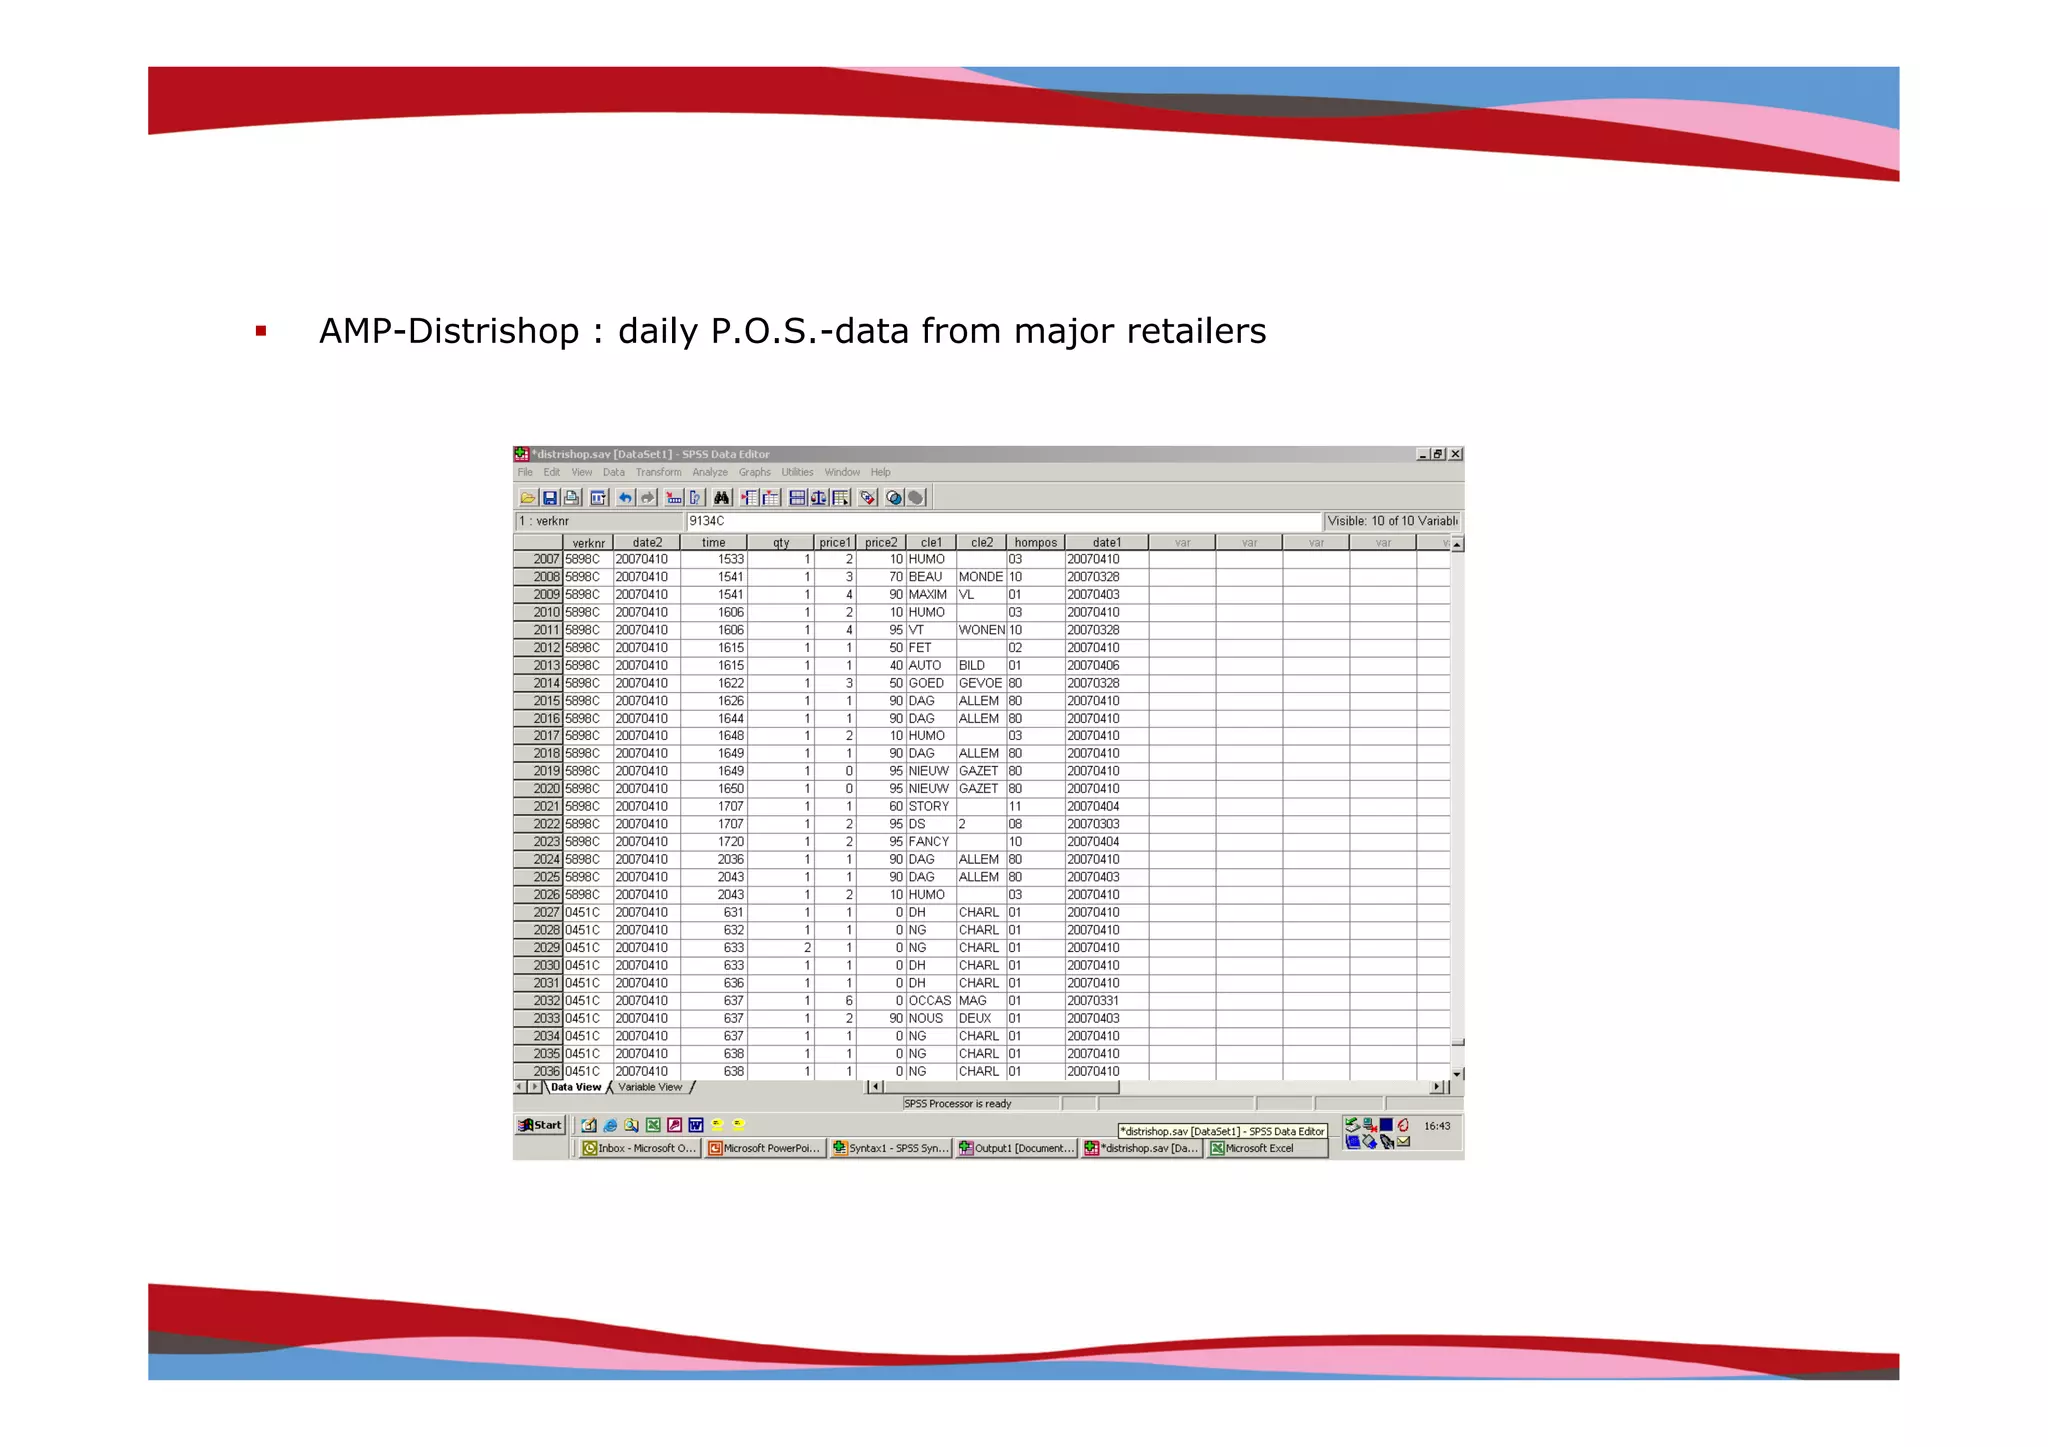
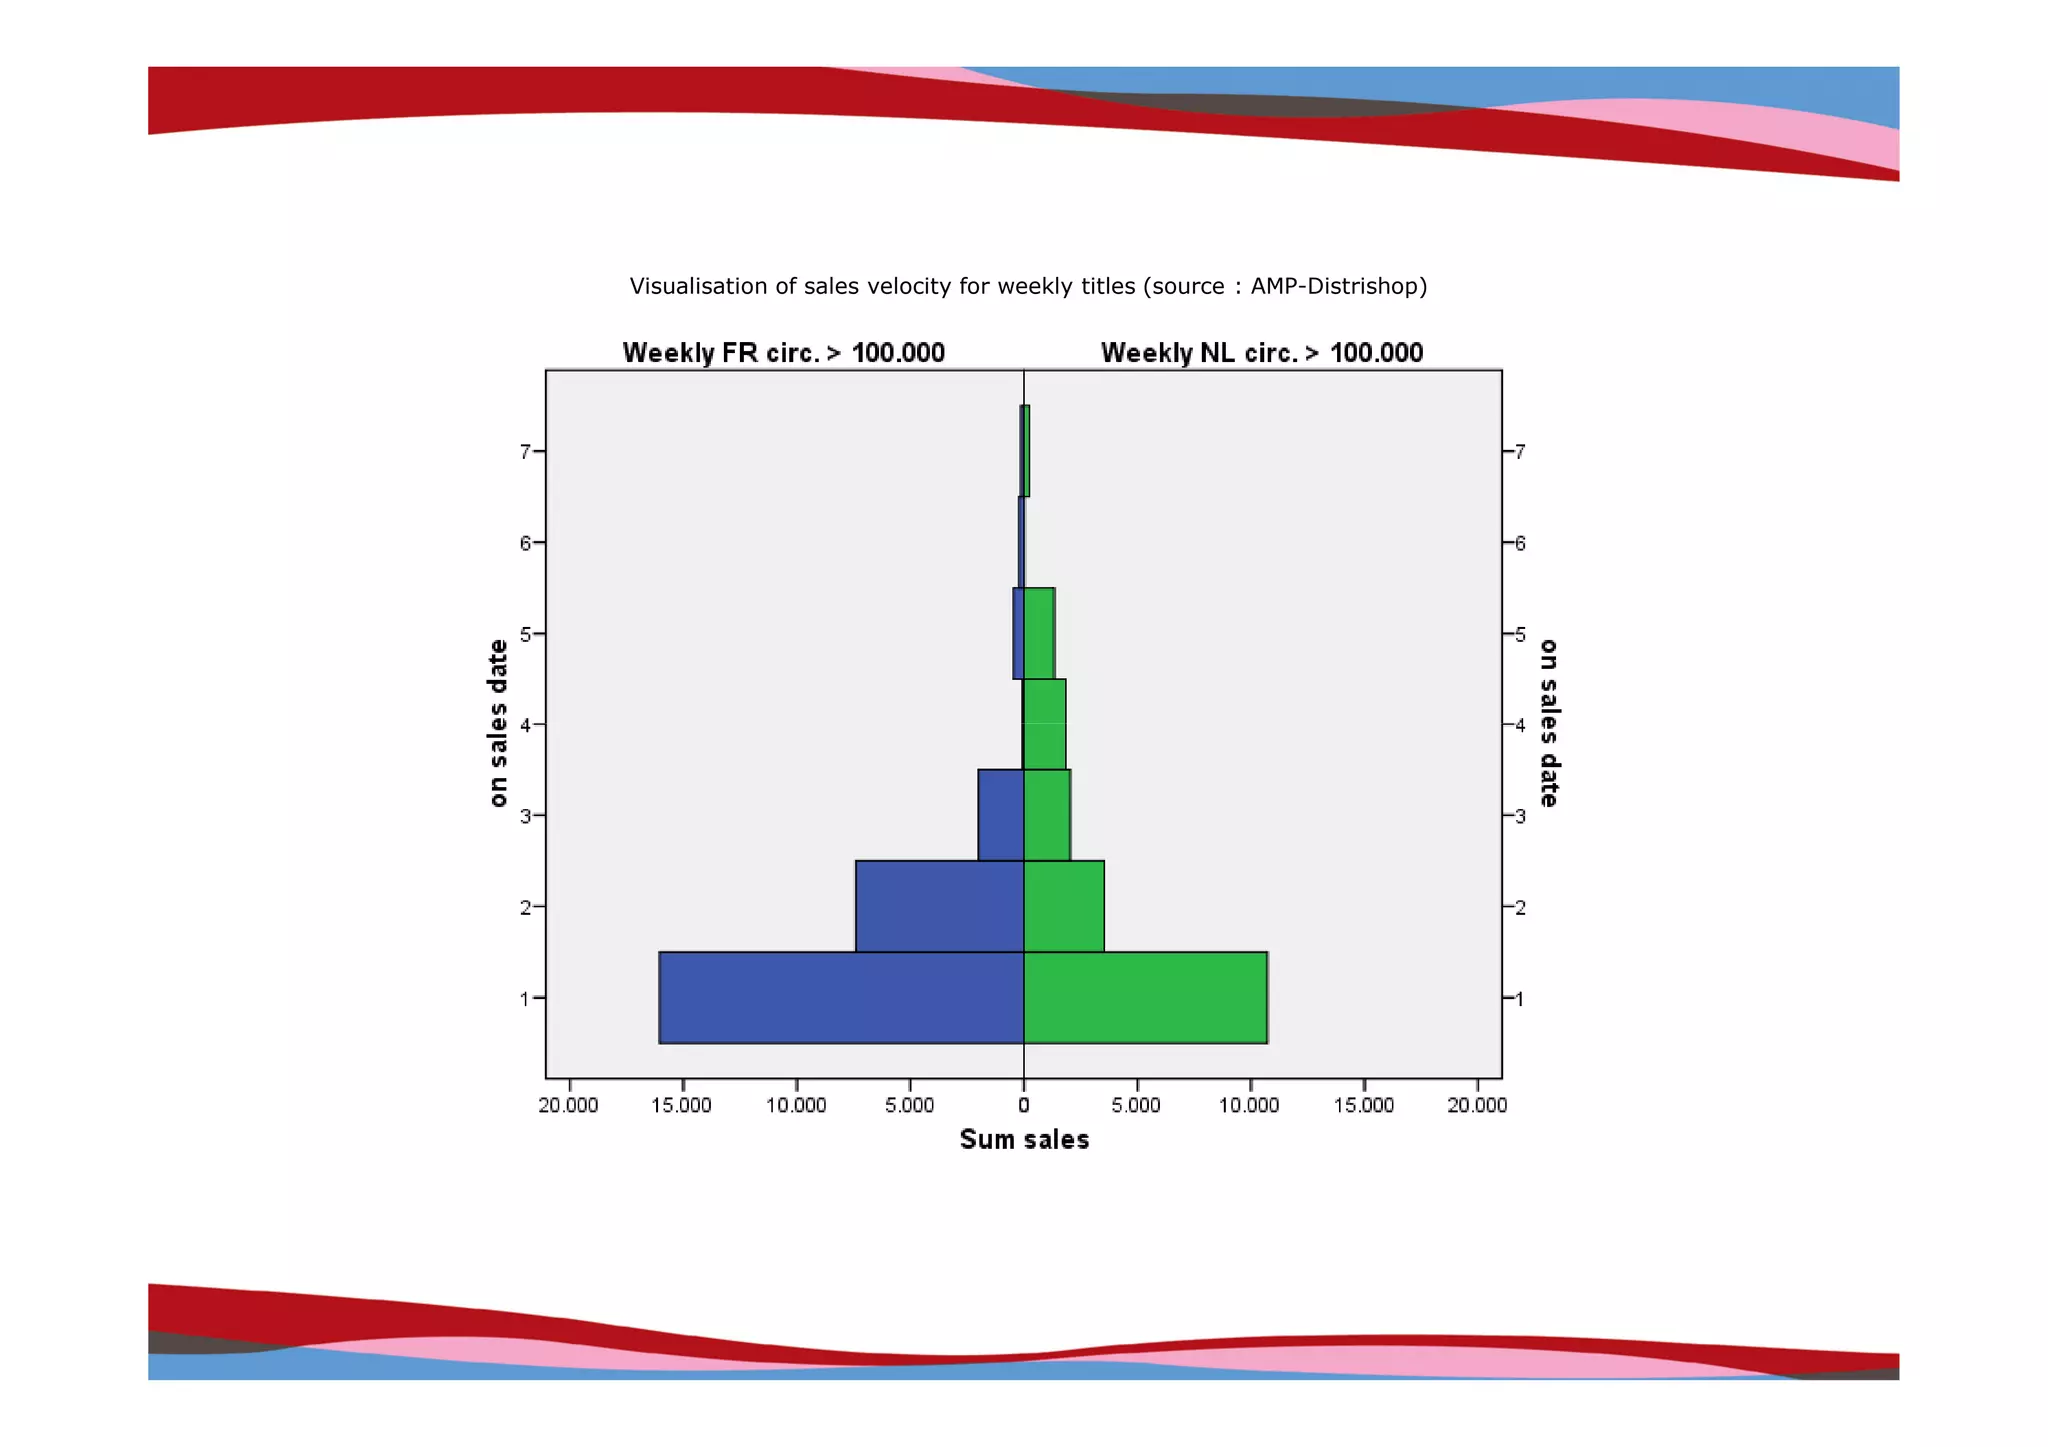
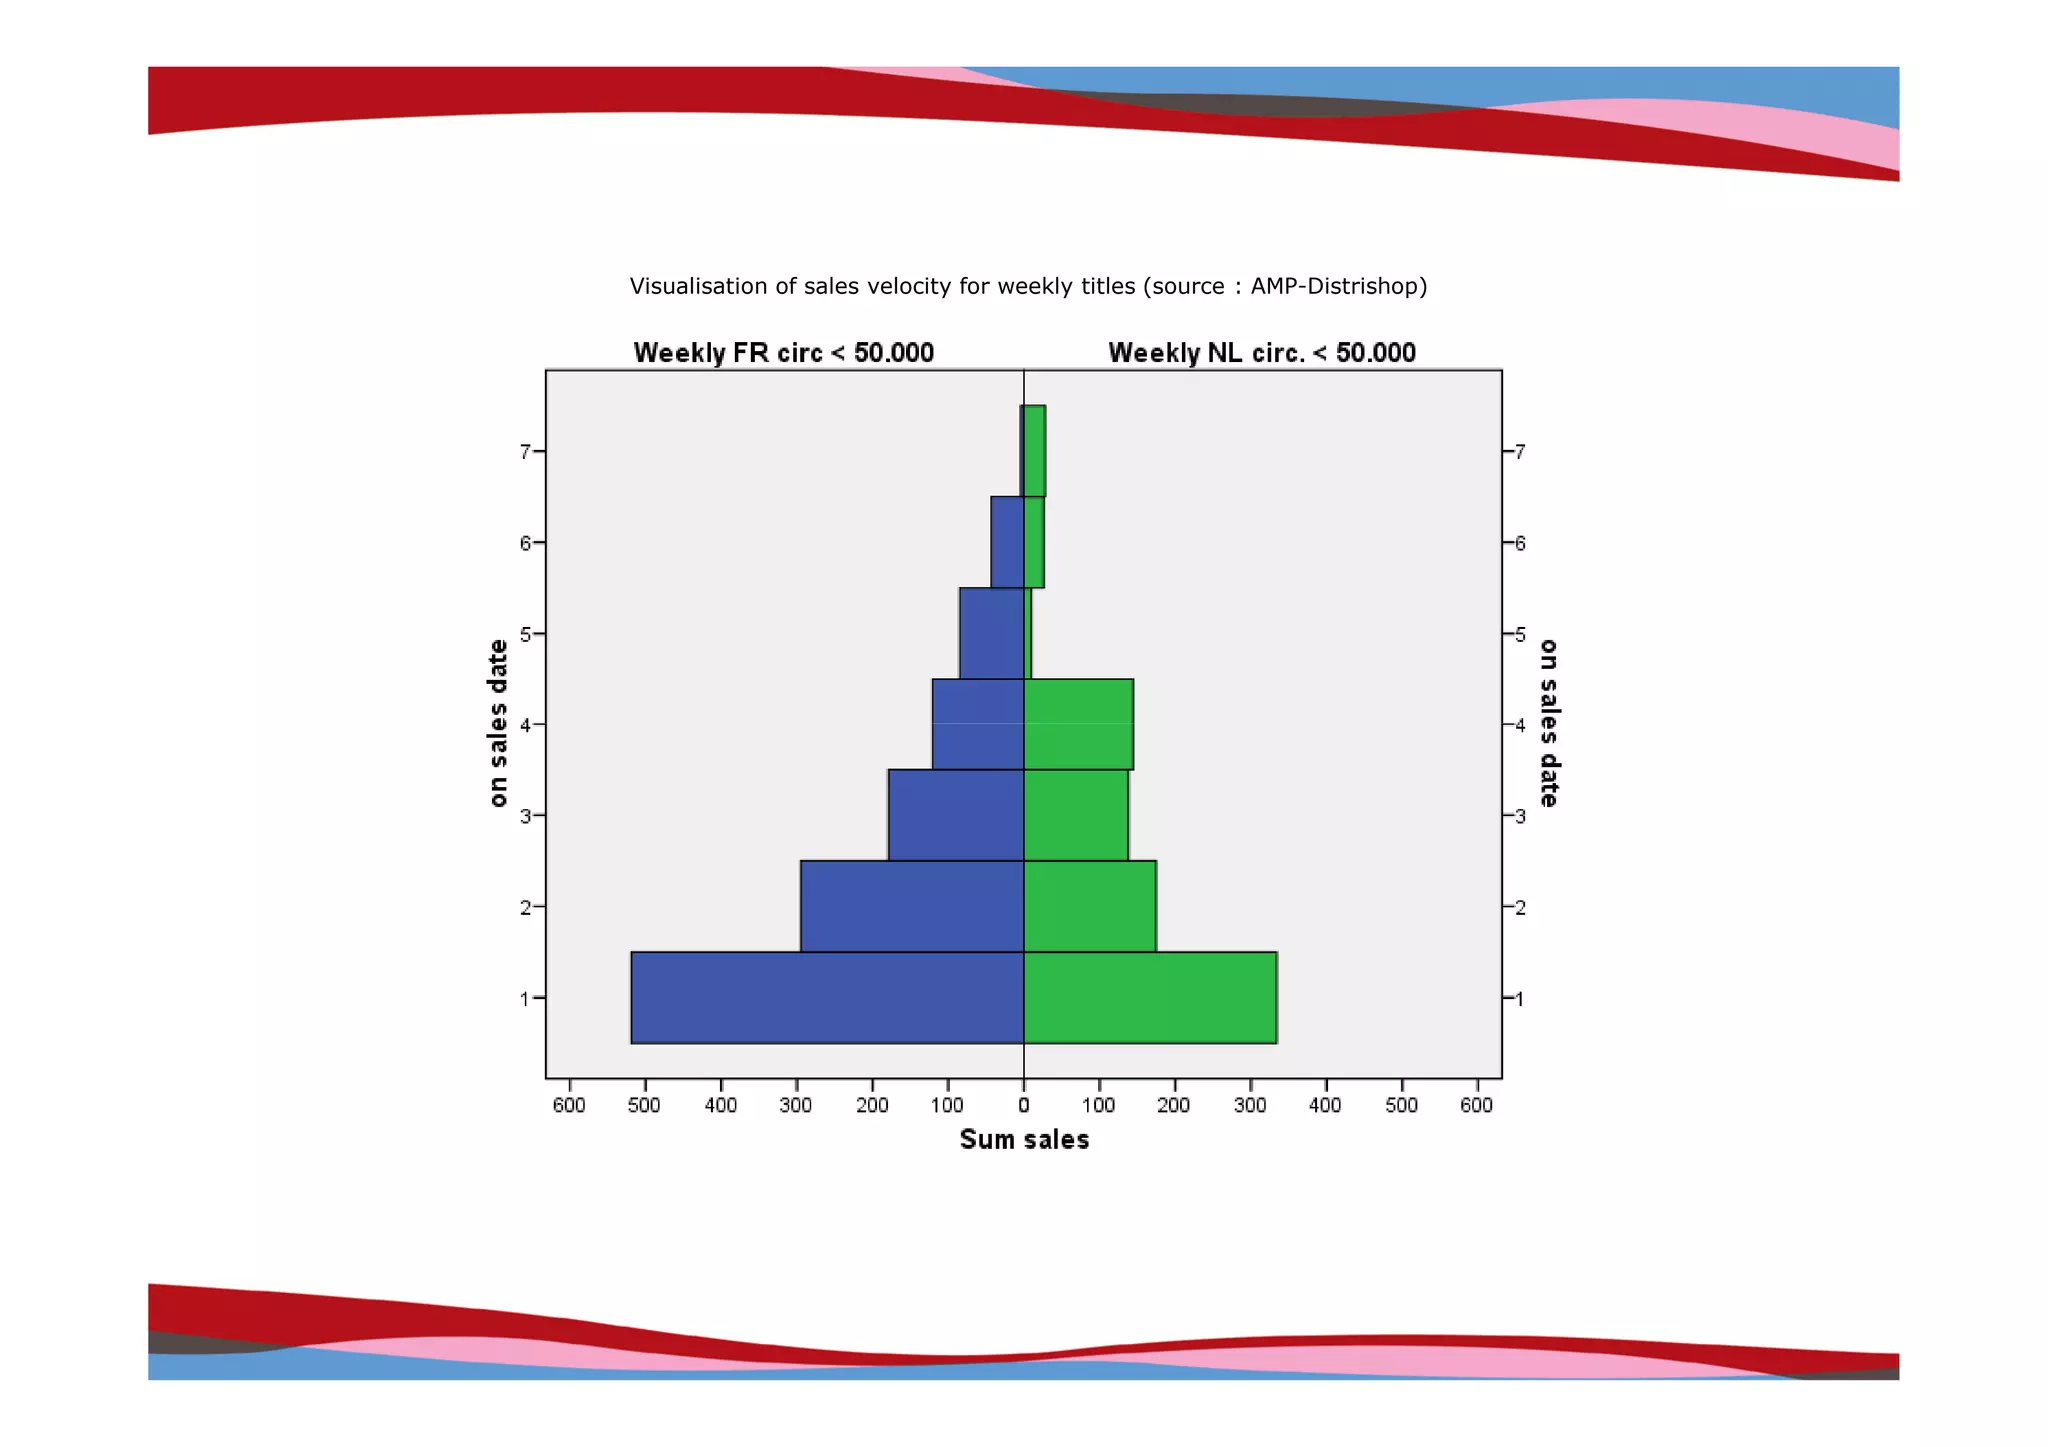
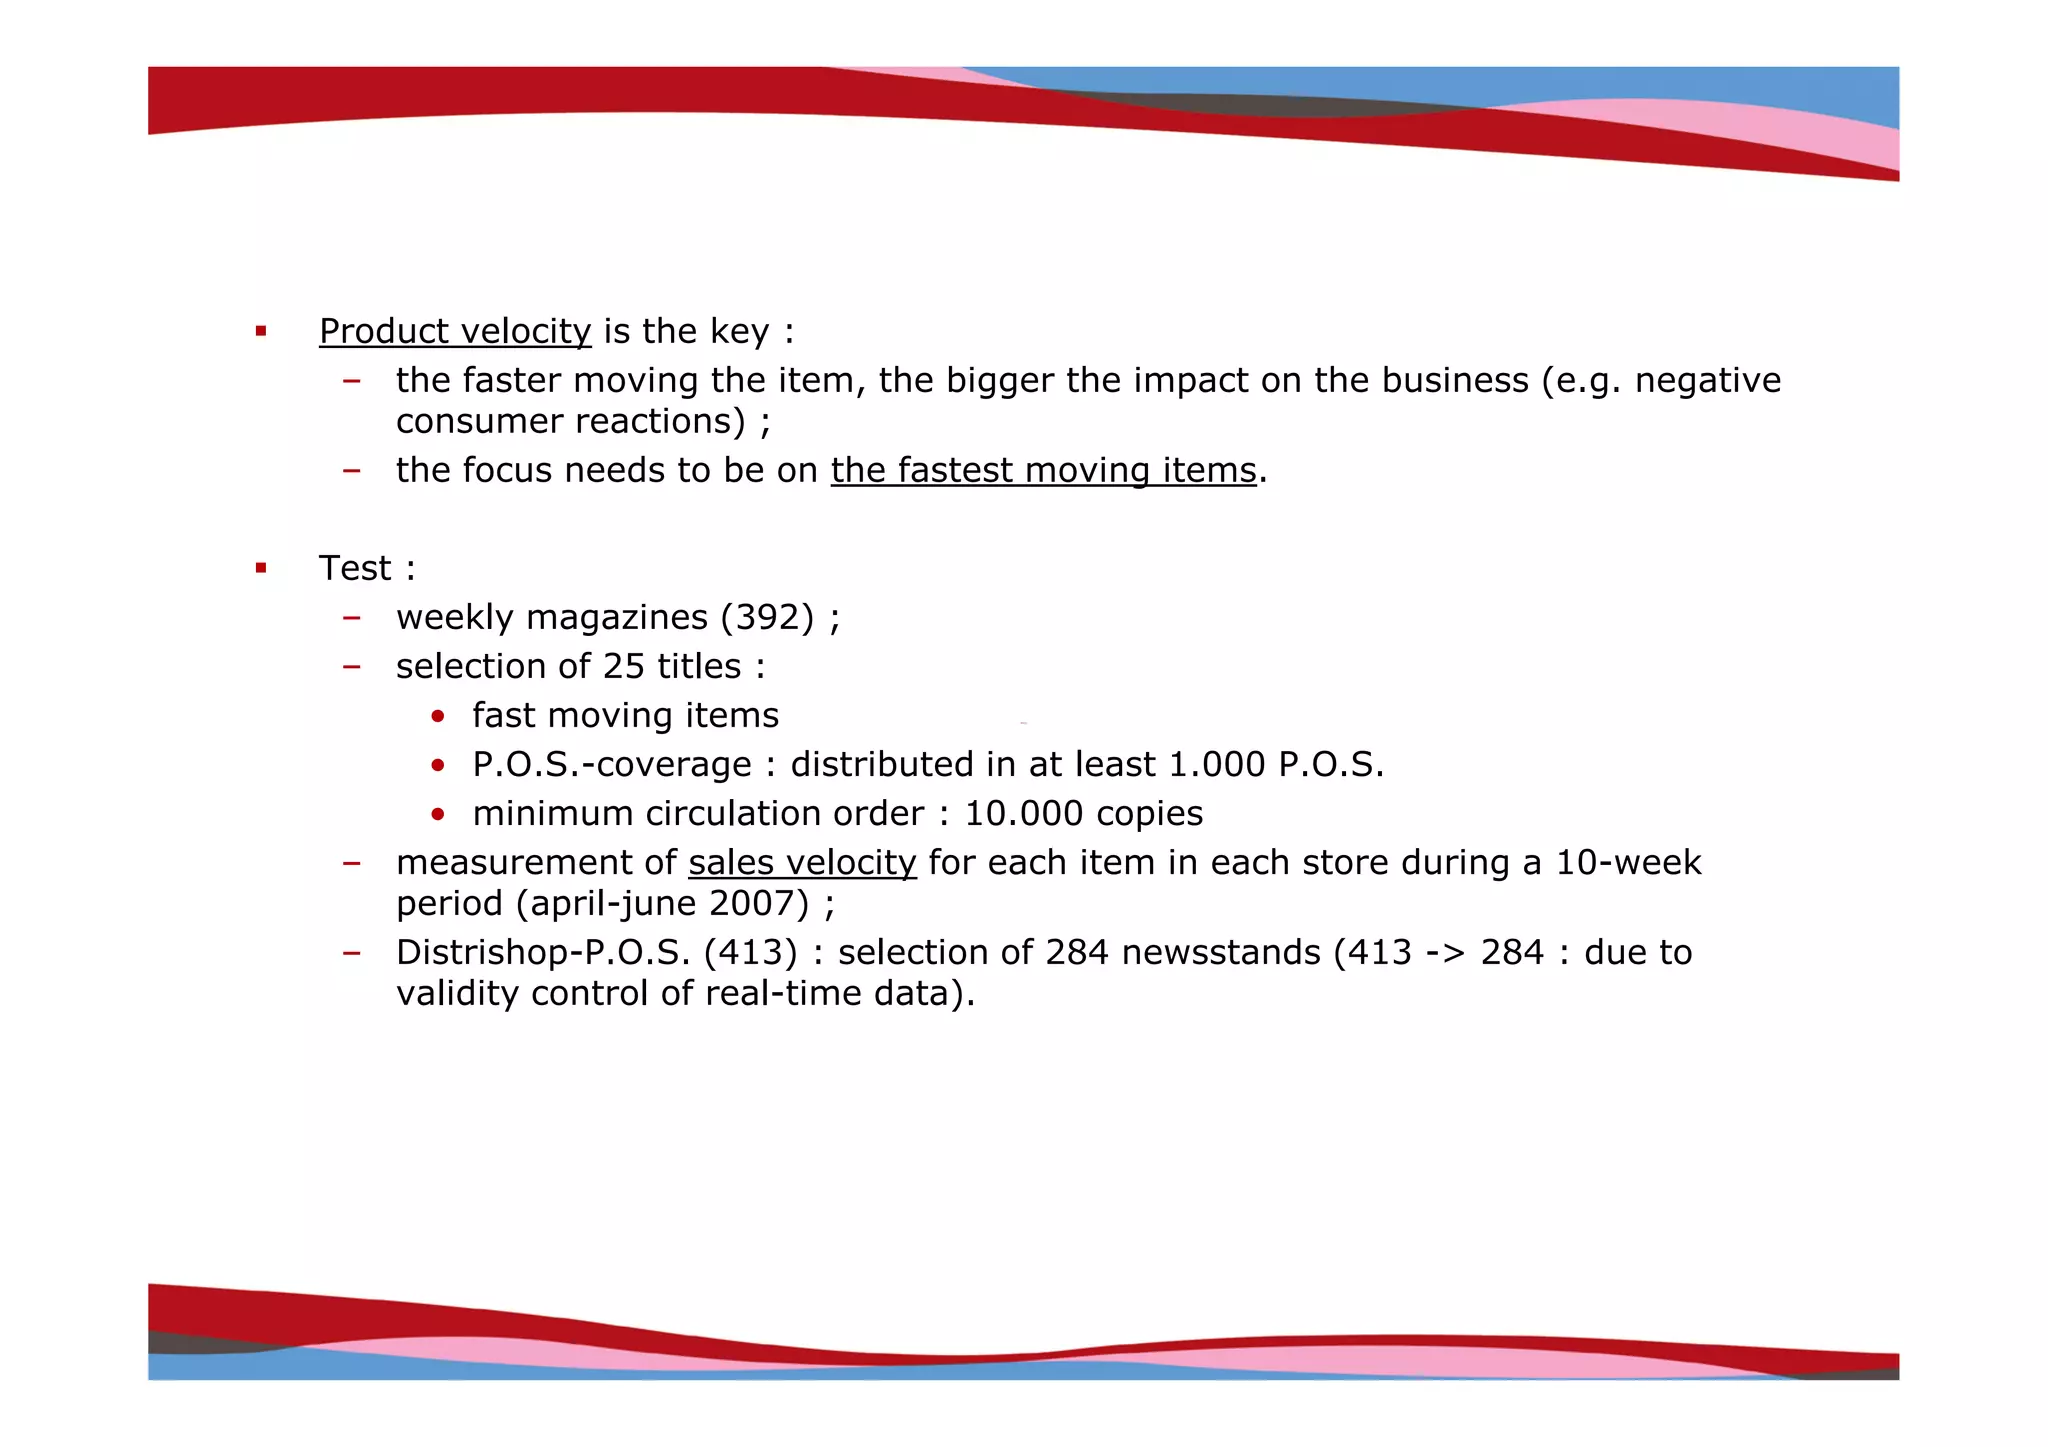
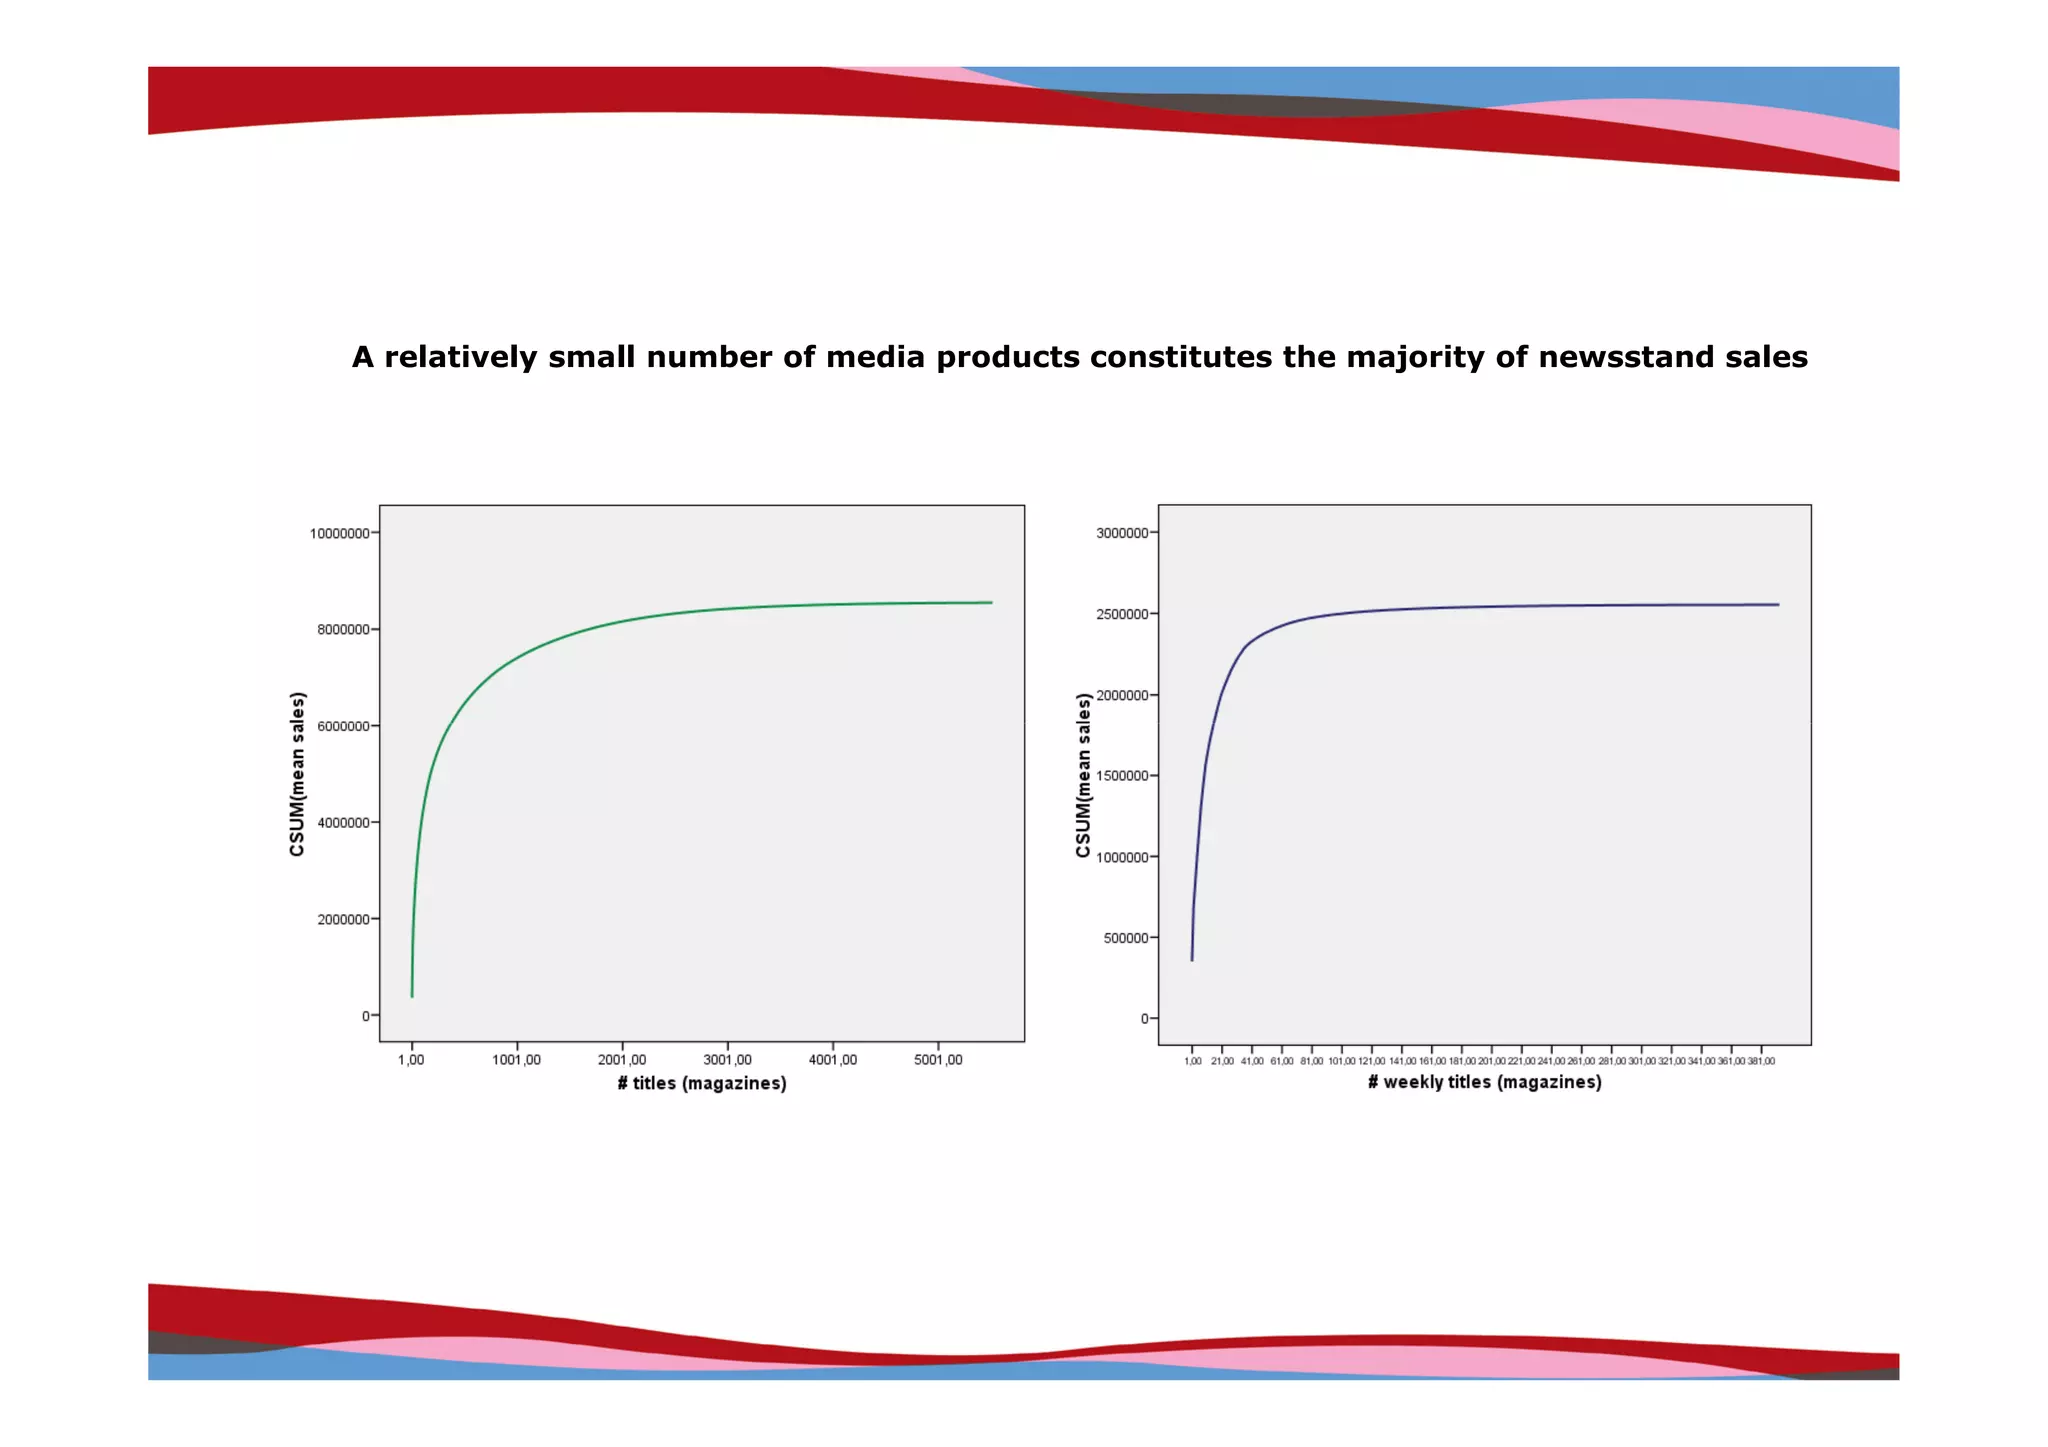
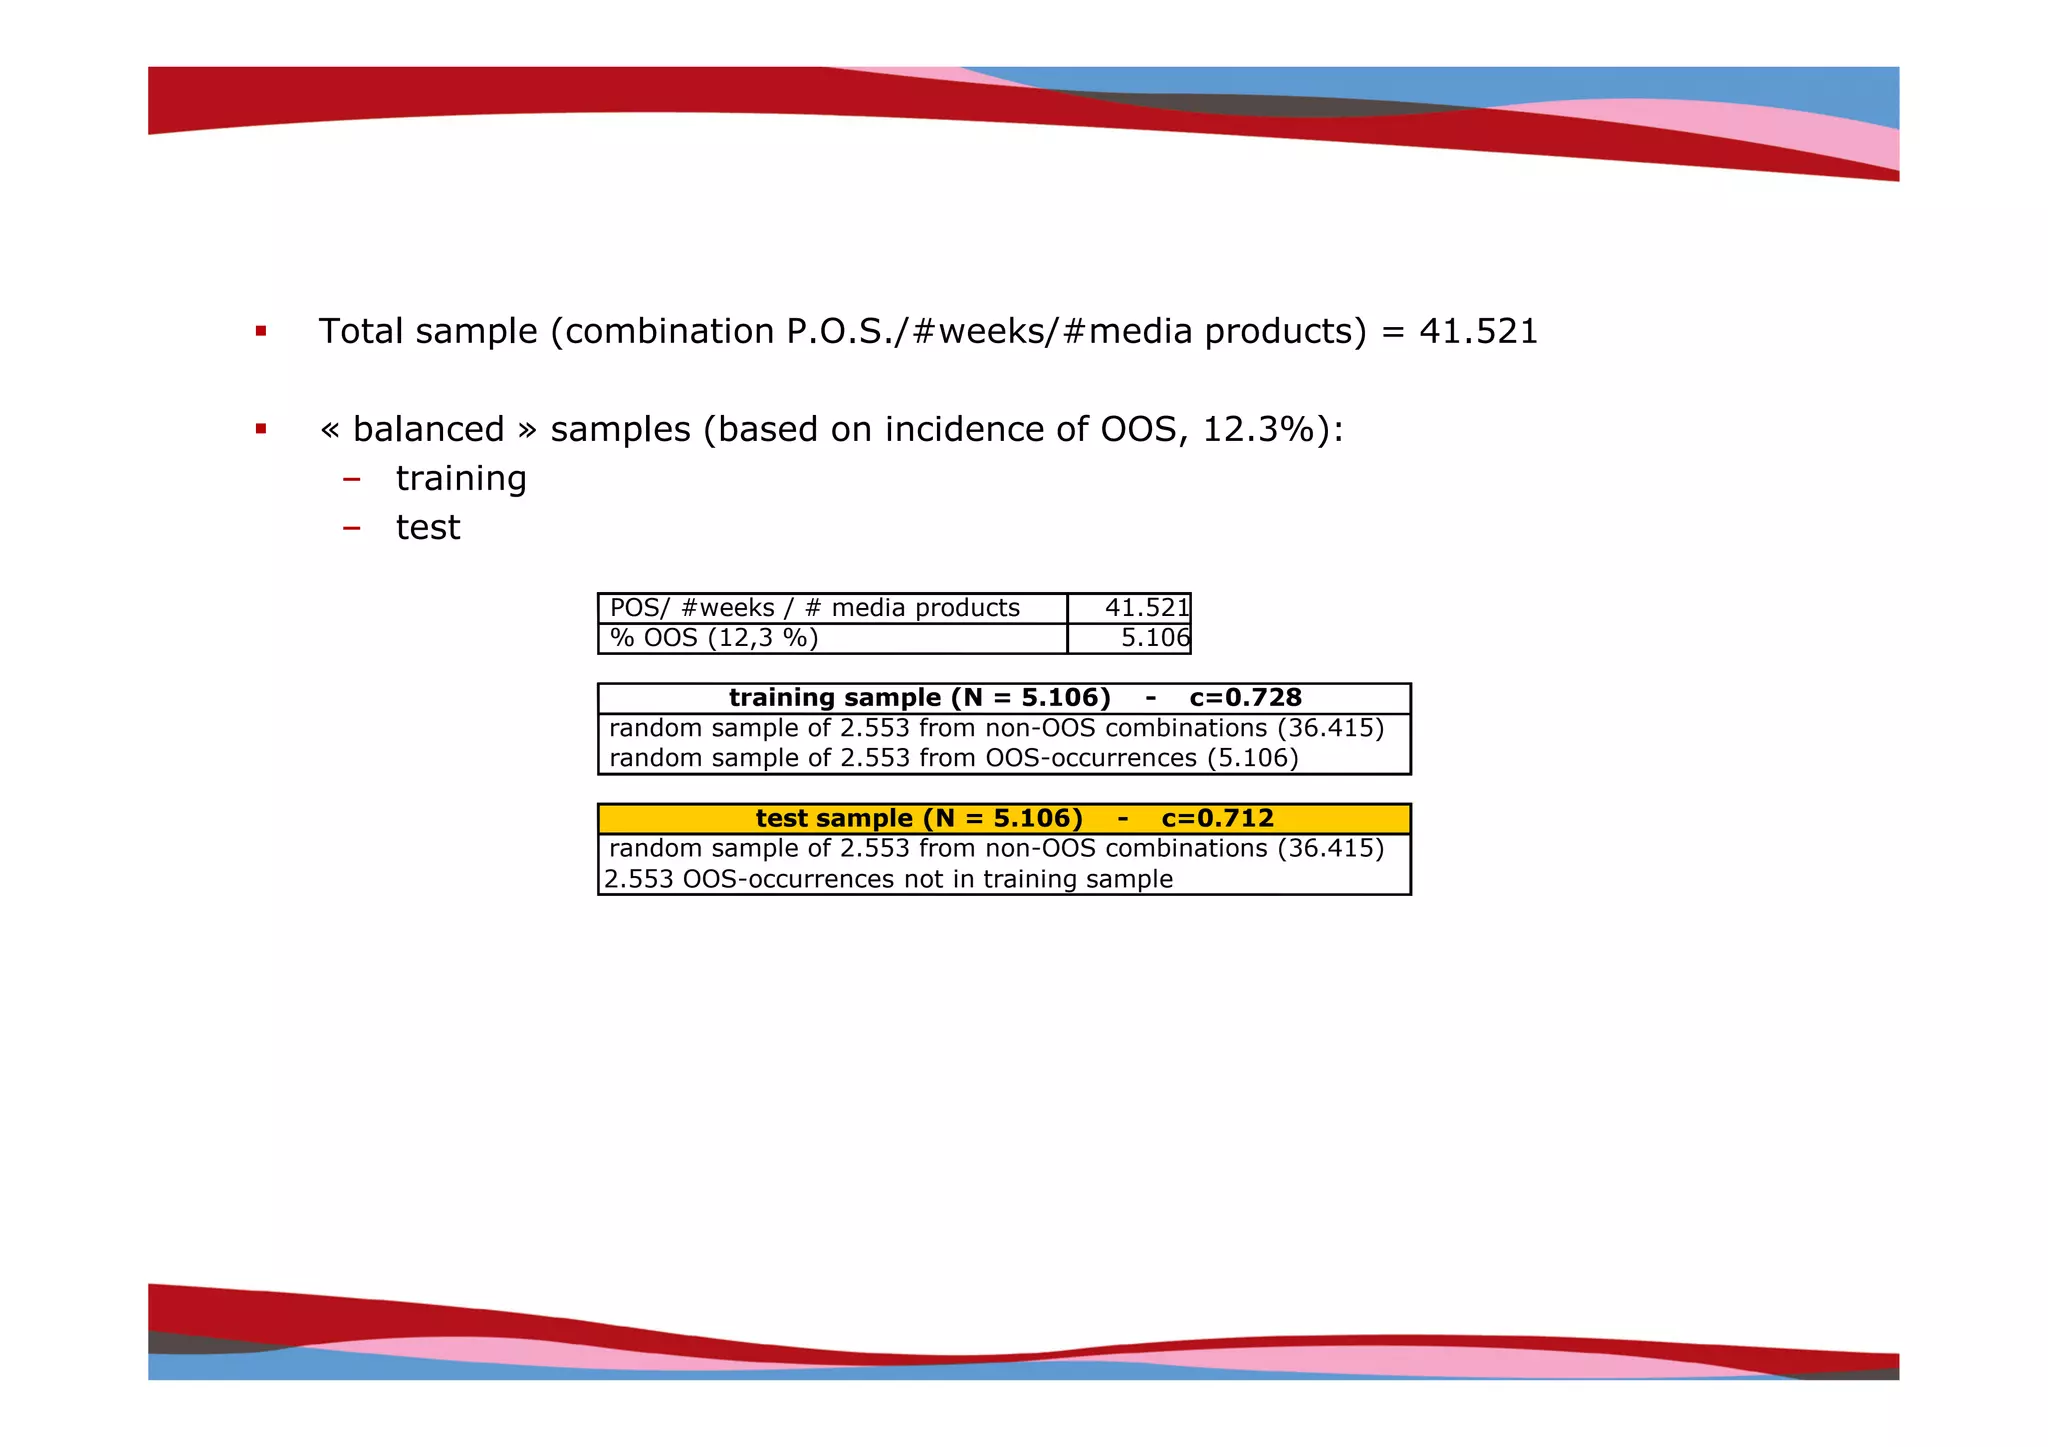
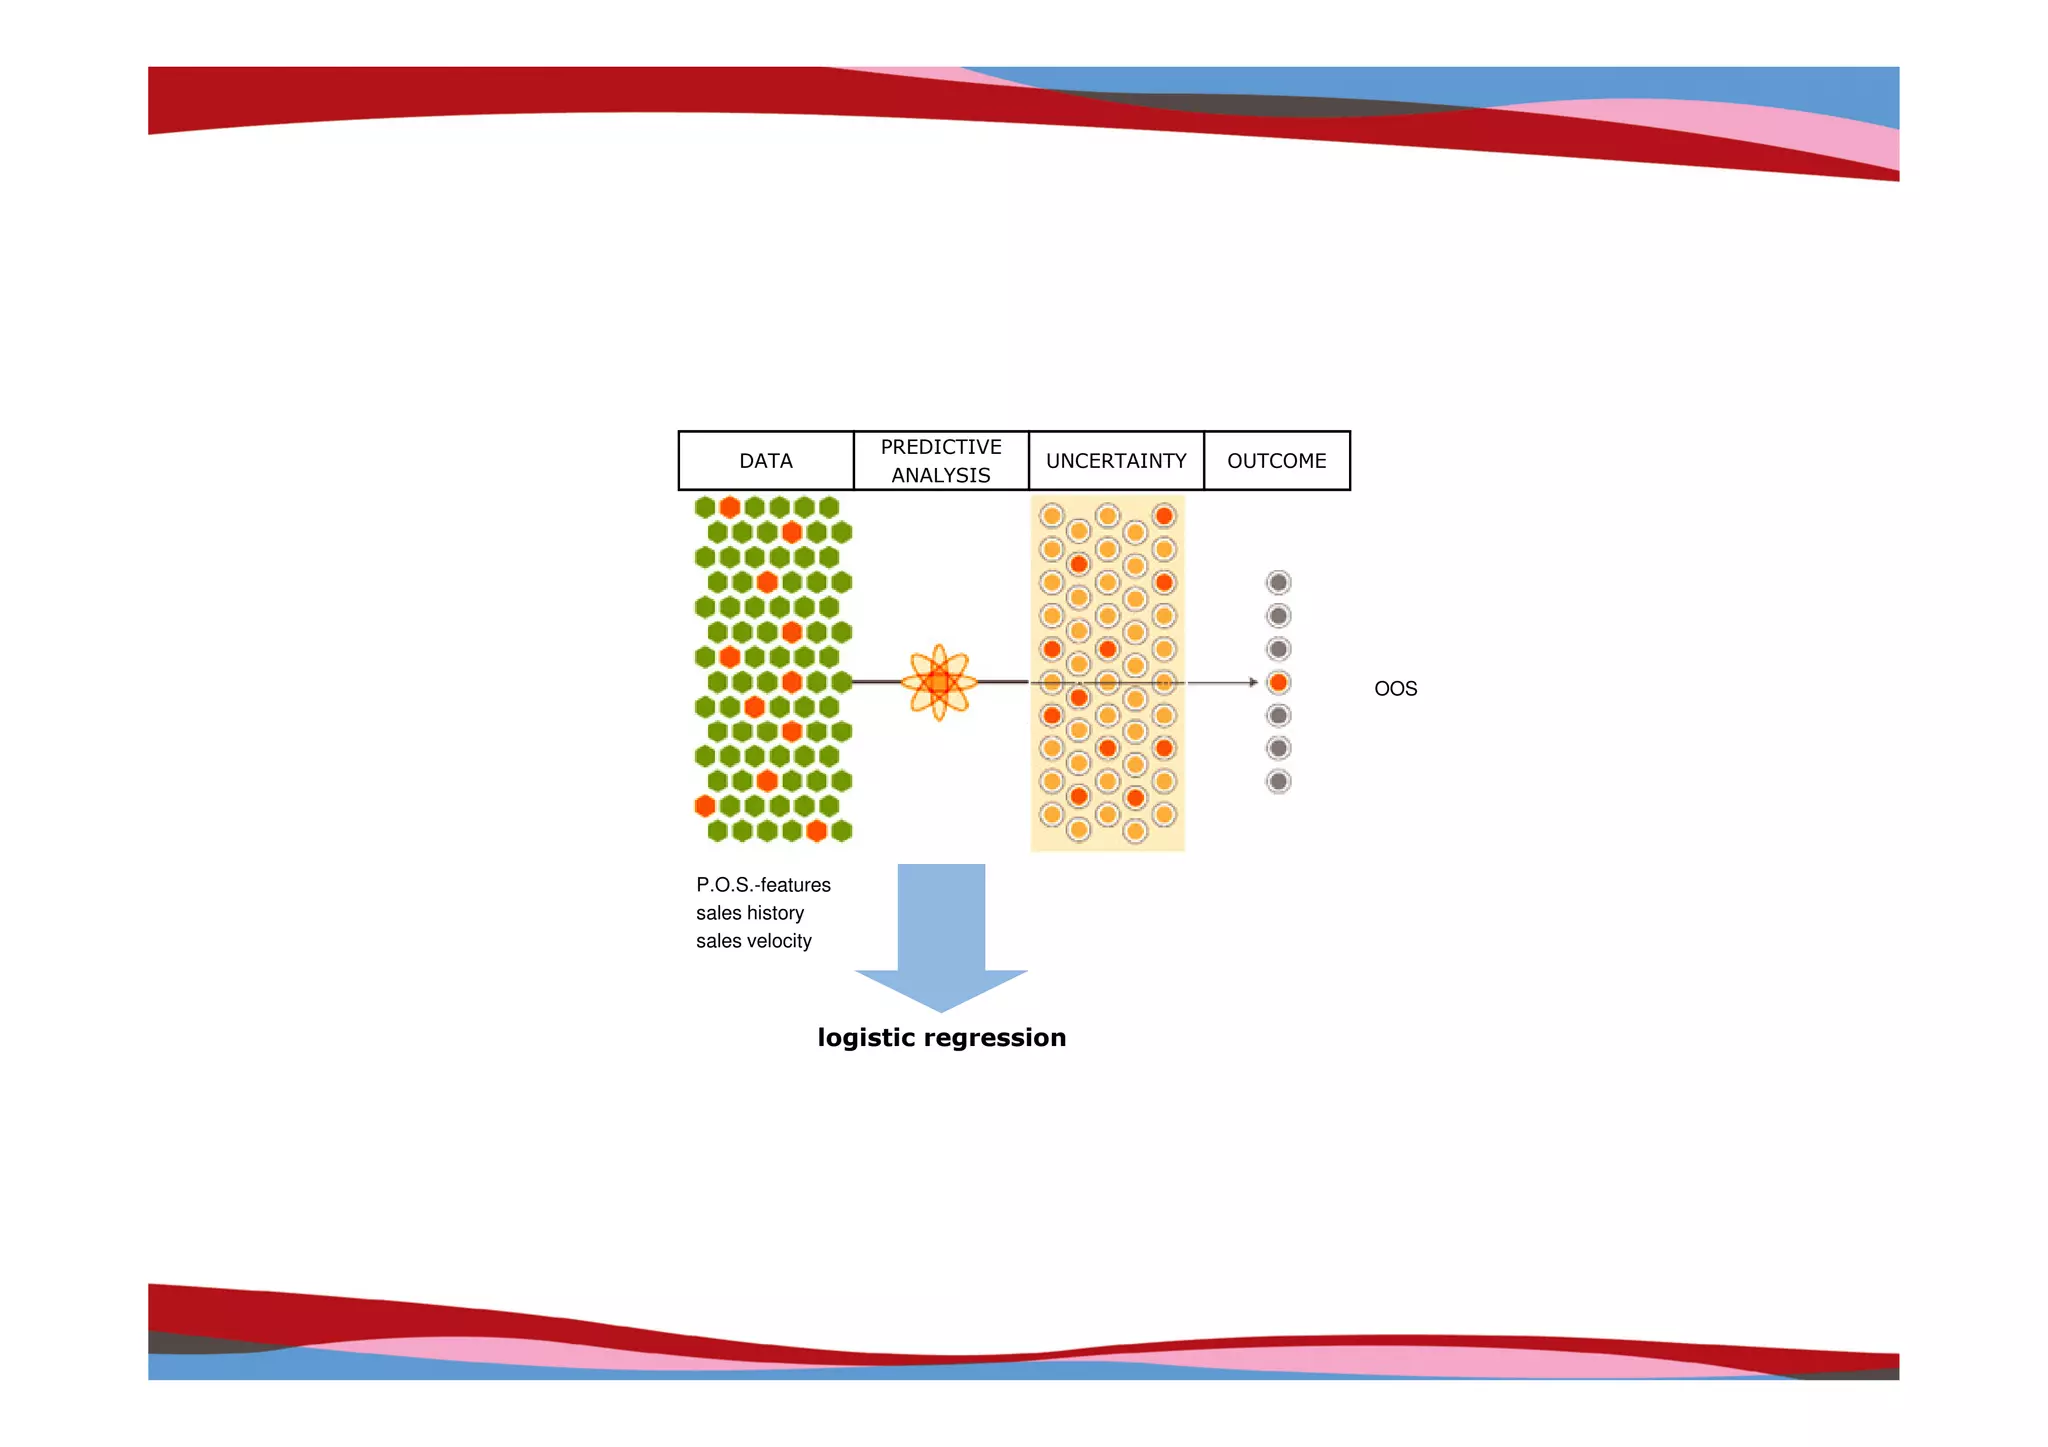
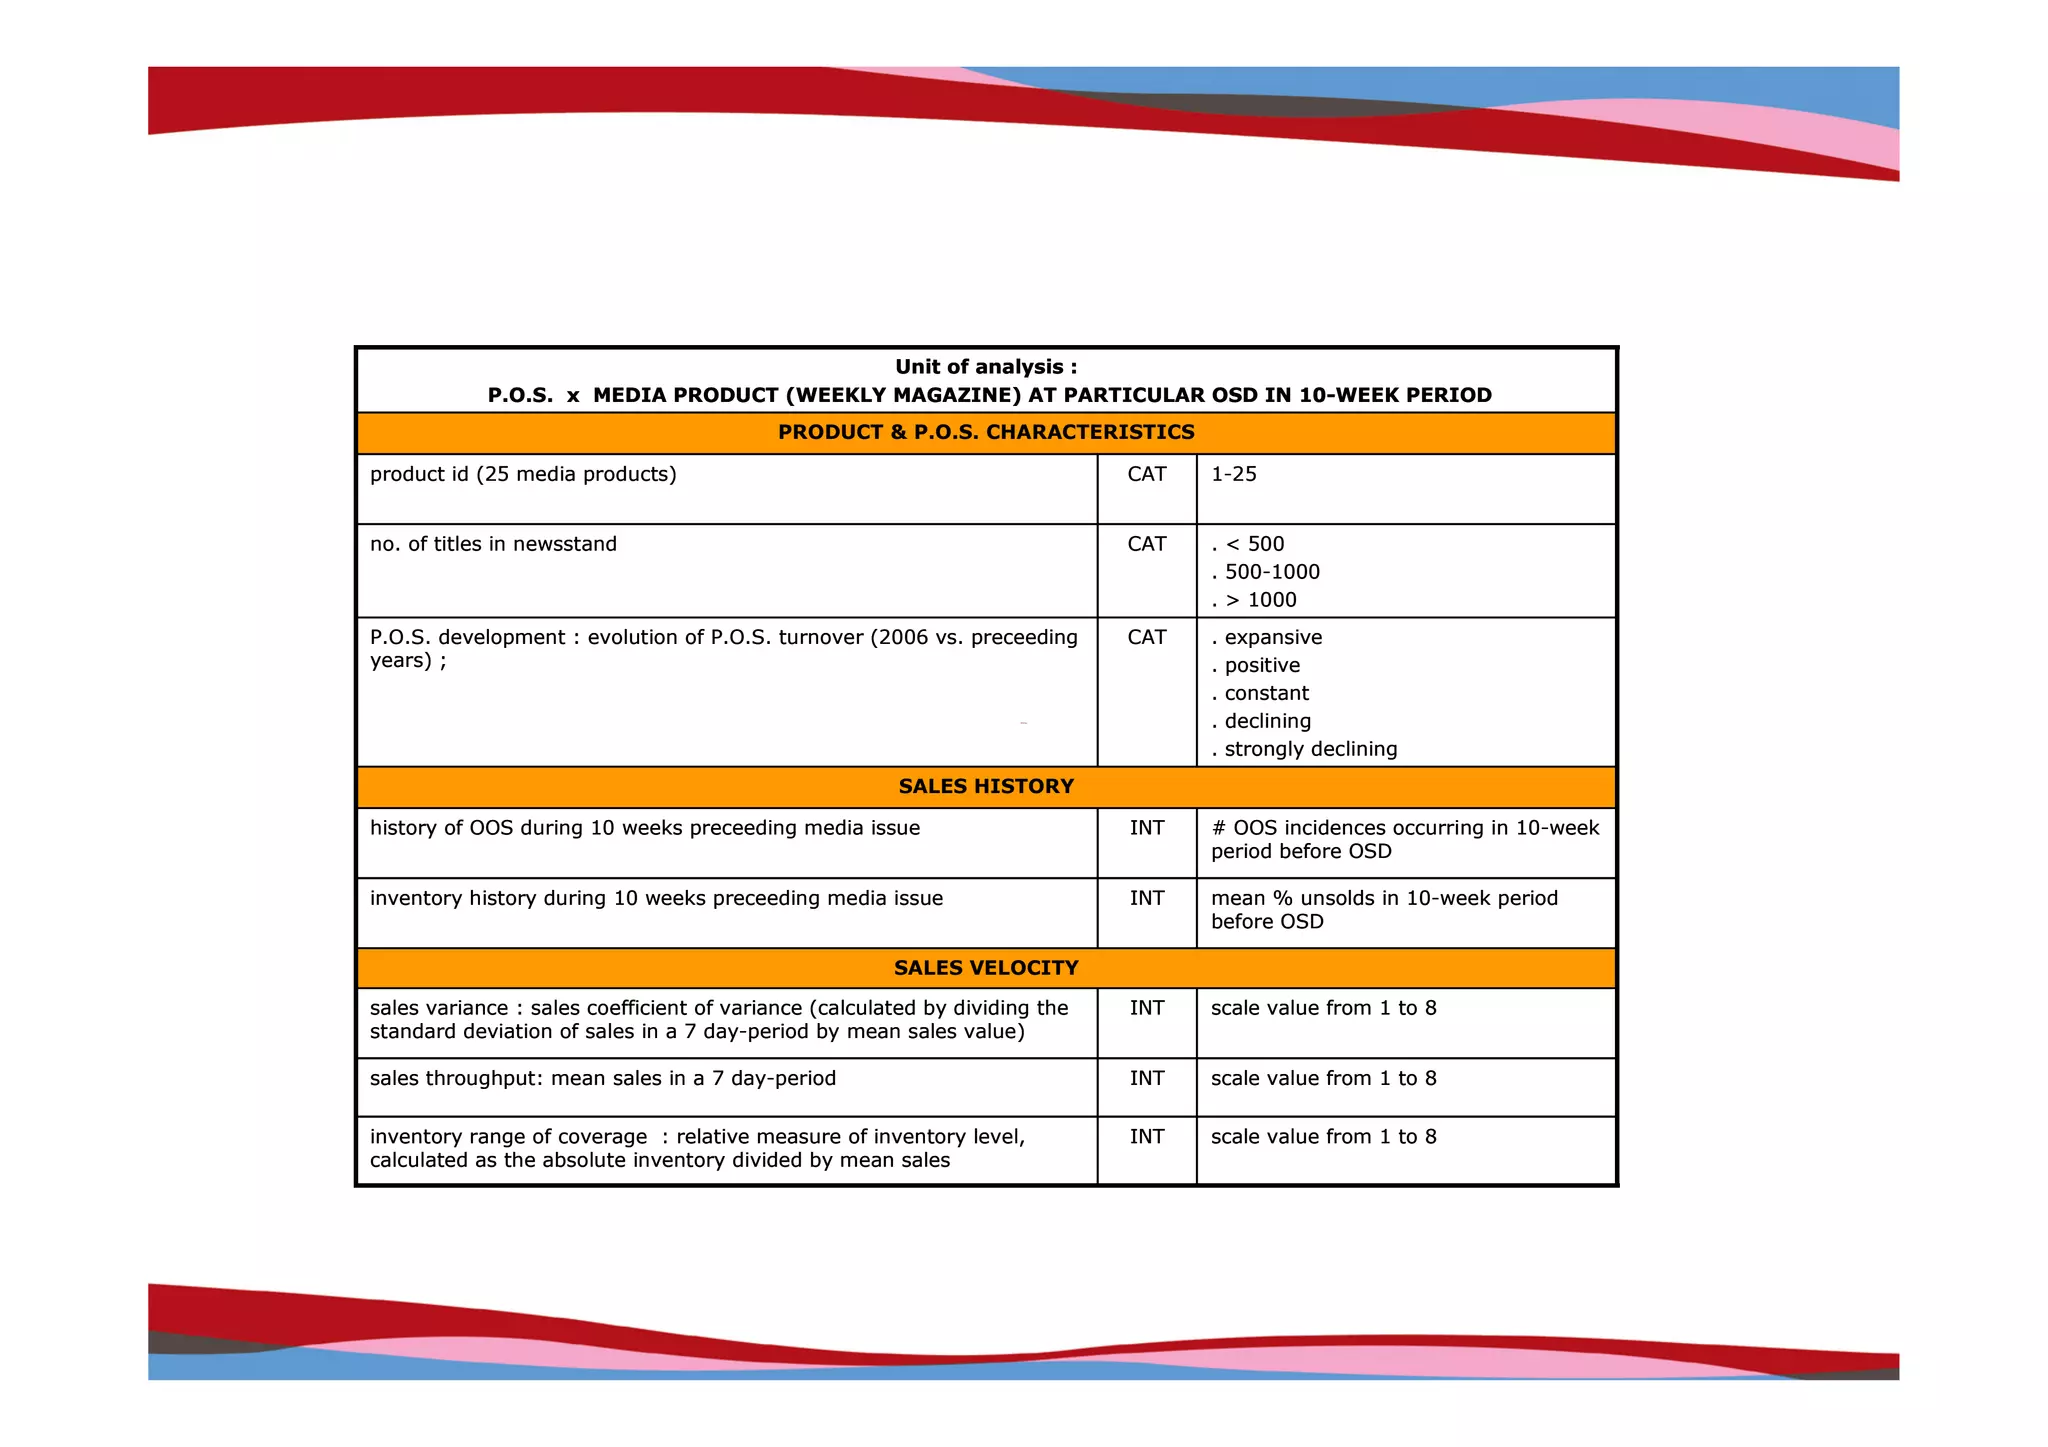
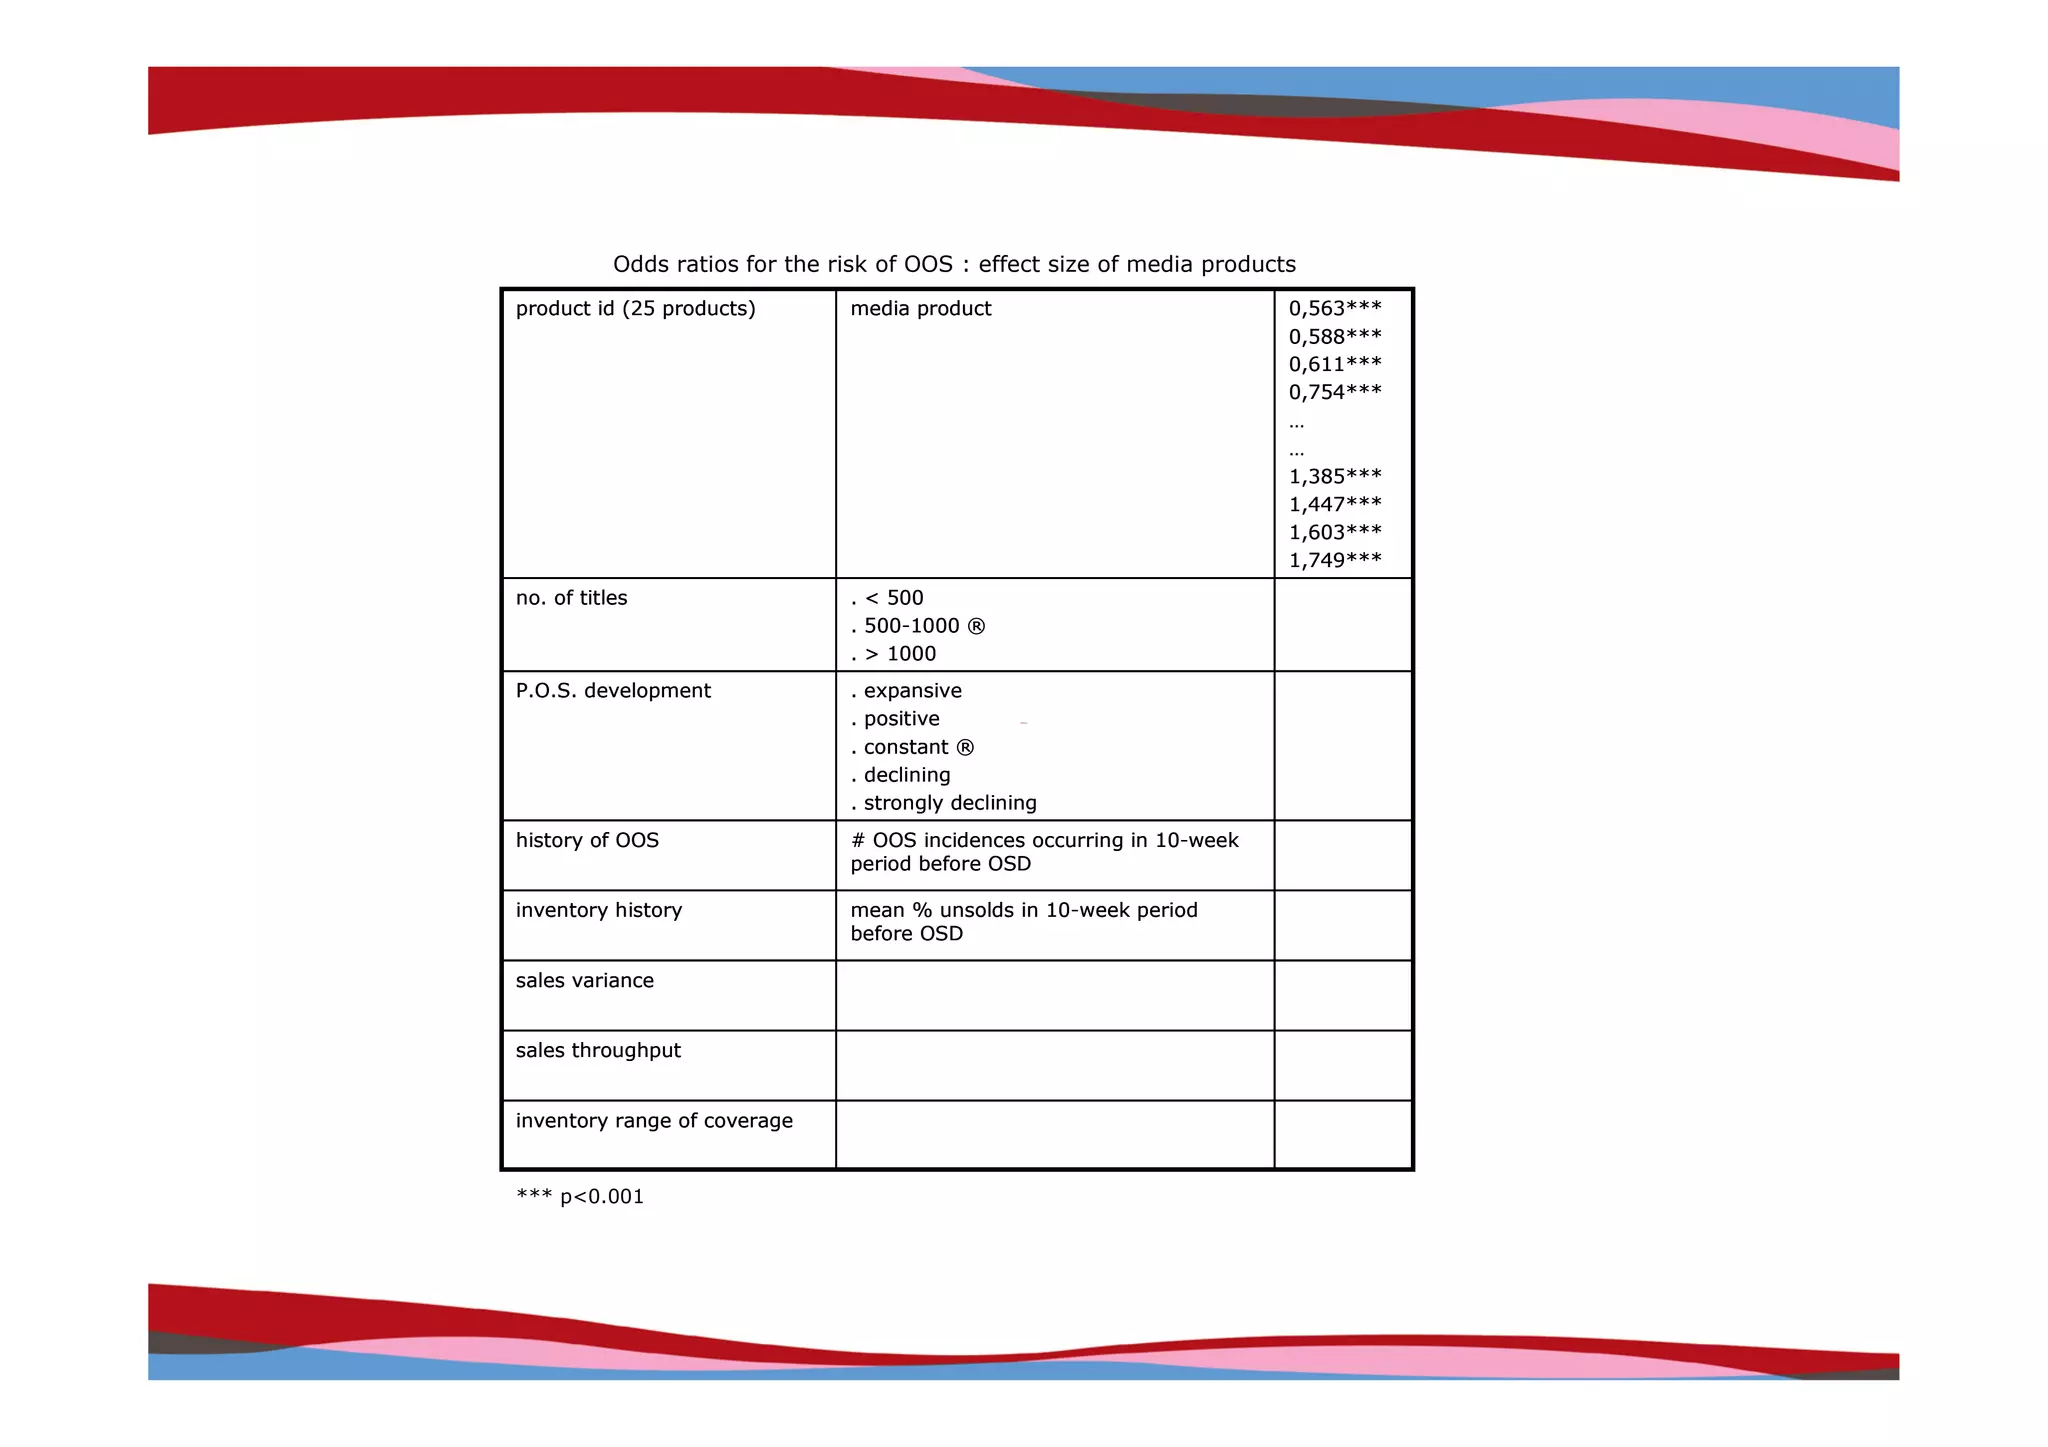
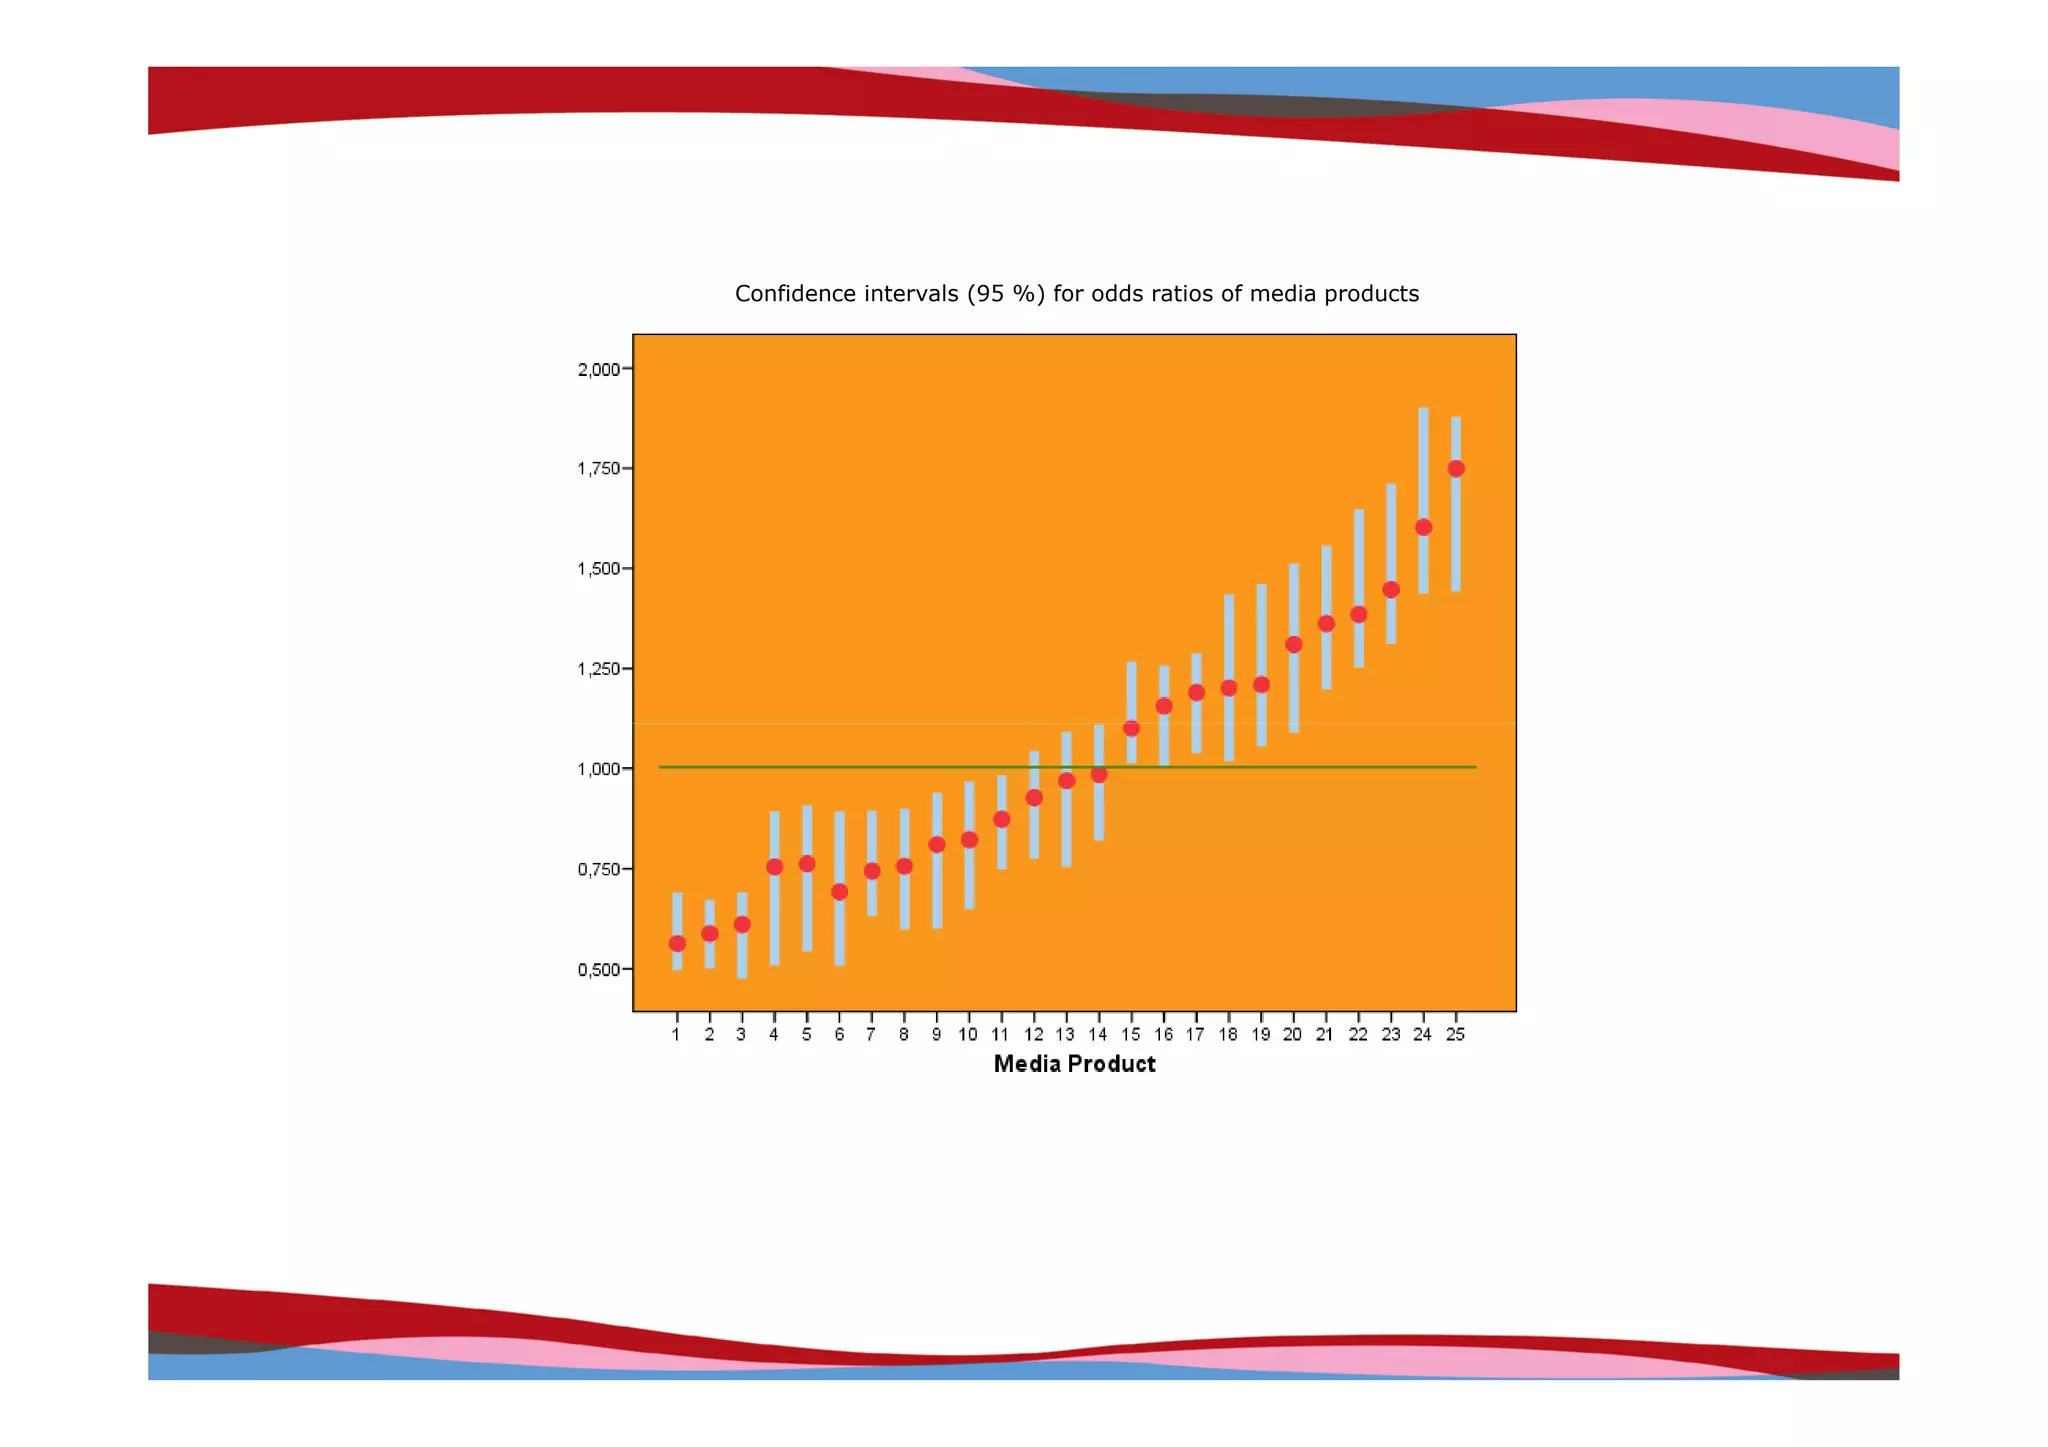
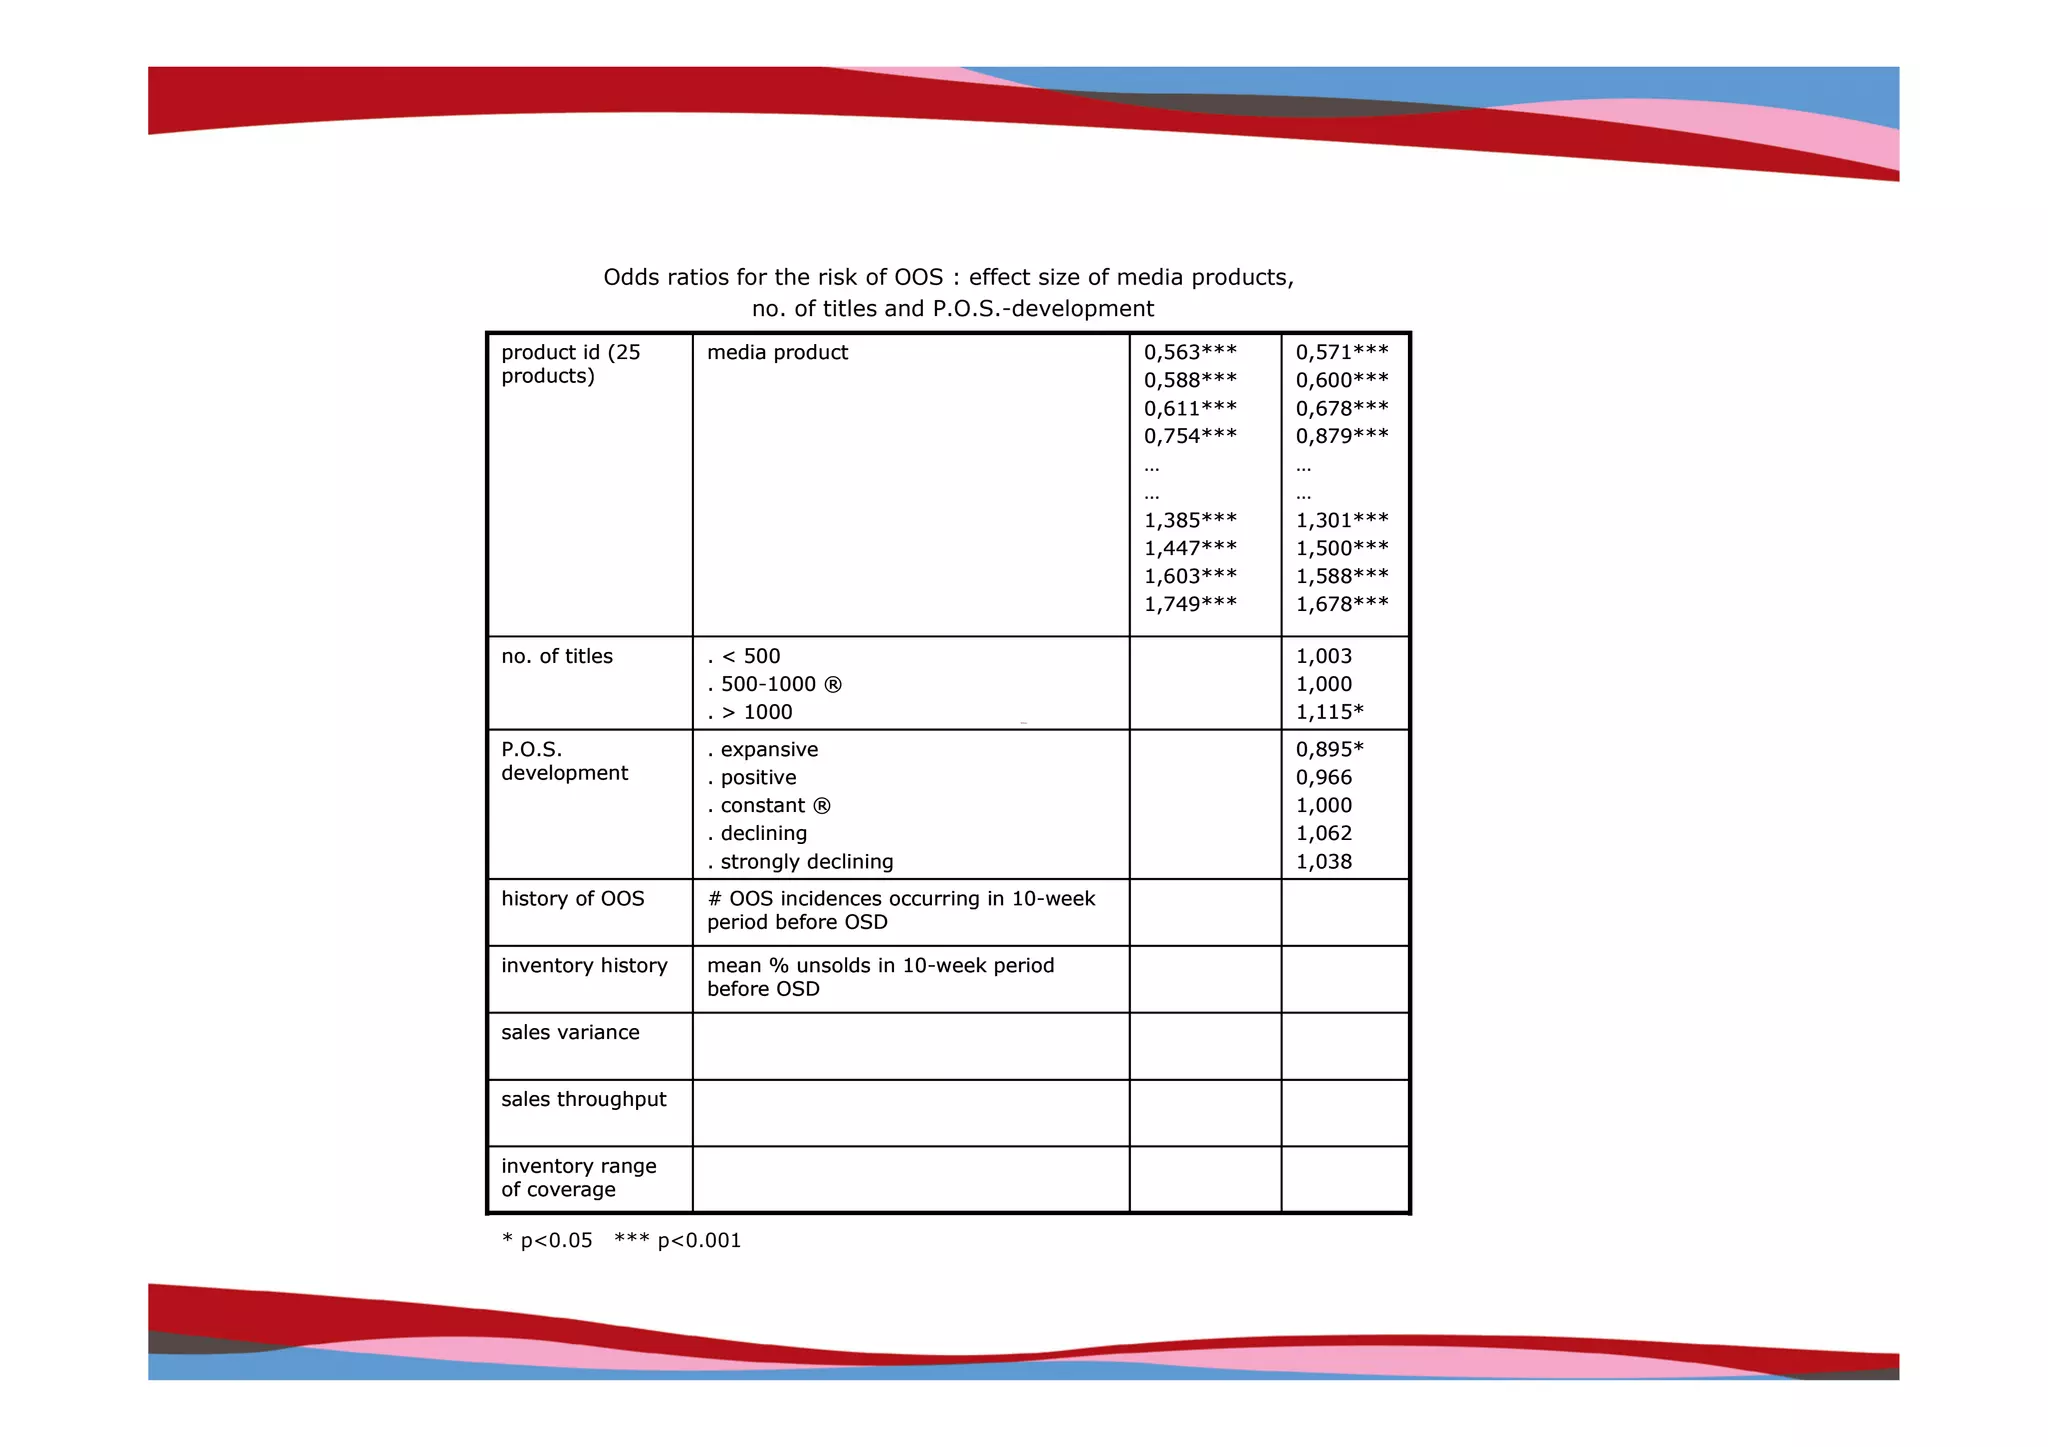
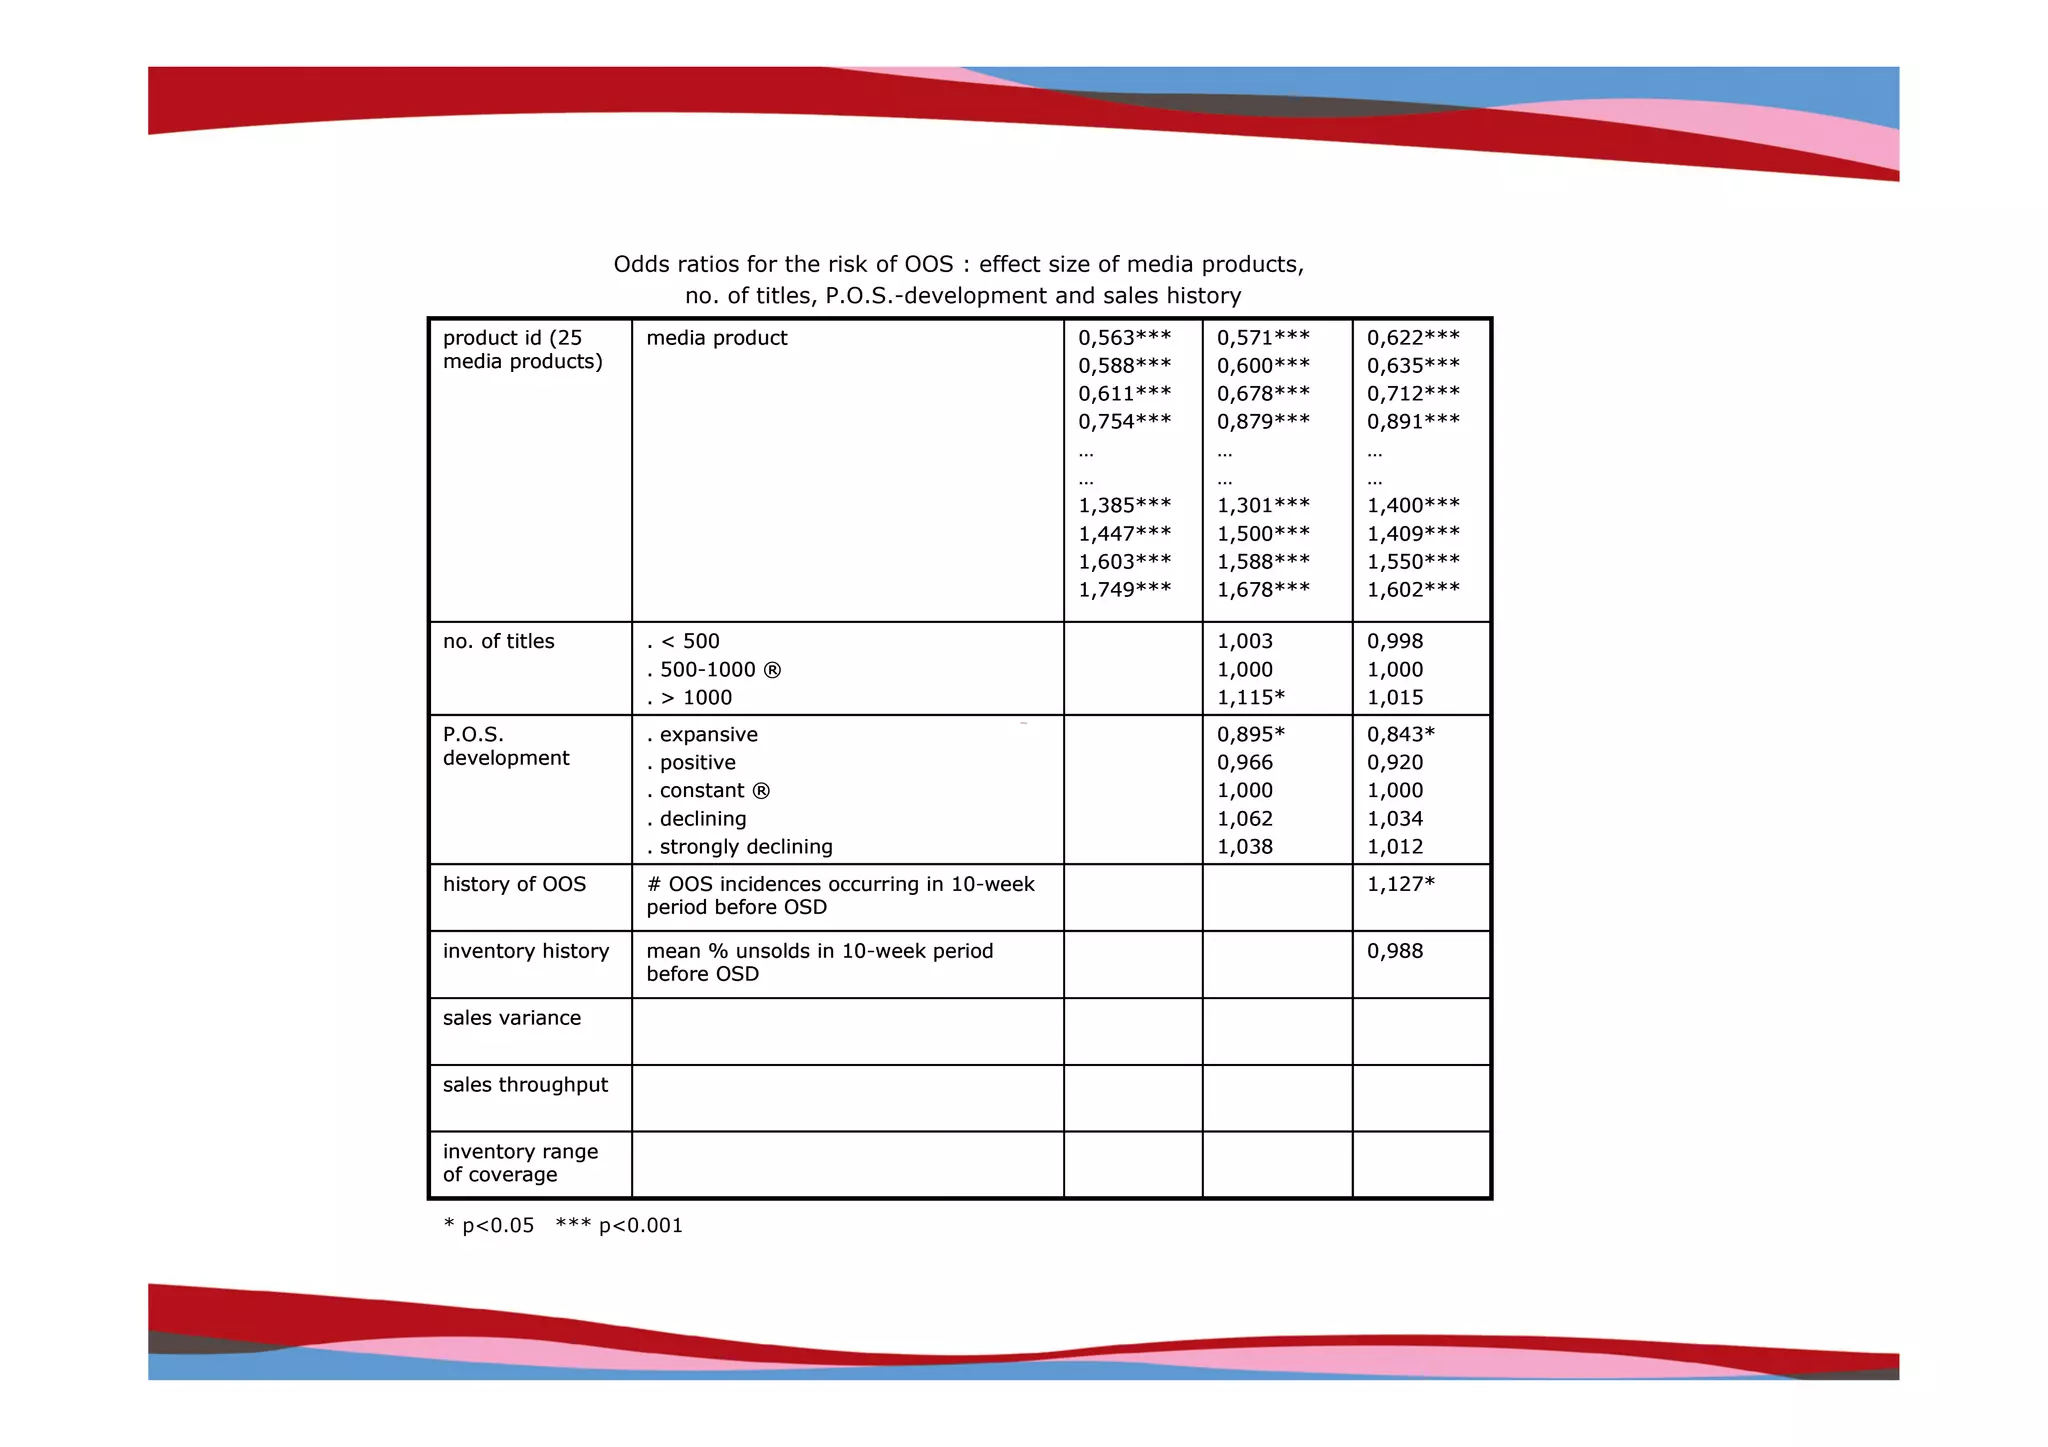
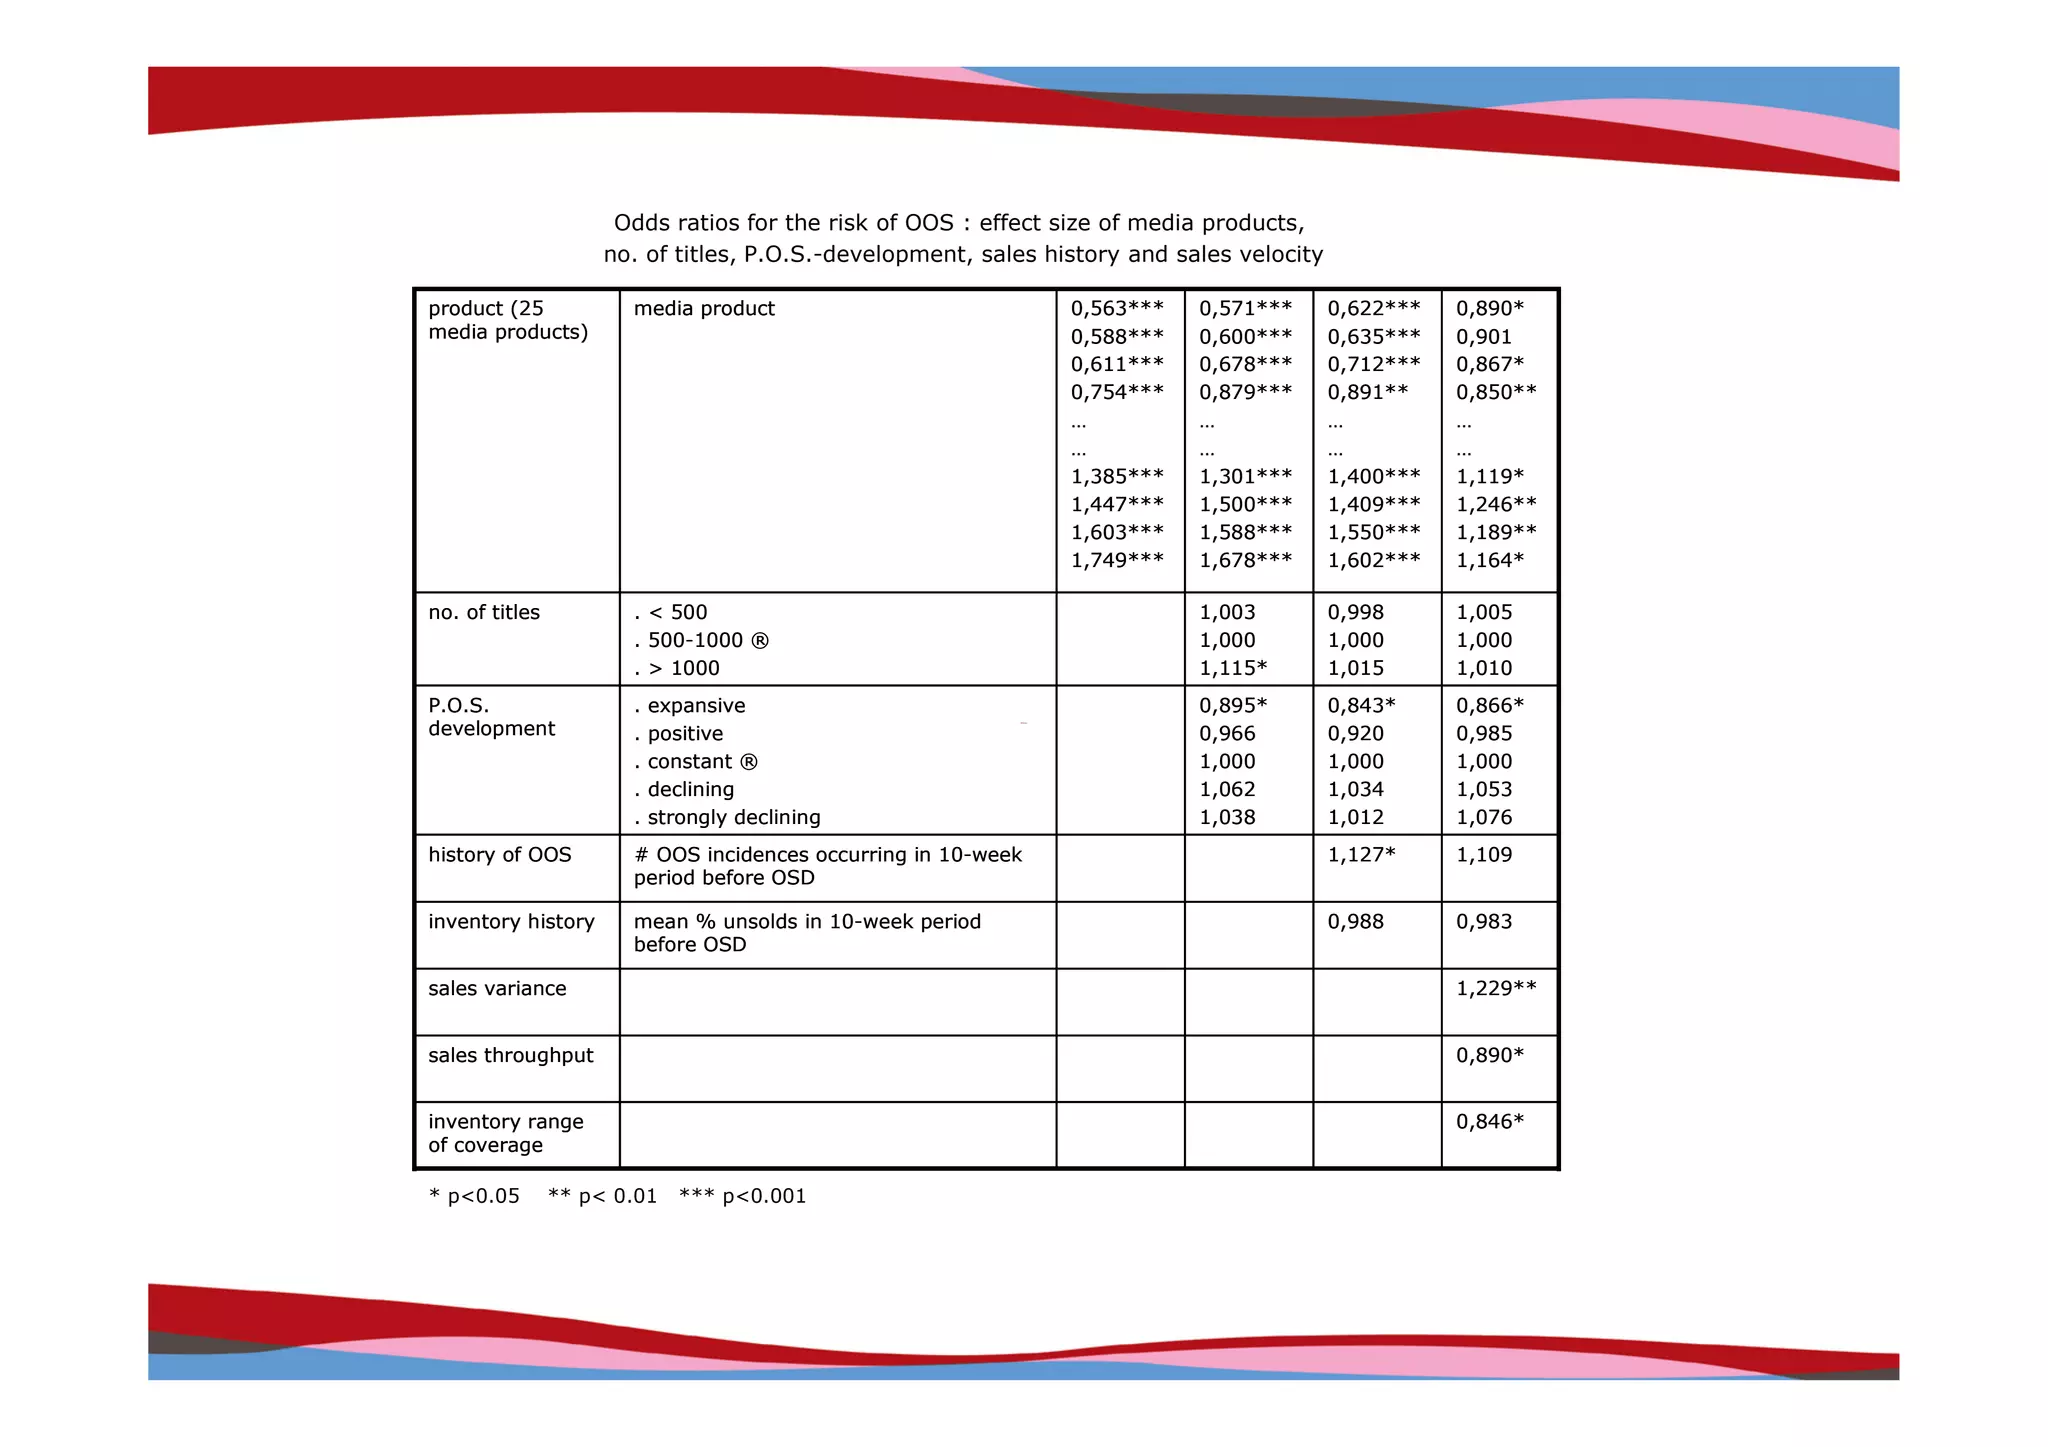
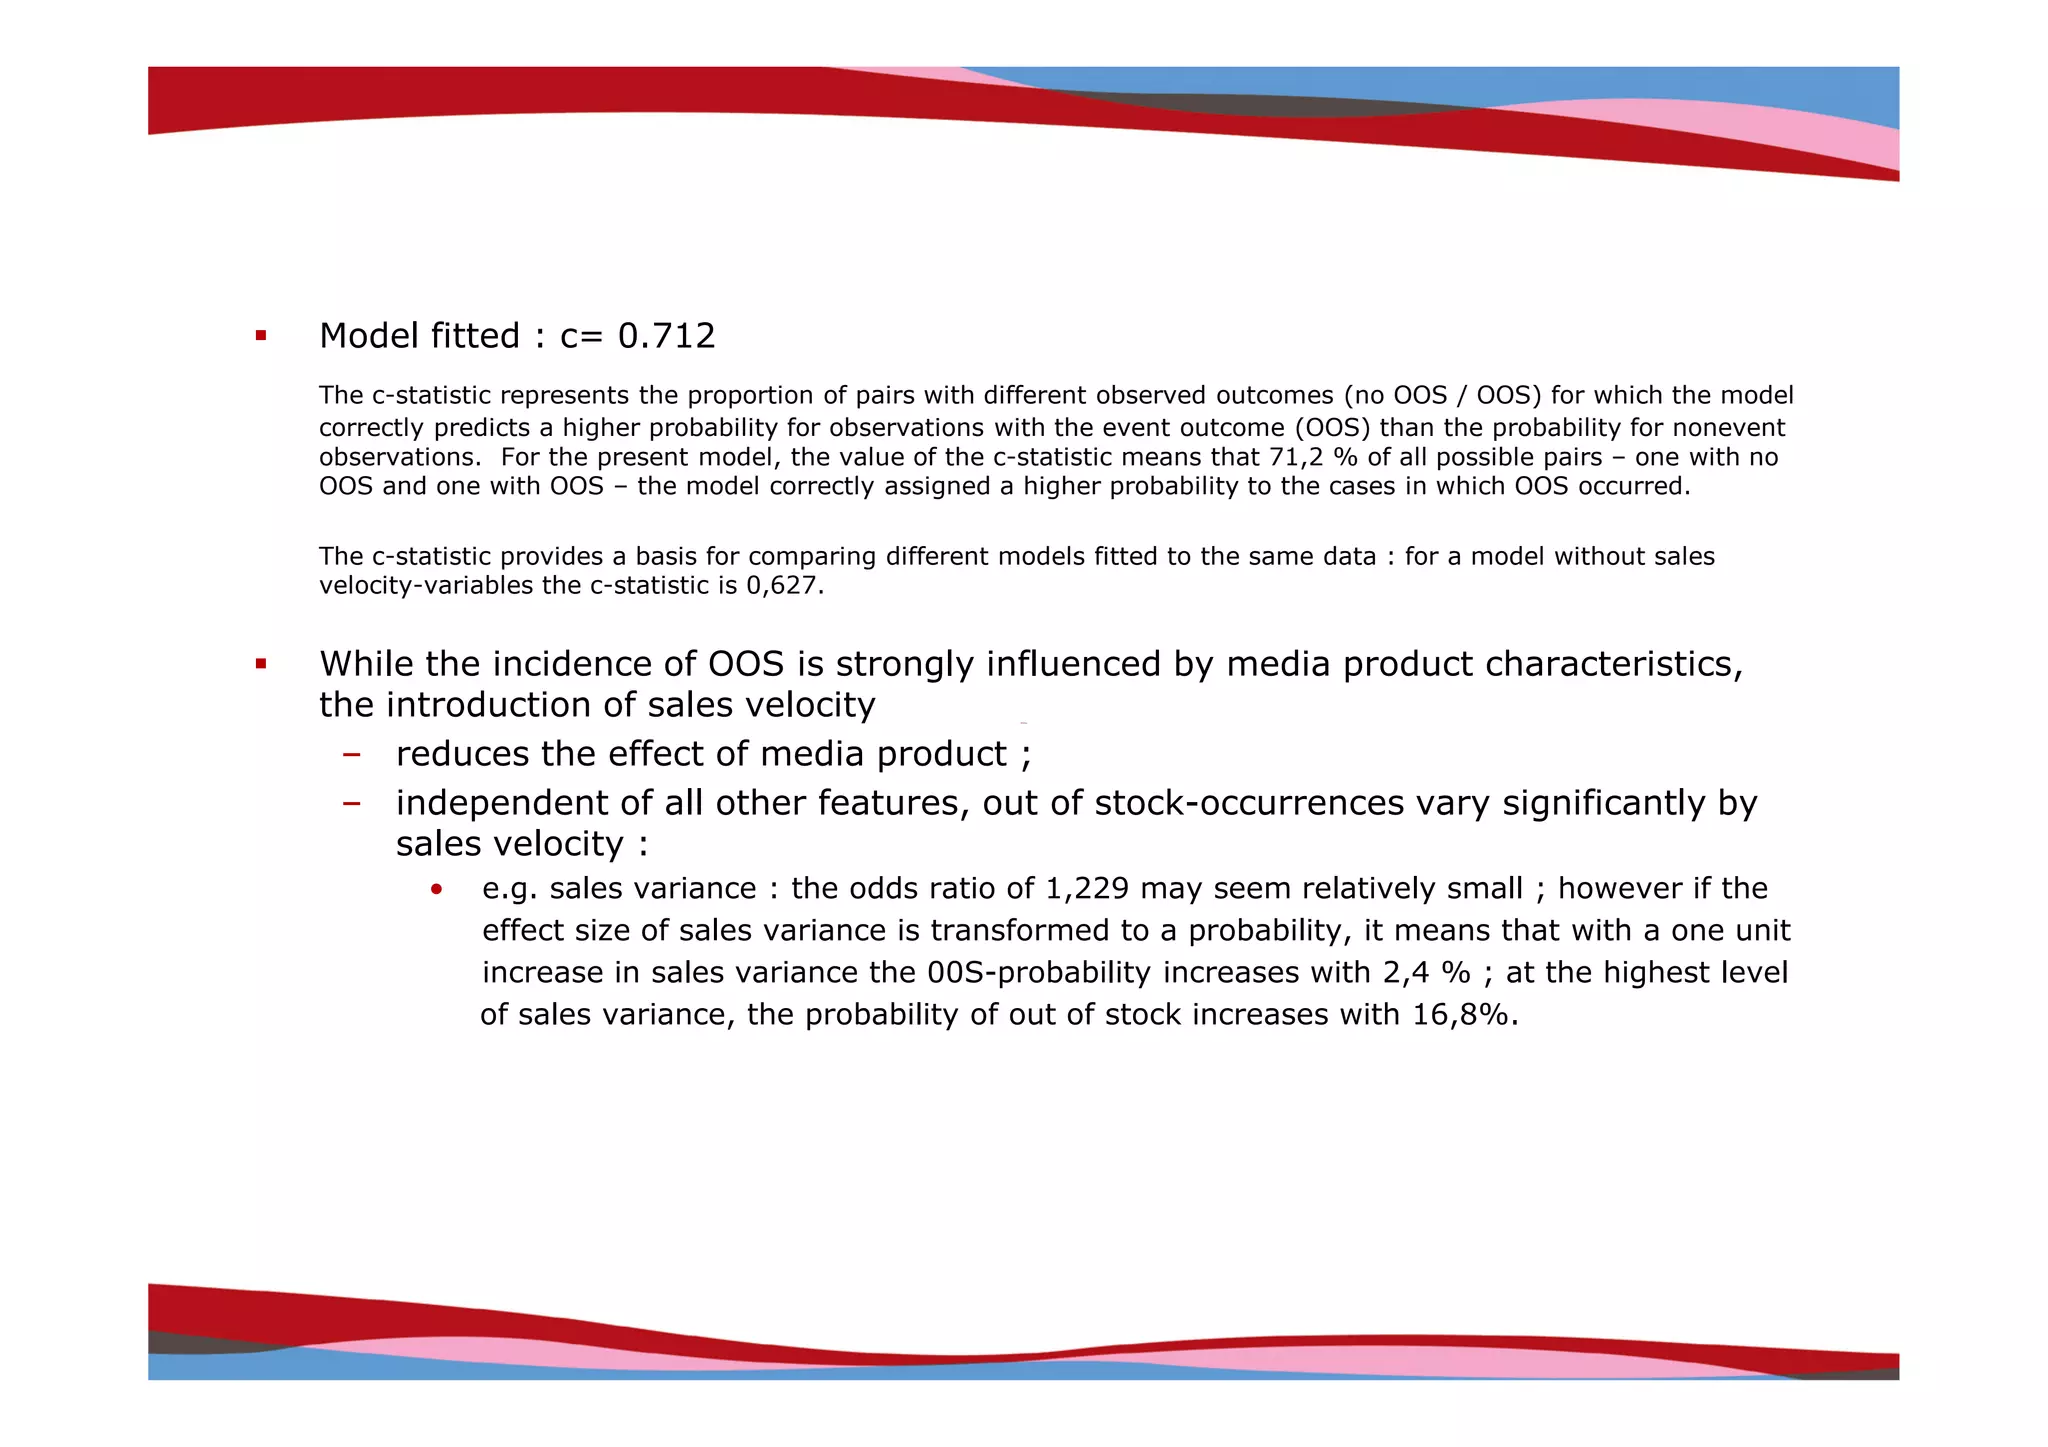
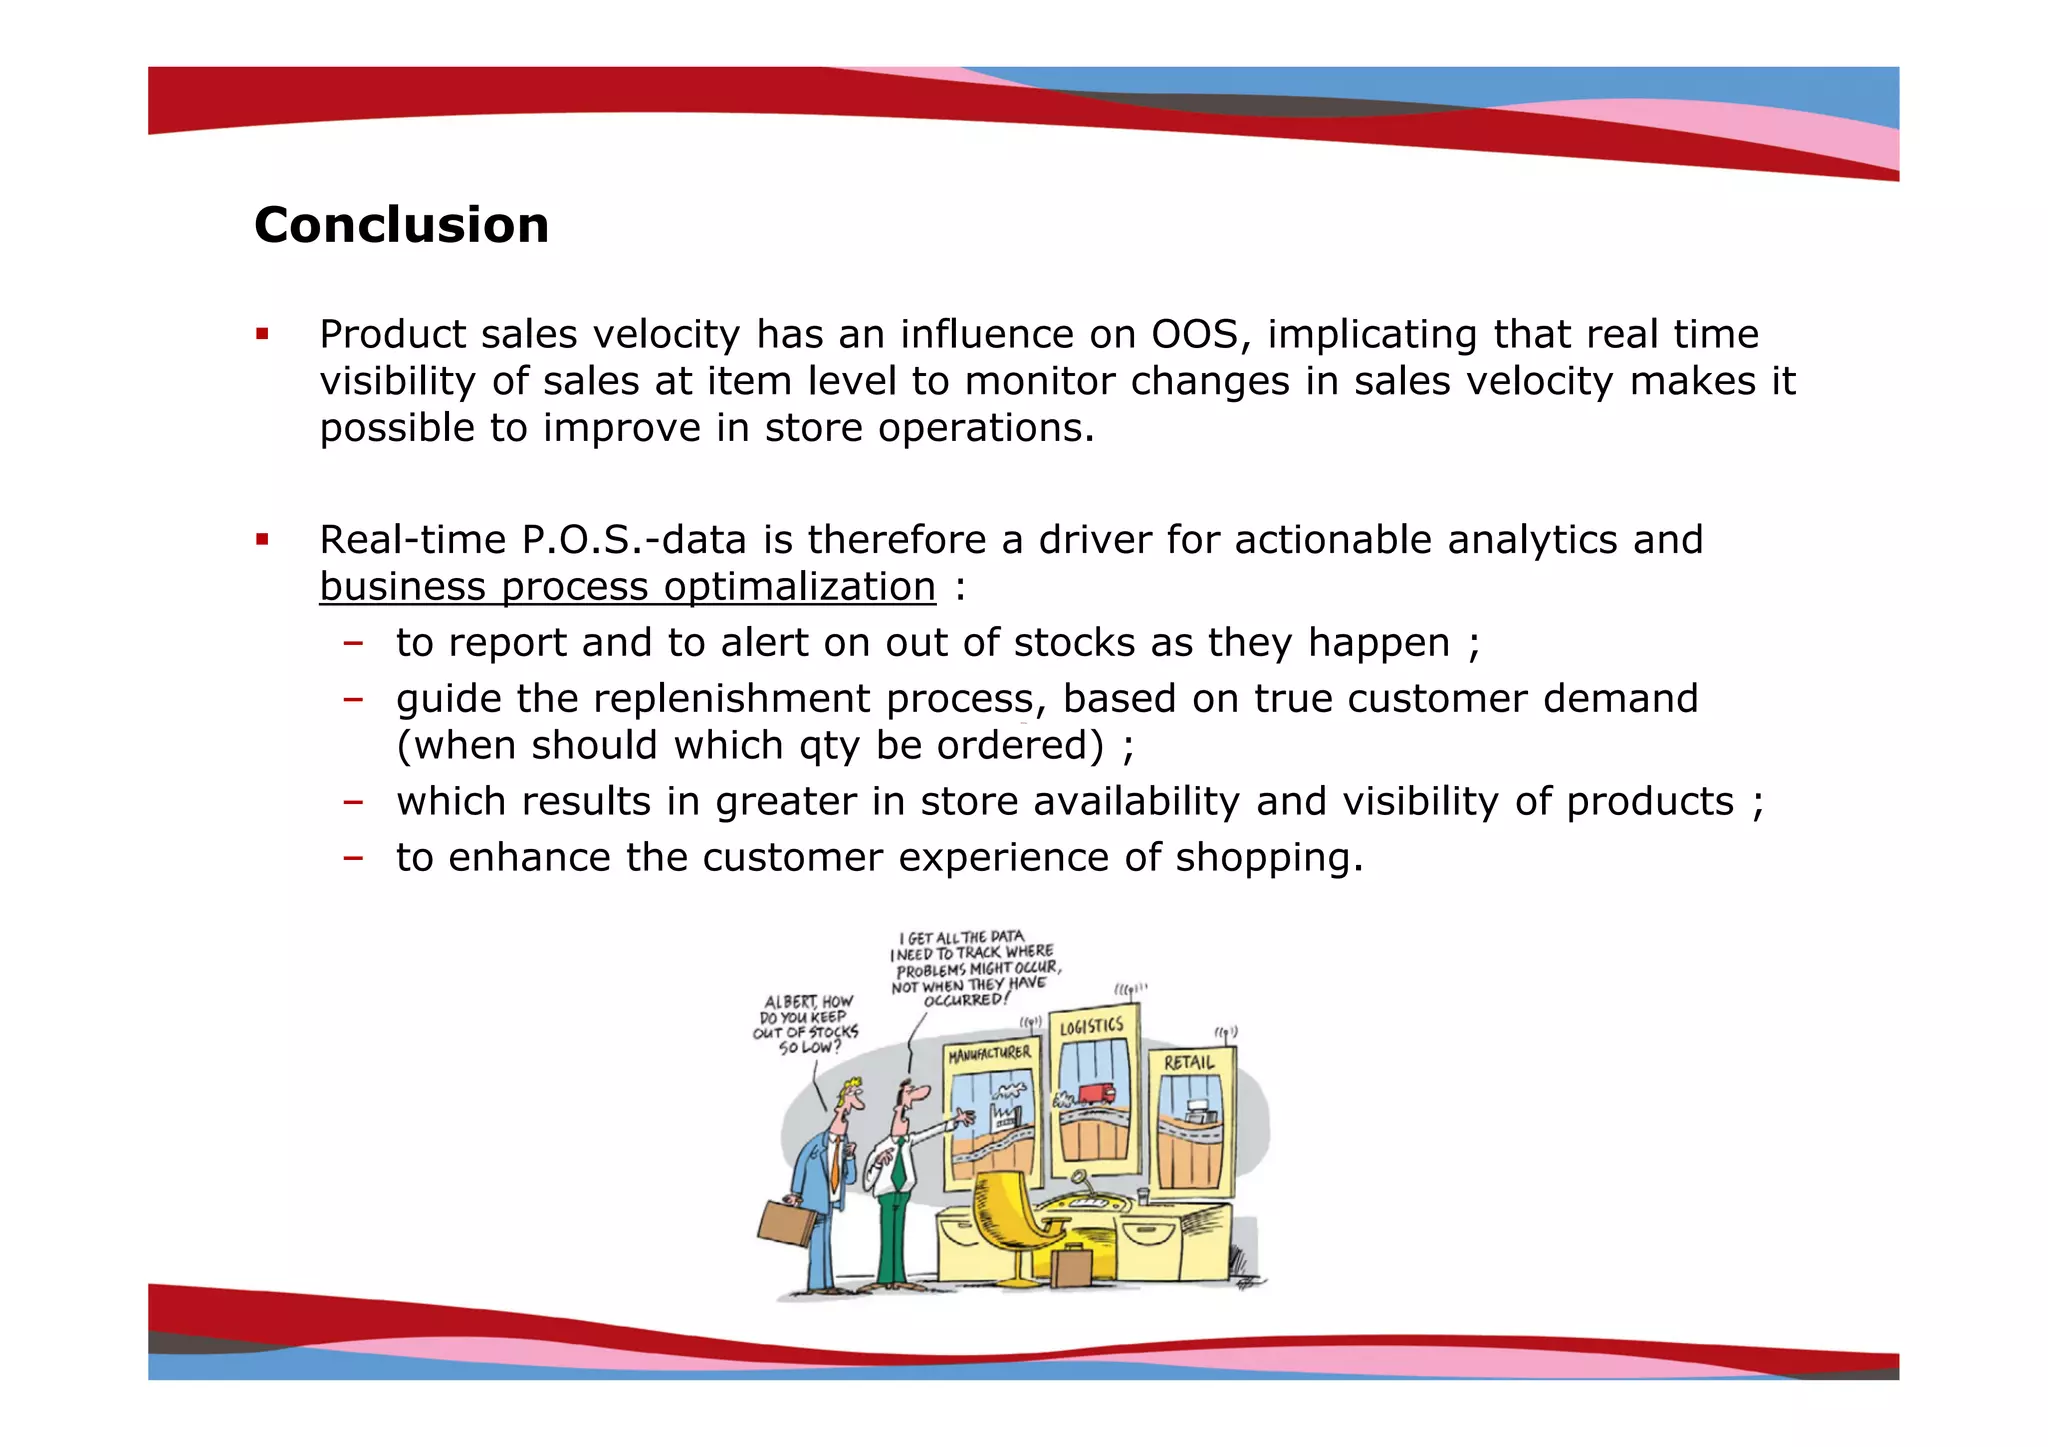
The document discusses using real-time point-of-sale data to predict out-of-stock situations in supply chains. It describes building logistic regression models to analyze relationships between out-of-stocks and variables like product characteristics, store characteristics, sales history, and sales velocity. The models found that sales velocity variables like throughput and variability improved the models' ability to predict out-of-stocks over models without those variables. Predictive analytics on real-time POS data can help minimize inventory levels and improve product availability.
Microsoft StreamInsight, part of the recent SQL Server 2008 R2 release, is a new platform for building rich applications that can process high volumes of event stream data with near-zero latency.
Mark Simms of Microsoft's SQLCAT will demonstrate the core skill sets and technologies needed to deliver StreamInsight enabled solutions, and discuss some of the core scenarios.
Mark will provide a detailed walkthrough of the three major components of StreamInsight: input and output adapters, the StreamInsight engine runtime, and the semantics of the continuous standing queries hosted in the StreamInsight engine.
This presentation includes hands-on demos, including building out a real-time data processing solution interacting with SQL Server and Sharepoint.
You will learn:
• The new capabilities StreamInsight brings to data processing and analytics, unlocking the ability to extract real time business intelligence from streaming data.
• How StreamInsight interacts with and compliments other components of SQL Server and the rest of the Microsoft technology stack.
• How to ramp up on the skills and technology necessary to build out end to end solutions leveraging streaming data sources.
The Sage MAS 500 Purchase Order module allows users to streamline purchasing processes, control spending, and ensure order accuracy. Key features include purchase requisitions, purchase order processing, receiving functionality, vendor performance tracking, and integration with other Sage MAS 500 modules like financials and asset management. The system aims to reduce errors, automate tasks, and provide insights into purchasing data.
To view on-demand webinar:
http://ecast.opensystemsmedia.com/317
The world of enterprise infrastructure software is undergoing dramatic change. Driven by the need to improve efficiencies and optimize their businesses, companies that operate large, physical systems (sometimes called operational systems) at the operational edge are actively working to merge those systems with their IT business applications. Because enterprise and operational systems are designed around very different architectures, integrating these worlds into a coherent system-of-systems is a sobering technical challenge. For example, a typical industrial automation system might generate 10's of millions of discrete data points; how does the operational infrastructure move a dynamically changing subset of interest to the IT system's enterprise service bus without overwhelming the ESB and associated system resources?
To meet the challenge, RTI has introduced RTI Connext, a next-generation software infrastructure that fully supports the business objective of integrating IT and OT (operational technology) systems. Based on the RTI DataBus™ which has been designed into hundreds of high-performance, distributed systems, RTI Connext combines the performance, scalability, and reliability needed by operational systems with the integration and flexible messaging capabilities of IT systems. Connext is the first edge-to-enterprise real-time SOA platform.
Unilog enables global as well as emerging enterprises with end-to-end master data quality solutions. We handle all kinds of data types and our gamut of data services ranges from data cleansing and audits to data enrichment and catalogue creation. Our unique blend of domain expertise, proven methodologies, proprietary DQM tools and sound experience form the backbone of our high quality services. We are focused on garnering critical insights that help our customers make the best decisions.
The document discusses HP's IT Performance Suite, which includes Executive Scorecard (XS) and Enterprise Collaboration (EC). It focuses on using metrics to measure and improve IT performance across planning, building, and operating phases. The suite provides solutions for areas like financial management, security, application lifecycle management, and more to help organizations understand, execute systematically, and continuously improve business outcomes and IT.
The document discusses getting value from data and outlines several key steps:
1. Conduct a realistic assessment of your current data maturity and focus of value. This includes determining how advanced your reporting, analytics, and data governance currently are.
2. Assign a business owner to construct a data strategy to add value, based on the current assessment.
3. Develop a value framework that becomes an agreed and sponsored plan for the business.
4. The focus should be on adding value, not leading with technology, and accounting for cultural and people issues.
Technology in support of utilities challengesAitor Ibañez
This document discusses the need for new technology to help utilities companies address challenges from rapidly growing data volumes and the need for extreme performance, massive integration capabilities, and business process automation. Specifically, it notes the need for engineered systems capable of handling large, unstructured data; seamless integration across boundaries; and event-driven architectures. It provides an example technology - the Oracle Exadata database machine - designed to eliminate performance trade-offs through a scalable grid architecture combining database and storage servers.
This document discusses faster and cheaper approaches to information governance. It suggests starting small with a tangible project that addresses an acute business problem. Use existing resources and focus on quick success metrics to prove value. Grow the initiative over time by publicizing results, establishing executive support, and developing a growth plan around key technologies like data quality, master data management and information lifecycle management. The goal is more effective yet lower cost information governance.
This document provides an overview of Edge Business Solutions' eProcBay® Online manufacturing operations automation and management service. The service enhances operations efficiency, reduces costs, and creates an information bank for manufacturing SMEs. It has features like easy-to-use web access, unlimited users, menu-driven operations, data repository, and lifetime support. The document also includes a case study of how the solution helped automate workflows and reduce manual interventions for a company that manufactures electric wires and cables. It delivered requirements like production stage tracking, inventory management, order tracking, and real-time MIS reports.
With its product CIMM2, Unilog helps companies drastically cut down their time to a mature eCommerce business model. CIMM2 has the ability to take hundreds of thousands of product online and manage the entire “Click to Cash” process. CIMM2 features a robust Product Information Manager; an easy to use Content Management System; a built for purpose eCommerce engine and full feature Mobile Application.
Unilog is at the forefront of Big Data Analytics. XRF2 is Unilog’s flagship SaaS product for “Big Data Analysis”. XRF2 provides accurate Business Reporting based on intelligence gathered from terabytes of Competitive Product Data, Competitive Pricing and Competitive Product Categorization. Companies that use XRF2 make the most educated decisions regarding Product Portfolio, Strategic Sourcing and Strategic Pricing. This application is used by some of the most admired companies in the Distribution and Retail industry.
Vectorwise is an extremely fast database that enables quick decision making through real-time analytics. It is multiple times faster than other databases, with some customer queries seeing speed increases of 70x. This speed is due to its innovative vector processing approach. Customers report being able to reduce BI project timelines by 50% using Vectorwise due to its ease of use and lack of need for tuning. It also reduces infrastructure costs through requiring less hardware and IT resources.
Building a business intelligence architecture fit for the 21st century by Jon...Mark Tapley
Objectives of the presentation:
To record some history –what has happened in the past that makes the future quite challenging.
To provide real examples of BI at work –good and bad.
To illustrate the nature of data and why it has become so important in driving forward
the business in the 21stcentury.
To outline a way to align technology with the business so that efforts and budget are spent
in a way that will enable the future rather that support the past.
To propose a set of principles and ideas that can guide a company in a way to make data available to all who have the penchant to turn it into useful and valuable information.
To describe the new organisation unit that will be needed to realise the dream.
The document discusses how information arrives to companies from various sources like paper documents, emails, social media, etc. and needs to be captured and routed to different business units and systems. It introduces Kofax's approach of capturing information at the point of origin to improve processing times, drive automation and costs savings, and enhance governance. The storyboard then shows how Kofax's capture technologies can understand and classify incoming content before routing it to destinations like ERP, CRM or document management systems to initiate automated workflows.
The document discusses Emerson's strategies for managing through an economic downturn, including maintaining price discipline, increasing research capabilities, aligning with emerging trends like environmental efficiency, building solutions presence across all businesses, and improving portfolio mix through business platforms and geography. It states that combining these capabilities with an expected post-2010 global economic rebound will create a strong foundation for growth and value creation.
This corporate presentation from KnowledgeStream outlines their services across various areas including CRM, data management, campaign management, telemarketing, demand generation, creative services, toll free number management, market analytics, and market research. The presentation provides an overview of the types of services KnowledgeStream offers to clients.
The document discusses the need for a single data and events platform to handle high volumes of data and events. It describes GemStone Systems, which provides a distributed main-memory data management platform using a data fabric/grid. The platform allows applications to process and distribute large amounts of data and events at high speeds and scales linearly. It provides an example of using the platform for electronic trade order management to normalize, validate, aggregate and distribute trading data and events in real-time across clustered applications.
IBM Cognos - Vad handlar egentligen prediktiv analys om?IBM Sverige
This document provides a 3-paragraph summary of an IBM performance event about predictive analytics:
Paragraph 1 introduces predictive analytics and how it can help decision makers predict things like infection in newborns, credit line adjustments, customer purchases, and social relationships to prevent customer churn.
Paragraph 2 describes how predictive analytics can optimize transactions, processes, and decisions in real-time using data and predictive models, and how it helps everyone make better decisions rather than just analytical experts.
Paragraph 3 gives examples of how a telecommunications company uses predictive analytics to proactively target at-risk customers and determine the best retention offers to reduce churn.
Developer and Fusion Middleware 1 _ Paul Ricketts _ Paper Process Automation ...InSync2011
The document discusses paper process automation using Oracle WebCenter Imaging. It describes business challenges with managing physical paper documents, such as costs and time taken to process information. It then introduces Oracle WebCenter Imaging as a solution for document capture, storage, retrieval and workflow. Examples are provided of customers using Oracle WebCenter Imaging for invoice processing and other document-intensive processes.
The first document lists the main business drivers for ERP systems, including supply chain management, customer care, and global opportunities. The second document outlines the top 10 criteria for purchasing an ERP system, such as integration, total cost of ownership, and support quality. The third document discusses how Oracle provides a complete enterprise solution with strategic management, business intelligence, and core business process applications integrated on a technology infrastructure.
Big data is not just for big companies. Any company can leverage big data to gain business insights and transform their operations. Big data provides opportunities to gain insights from diverse data sources, answer questions in real-time, and unlock new business value and strategies. While big data solutions require identifying pain points, inventorying data streams, and testing pilots, any company can start to capitalize on big data through a trusted partner to help address critical issues around data volume, velocity, and variety.
The 360Facility system provides web and wireless software for managing property, people, and assets. It offers solutions for work management, preventative maintenance, reservations, visitor registration, projects, purchasing, emergency management, and more. The system manages over 750 million square feet of property space across 51,000+ properties in 24+ countries. It aims to reduce response times, lower costs, and improve customer satisfaction for facilities management.
Rubik Solutions provides an Open Integration Portal to help integrate IT systems and business processes. The portal addresses challenges of integrating legacy systems, protecting existing investments, and managing growing integration points. It offers out-of-the-box integration with various tools, centralized data consolidation and reporting, and enables scenarios like multi-system service desk integration and enterprise-wide infrastructure management. The portal provides a secure and flexible single engine for real-time data integration across the enterprise.
The document discusses data-driven marketing and analytics. It provides an overview of how companies can move from simply collecting data to generating insights and taking action. It also discusses key metrics for measuring online success like conversion funnels and discusses how the consumer decision journey has become more circular with online research playing a bigger role.
There are many potential sources of customer activity data that can be captured and analyzed to understand customer behavior better in real-time, including: operational systems, web/clickstream data, social media, conversations and sensors. This captured customer activity data is then analyzed using streaming analytics and fed into a master customer record to trigger real-time personalized decisions and actions across multiple customer touchpoints.
IBM Business Analytics and Optimization - Introduktion till Prediktiv AnalysIBM Sverige
This document introduces predictive analytics and how it can improve decision making. It discusses how predictive analytics uses historical data patterns to make accurate predictions about current conditions and future events. This allows decisions to be made based on evidence rather than intuition. Examples are given of how predictive analytics has been used to reduce costs, increase sales and reduce customer churn. The document also outlines how IBM SPSS predictive software links different data sources into intelligence that can be used to target marketing campaigns, optimize product mix decisions and conduct proactive customer retention efforts.
The document provides an introduction to search marketing. It discusses how search marketing offers marketers the best opportunity to engage with intent-driven prospects who have identified their interest in a specific category, brand, or product. It then covers typical paid and organic search results. The rest of the document outlines typical search marketing steps including increasing inclusion, page ranking and consideration, and traffic. It also discusses keyword management, effective keyword planning, keyword research tools, and keyword phrase segmentation. Finally, it touches on developing content to satisfy searcher needs, search engine optimization, how search engines work, common SEO problems, and on-site and off-site optimization best practices.
The document discusses strategies for optimizing global search marketing efforts. It recommends leveraging linguistic infrastructure and search best practices across organizations. Key challenges include content owners competing for keywords in different languages and complex infrastructures blocking search engines. The document provides examples of optimizing global templates and infrastructure to improve indexability and distribution of link equity worldwide.
The document discusses ways for companies to optimize their online presence and profitability through simple changes to search engine optimization, paid search ads, website testing, and content development. It suggests regularly checking a company's search results, paid ad campaigns, website translations, and mobile compatibility. It also promotes integrating paid and organic search data to find opportunities, using scorecards to track metrics, testing websites as customers would, and focusing on searcher interests through helpful content. The document is presented by Bill Hunt and provides his contact information for further discussion.
The new normal in business intelligenceJohan Blomme
The new normal in business intelligence is about the transformational changes that take place in the digital world and definitely change the nature of BI. Business models in the global marketplace are reshaped through the application of information technology. The Internet is the societal operating system of the 21st century and its underlying infrastructure - the clud computing model - represents a disruptive change. A networked infrastructure, big data from disparate sources and social media among other trends as the self-service model and collaboration are changing the way BI systems are deployed and used.
Presentation from SES Chicago related to attribution of search marketing activities. Ideas on how to start to organize the data integration necessary to apply attribution credit.
Transformational changes that take place in the digital world definitely change the nature of business intelligence and represent an new normal. The Internet is the societal operating system of the 21st century and its underlying infrastructure - the cloud computing model - represents a "disruptive" change. A networked infrastructure, big data from disparate sources and social media among other trends as predictive analytics, the self-service model and collaboration are changing the way BI-systems are deployed and used.
This document provides guidance on launching a global website, including considerations around market readiness, localization of content and products, customer service, shipping and delivery, marketing, and ongoing maintenance. Key points covered include assessing local demand and regulations, adapting products for local markets, handling payments and customer support internationally, and addressing linguistic and cultural differences across markets to ensure the website is appropriately localized.
This document discusses the new features and capabilities of QlikView 11, a business intelligence and data visualization platform. It highlights five main themes: 1) Social Business Discovery which enables collaboration and sharing of insights, 2) Mobile Business Discovery with optimized experiences for tablets and smartphones, 3) Comparative Analysis for comparing different data groupings, 4) Rapid Analytic App Platform with improved development and extensibility, and 5) Enterprise Platform with performance, administration, and security improvements. The document provides examples of how organizations are using QlikView to empower business users to access, analyze, and make decisions from data on their own.
Business intelligence systems are also unable to deal with market volatiles. Infosys' business analytics offerings provide the processes, tools and expertise to extract the most from information investments description.
This document discusses analytical deployment in marketing. It begins by noting that while excuses for not deploying analytics are valid, they are not sufficient. It then outlines an agenda to discuss getting to the breadth and depth of analytics usage, getting to impact, and getting to change. Several slides provide details on understanding depth and impact, the benefits of analytics in increasing competitiveness and profitability, and a framework for understanding the different levels and ingredients required for effective analytics deployment across an organization. The document argues that analytical deployment can enhance performance across marketing domains and provides examples of impact. It acknowledges common responses against analytics usage but argues a minimum of four competences are needed to move from data to impact. Finally, it introduces THOM as an
The document provides information about what a data warehouse is and why it is important. A data warehouse is a relational database designed for querying and analysis that contains historical data from transaction systems and other sources. It allows organizations to access, analyze, and report on integrated information to support business processes and decisions.
A data warehouse is a relational database designed for query and analysis that contains historical data from transaction systems and other sources. It integrates data from various sources like ERP, weblogs, and legacy systems. The data in a data warehouse is nonvolatile, time-variant, and can be organized by subject area. A data warehouse provides a single, consistent view of data from across the organization to support reporting, analysis, and business decisions.
Oracle BI Applications provide pre-built analytics solutions that are integrated with Oracle and non-Oracle applications like EBS, PeopleSoft, Siebel, and JD Edwards. They allow users to gain insights from existing operational data without needing custom development. The presentations highlights the business need for pre-built analytics applications and an overview of Oracle's BI strategy and applications.
Shifting Trends - BI for Logistics IndustryDhiren Gala
Third party logistics (3PL) providers are under pressure to cut costs and boost efficiencies due to thin margins in the logistics industry. Business intelligence (BI) tools can help 3PLs optimize supply chain operations and provide strategic value to customers. BI involves collecting, analyzing and reporting data to improve decision making. It allows 3PLs to monitor key performance indicators, identify trends, and predict future business behaviors to stay competitive in a changing market.
SAP Analytics provides solutions to help organizations gain insights from supplier and spend data. The solutions address challenges such as lack of spend visibility, unreliable data, and inability to analyze spend by supplier. They involve data enrichment and classification to standardize suppliers, classify spending, and incorporate subject matter expertise to continuously improve data quality. This allows organizations to increase leverage opportunities, improve decision making, and accelerate savings.
Where Historian fits in the production data flow
Key features of Historian - High speed data collection, data storage and compression, integration with MSSQL, high speed data retrieval, audit trails
Basic configuration of the Historian - practical demonstration showing ease of use
Active Factory - the power of point and click reporting via a practical demonstration of Active Factory Trend, Query and Workbook, example workbook reports
This Webinar will be hosted by our Historian expert Sue Bailey. Sue joined SolutionsPT in 1993. Previously she worked in the Water Treatment industry, then the Pharmaceutical Industry running a microbiological research lab, she moved into IT in 1987. After spending several years lecturing in Higher education Sue is now involved in providing high level support and consultancy and developing the training facility.
Sue is SolutionsPT's Senior Consultant for Historian and Database systems and is experienced in all versions of InTouch, Historian and Active Factory. She has worked with Historian since its release and has been involved in setting up systems in many different industries including Metals, Coal, Quarried Products, Utilities, Food and Beverages and Pharmaceuticals.
Complex Event Processing (CEP) analyzes streams of event data to identify patterns and derive meaningful information. CEP allows for real-time situational awareness, immediate response, and better decision making using continuous intelligence. The Sybase Event Stream Processor is a CEP engine that can process unlimited input streams at high speeds with low latency. It is used for applications like fraud detection, system automation based on real-time conditions, streaming analytics, and continuous intelligence for better decisions.
The document discusses ICM/OIPTM, a tool for data integration and reconciliation across business processes and applications. It can integrate data from various sources like CRM, ERP, databases located in private and public clouds. The tool supports tasks like automated CMDB maintenance, incident registration from monitoring tools, and data warehouse reporting. It provides a centralized dashboard to view integration status. Regular issues like complex integrations and scattered data are solved using ICM/OIPTM's graphical workflows, encryption, and support for multiple integration protocols.
The document discusses SAP Analytics solutions for procurement that help address challenges around increasing costs and risk, limited spend visibility, and the need for reliable data through applications that provide spend analytics, supplier risk management, and data enrichment and classification to empower procurement, finance, and supply chain users with strategic supplier and spend intelligence. It highlights SAP's portfolio of procurement solutions including spend performance management, supplier management, sourcing, contract management, and invoice management that integrate analytics applications to optimize business processes.
Leveraging BI and Predictive Analytics to deliver Real time forecastingShyam Desigan
The document discusses how the American Academy of Physician Assistants (AAPA) used business intelligence and predictive analytics tools to better forecast trends for its members. It notes that PAs are projected to be the second fastest growing healthcare profession in the next decade. AAPA gathered member and industry data from various sources into centralized systems for integrated analysis. This allowed for real-time querying and visualization of key performance indicators. Tools like Adaptive Planning, QlikView and SPSS Modeler were leveraged for dashboarding, predictive modeling and insights. This helped AAPA improve forecasting, decision making and strategic planning for its growing membership base.
The document discusses how the American Academy of Physician Assistants (AAPA) is leveraging business intelligence (BI) and predictive analytics to deliver real-time forecasting. It notes that the PA profession is projected to be the second fastest growing health profession in the next decade. It then outlines AAPA's membership numbers and the top work settings and specialties for PAs. The document discusses the challenges of gathering, analyzing, and querying organizational data in real-time. It presents cloud-based BI and planning tools as a way to augment existing systems with greater flexibility, rapid deployment, and no IT involvement. Visualization and dashboard capabilities are highlighted. Finally, the document notes that AAPA utilizes SPSS
The document discusses how the American Academy of Physician Assistants (AAPA) is leveraging business intelligence (BI) and predictive analytics to deliver real-time forecasting. It notes that the PA profession is the second fastest growing health profession and provides statistics on current and projected PA employment numbers. It then outlines AAPA's membership statistics. The document discusses the challenges of gathering, analyzing, and querying organizational data in real-time. It presents Adaptive Planning and QlikView as cloud-based solutions that can integrate data sources, provide visual analytics dashboards, and enable self-service BI without IT involvement. It also mentions using SPSS Modeler for predictive analytics. The document concludes by inviting questions from the
The document discusses SAP Analytics for procurement. It describes how procurement and supply chain organizations are under pressure to reduce expenses and proactively manage supplier risk through continuous supplier and spend intelligence reporting. However, supplier data often requires de-duplication, normalization and enrichment before it can provide useful insights. SAP solutions partner with third-party data providers to empower procurement, finance and supply chain users with supplier and spend analytics capabilities. The document then outlines key components of SAP's offering including data enrichment and classification, spend performance management, and best practices.
The document discusses how an Automated Project Office (APO) system called ITBuzz can help a company gain visibility into projects, collect data on key performance metrics, and provide dashboards and reports to help managers identify issues early and ensure best practices are followed. ITBuzz integrates data from different domains like portfolio management, service delivery, and issue tracking to give managers a centralized view of project performance and health. Demonstrations of the ITBuzz system show how it can generate dashboards and reports on topics like resource loads, budgets, stage gates, and scorecards to help managers make more informed decisions.
1) The document discusses the evolution of data warehousing from static reporting databases to more advanced analytical applications. However, these static snapshots of data could not provide the most up-to-date information needed to act on business intelligence analyses.
2) It introduces the concept of an operational data store (ODS) that provides integrated, comprehensive and current data to enable businesses to act on analytical insights.
3) It describes how the traditional data warehouse provided static snapshots of data from the past, while an ODS contains live, current records to facilitate real-time decision making. This combination of static snapshots and live operational data is called an active data warehouse.
Similar to Operational B I In Supply Chain Planning (20)
- Spatial autocorrelation measures the correlation of a variable with itself through space and can be positive or negative. It quantifies the degree of spatial clustering or dispersion of values across locations.
- Global measures identify overall patterns of clustering, while local measures identify specific clusters. Spatial weights defining neighbor relationships are required.
- Contiguity-based weights define neighbors based on shared boundaries, while distance-based weights use a threshold distance. Higher order weights incorporate indirect neighbors.
- Spatially lagged variables are weighted averages of neighboring values and are important for spatial autocorrelation tests and regression models.
Text mining and social network analysis of twitter data part 1Johan Blomme
Twitter is one of the most popular social networks through which millions of users share information and express views and opinions. The rapid growth of internet data is a driver for mining the huge amount of unstructured data that is generated to uncover insights from it.
In the first part of this paper we explore different text mining tools. We collect tweets containing the “#MachineLearning” hashtag, prepare the data and run a series of diagnostics to mine the text that is contained in tweets. We also examine the issue of topic modeling that allows to estimate the similarity between documents in a larger corpus.
The present study evaluates the possibility of spatial heterogeneity in the effects on municipal-level crime rates of both demographic and socio-economic variables. Geoggraphically weighted regression (GWR) is used for exploring spatial heterogeneity and confirms that place matters.
In this study various techniques for exploratory spatial data analysis are reviewed : spatial autocorrelation, Moran's I statistic, hot spots analysis, spatial lag and spatial error models.
The document discusses trends in business intelligence (BI) and how the digital transformation is changing the nature of BI. Specifically, it notes that (1) the internet as the new societal operating system and cloud computing model represent disruptive changes, (2) big data from various sources along with trends like predictive analytics, self-service BI, and collaboration are changing how BI systems are deployed and used, and (3) these transformational changes represent a "new normal" for BI.
Business intelligence in the real time economyJohan Blomme
1. Business intelligence is evolving from reactive, historical reporting to real-time decision making embedded in business processes. This allows for more proactive responses to changing market conditions.
2. There is a shift towards self-service business intelligence where all employees can access, analyze, and share real-time data to improve decision making. Technologies like in-memory analytics enable faster, interactive analysis.
3. Collaboration and sharing of insights is facilitated by new interactive dashboard and visualization tools with Web 2.0 features. Business intelligence is becoming more user-centric and accessible for all employees.
E Business Integration. Enabling the Real Time EnterpriseJohan Blomme
The document discusses the transition to the real-time enterprise and the importance of integration, collaboration, and personalization. It notes that businesses must replace industrial-age strategies with real-time processes based on information. To compete in the new economy, companies must focus on customer experiences and knowledge across the entire value chain. Real-time data integration and business intelligence are essential for enabling personalization, predictive analytics, and a proactive, customer-centric approach.
Best Competitive Marble Pricing in Dubai - ☎ 9928909666Stone Art Hub
Stone Art Hub offers the best competitive Marble Pricing in Dubai, ensuring affordability without compromising quality. With a wide range of exquisite marble options to choose from, you can enhance your spaces with elegance and sophistication. For inquiries or orders, contact us at ☎ 9928909666. Experience luxury at unbeatable prices.
Part 2 Deep Dive: Navigating the 2024 Slowdownjeffkluth1
Introduction
The global retail industry has weathered numerous storms, with the financial crisis of 2008 serving as a poignant reminder of the sector's resilience and adaptability. However, as we navigate the complex landscape of 2024, retailers face a unique set of challenges that demand innovative strategies and a fundamental shift in mindset. This white paper contrasts the impact of the 2008 recession on the retail sector with the current headwinds retailers are grappling with, while offering a comprehensive roadmap for success in this new paradigm.
Call8328958814 satta matka Kalyan result satta guessing➑➌➋➑➒➎➑➑➊➍
Satta Matka Kalyan Main Mumbai Fastest Results
Satta Matka ❋ Sattamatka ❋ New Mumbai Ratan Satta Matka ❋ Fast Matka ❋ Milan Market ❋ Kalyan Matka Results ❋ Satta Game ❋ Matka Game ❋ Satta Matka ❋ Kalyan Satta Matka ❋ Mumbai Main ❋ Online Matka Results ❋ Satta Matka Tips ❋ Milan Chart ❋ Satta Matka Boss❋ New Star Day ❋ Satta King ❋ Live Satta Matka Results ❋ Satta Matka Company ❋ Indian Matka ❋ Satta Matka 143❋ Kalyan Night Matka..
Unveiling the Dynamic Personalities, Key Dates, and Horoscope Insights: Gemin...my Pandit
Explore the fascinating world of the Gemini Zodiac Sign. Discover the unique personality traits, key dates, and horoscope insights of Gemini individuals. Learn how their sociable, communicative nature and boundless curiosity make them the dynamic explorers of the zodiac. Dive into the duality of the Gemini sign and understand their intellectual and adventurous spirit.
Storytelling is an incredibly valuable tool to share data and information. To get the most impact from stories there are a number of key ingredients. These are based on science and human nature. Using these elements in a story you can deliver information impactfully, ensure action and drive change.
Understanding User Needs and Satisfying ThemAggregage
https://www.productmanagementtoday.com/frs/26903918/understanding-user-needs-and-satisfying-them
We know we want to create products which our customers find to be valuable. Whether we label it as customer-centric or product-led depends on how long we've been doing product management. There are three challenges we face when doing this. The obvious challenge is figuring out what our users need; the non-obvious challenges are in creating a shared understanding of those needs and in sensing if what we're doing is meeting those needs.
In this webinar, we won't focus on the research methods for discovering user-needs. We will focus on synthesis of the needs we discover, communication and alignment tools, and how we operationalize addressing those needs.
Industry expert Scott Sehlhorst will:
• Introduce a taxonomy for user goals with real world examples
• Present the Onion Diagram, a tool for contextualizing task-level goals
• Illustrate how customer journey maps capture activity-level and task-level goals
• Demonstrate the best approach to selection and prioritization of user-goals to address
• Highlight the crucial benchmarks, observable changes, in ensuring fulfillment of customer needs
3 Simple Steps To Buy Verified Payoneer Account In 2024SEOSMMEARTH
Buy Verified Payoneer Account: Quick and Secure Way to Receive Payments
Buy Verified Payoneer Account With 100% secure documents, [ USA, UK, CA ]. Are you looking for a reliable and safe way to receive payments online? Then you need buy verified Payoneer account ! Payoneer is a global payment platform that allows businesses and individuals to send and receive money in over 200 countries.
If You Want To More Information just Contact Now:
Skype: SEOSMMEARTH
Telegram: @seosmmearth
Gmail: seosmmearth@gmail.com
Brian Fitzsimmons on the Business Strategy and Content Flywheel of Barstool S...Neil Horowitz
On episode 272 of the Digital and Social Media Sports Podcast, Neil chatted with Brian Fitzsimmons, Director of Licensing and Business Development for Barstool Sports.
What follows is a collection of snippets from the podcast. To hear the full interview and more, check out the podcast on all podcast platforms and at www.dsmsports.net
Anny Serafina Love - Letter of Recommendation by Kellen Harkins, MS.AnnySerafinaLove
This letter, written by Kellen Harkins, Course Director at Full Sail University, commends Anny Love's exemplary performance in the Video Sharing Platforms class. It highlights her dedication, willingness to challenge herself, and exceptional skills in production, editing, and marketing across various video platforms like YouTube, TikTok, and Instagram.
SATTA MATKA SATTA FAST RESULT KALYAN TOP MATKA RESULT KALYAN SATTA MATKA FAST RESULT MILAN RATAN RAJDHANI MAIN BAZAR MATKA FAST TIPS RESULT MATKA CHART JODI CHART PANEL CHART FREE FIX GAME SATTAMATKA ! MATKA MOBI SATTA 143 spboss.in TOP NO1 RESULT FULL RATE MATKA ONLINE GAME PLAY BY APP SPBOSS
IMPACT Silver is a pure silver zinc producer with over $260 million in revenue since 2008 and a large 100% owned 210km Mexico land package - 2024 catalysts includes new 14% grade zinc Plomosas mine and 20,000m of fully funded exploration drilling.
Industrial Tech SW: Category Renewal and CreationChristian Dahlen
Every industrial revolution has created a new set of categories and a new set of players.
Multiple new technologies have emerged, but Samsara and C3.ai are only two companies which have gone public so far.
Manufacturing startups constitute the largest pipeline share of unicorns and IPO candidates in the SF Bay Area, and software startups dominate in Germany.
1. Solve the Insight Puzzle & See the Entire Picture !
Operational business intelligence in supply chain planning
Johan Blomme
Business Intelligence Manager, AMP
email
johan.blomme@ampnet.be
2. Agenda
Meeting the demand economy
Trends in business intelligence
Predicting out of stocks with real-time P.O.S.-data