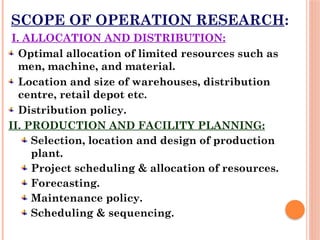
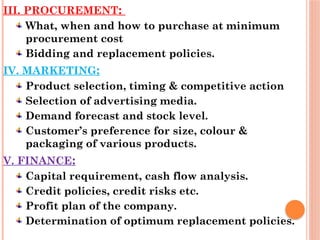
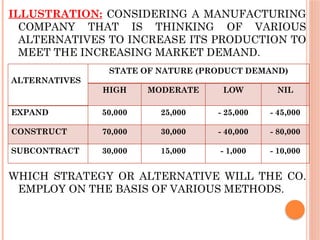
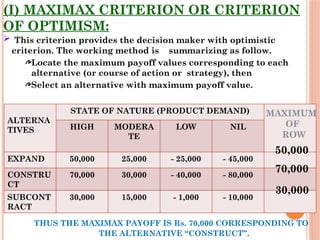
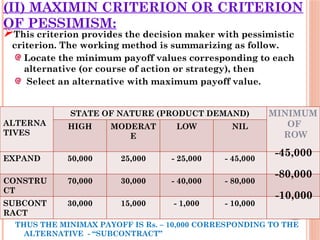
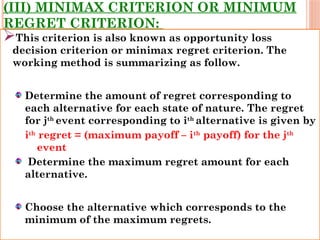
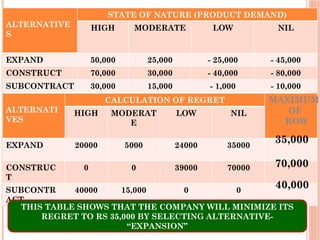
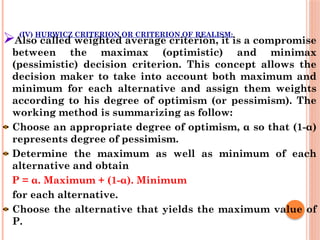
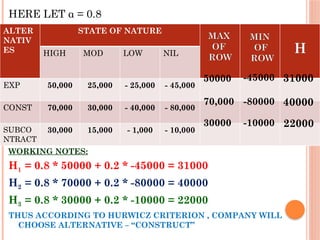
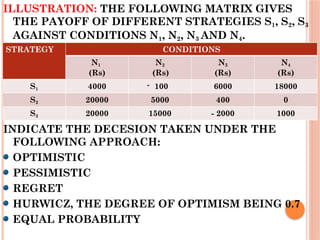
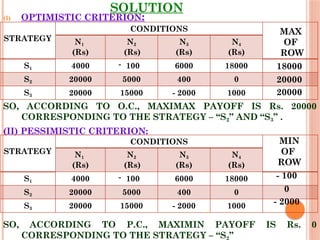
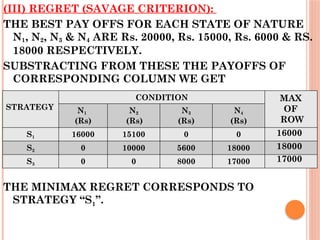
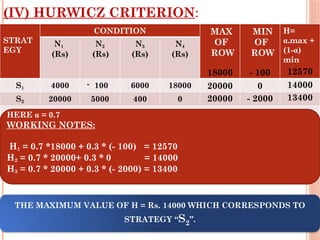
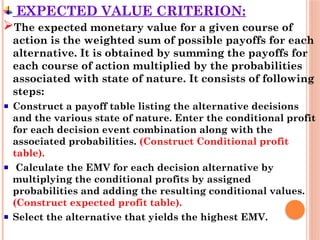
Operation Research (O.R.) is a systematic study aimed at optimizing decision-making within organizations by employing scientific methods and interdisciplinary approaches. It encompasses various domains such as resource allocation, production planning, procurement, marketing, finance, and personnel management, utilizing quantitative analysis for problem-solving. Key decision-making criteria discussed include Maximax, Maximin, Minimax, Hurwicz, and Laplace, applicable under conditions of certainty, uncertainty, and risk.

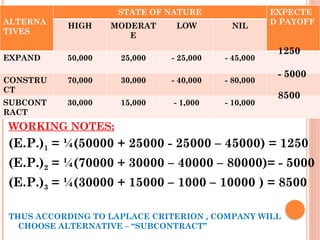
![(V) LAPLACE CRITERION OR CRITERION OF
RATIONALITY:
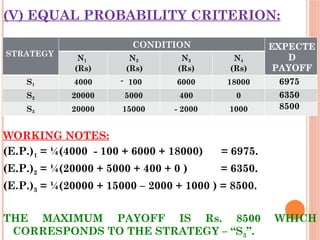
Also known as equal probabilities criterion or
criterion of rationality. Since the probability of states
of nature are not known, it is assumed that all states
of nature will occur with equal probability, i.e. assign
an equal probability. The working method is
summarizing as follow:
Determine expected value for each alternative; if n
denotes the number of events and P’s denote the
payoffs, then expected value is given by 1n[P1+P2+….
+Pn]
Choose the alternative that yields the maximum value
of P.](https://image.slidesharecdn.com/decesionmaking1-250130045422-85bdbb6c/85/Operation-Research-Decesion-making1-pptx-21-320.jpg)


![Basic Communication Skills[01]ngollf.ppt](https://cdn.slidesharecdn.com/ss_thumbnails/basiccommunicationskills1ngollf-250128095058-298bcb38-thumbnail.jpg?width=640&height=640&fit=bounds)


