SlideShare a Scribd company logo
Decision
Making &
Quantitative
Techniques
Sripriya Mehta
Nisha Juneja
Sheenu Aggarwal
Rohan Pandey
ASM
2 0 2 2 - 2 0 2 4
TABLE OF CONTENT
• Introduction
• Methodology of OR
• Nature and characteristic features of OR
• Assumptions underlying linear
programming
• Historical development
• Quantitative Approach to decision making
• Quantitative analysis and computer based
information system
Introduction
Why do we need Quantitative Technique?
We need Quantitative Technique to make decision.
Decision-making is an all-pervasive feature of management. It is a process
by which a manager, when faced with a problem, chooses a specific course
of action from among a set of possible alternatives.
As a managers we need to take decision on continuous basis. Those decision
can’t be made on the basis of rule of thumb, common sense or snap
judgement. We need some basis to make that decision.
Approaches
Traditional Approach Modern Approach
.
Art or talent that is
acquired over a period
of time through
experience.
Systematic and
scientific method as
now business operates
in complex and fast
changing environment
Classification of Decision Situation
Decision
under
Uncertainty
Decision
under
Certainty
Decisions under certainty,
where all facts are known
fully and for sure
Where the event that
would actually occur is not
known but probabilities
can be assigned to various
possible occurrences
(1 of
3)
Dynamic
Decision
Static
Decision
Decisions for one time
period only
A sequence of interrelated
decisions made either
simultaneously or over several
time periods, called dynamic
decisions.
Classification of Decision Situation (2 of
3)
Rational
Opponent
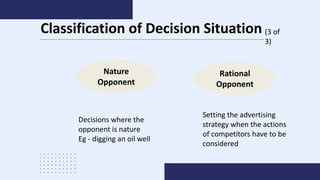
Nature
Opponent
Decisions where the
opponent is nature
Eg - digging an oil well
Setting the advertising
strategy when the actions
of competitors have to be
considered
Classification of Decision Situation (3 of
3)
Decision Making and Quantitative Analysis
P E S T L E
Political
Environmental
Social
Technological
Legal
Ecological
In Second world war, British
military management called
upon a group of scientists to
examine the strategies and
tactics of various military
operations.
New scientific and quantitative
techniques were developed to
assist military operations and to
determine the pattern of
Submarine attacks, flight pattern
The name operational research was
derived directly from the context in
which it was used-research activity on
operational areas of the armed forces.
Later, operations research was
adopted by the industry and
some of the techniques that
had been applied
In 1950s, OR was mainly used to
handle management problems
that were clear-cut, well-
structured and repetitive in
nature.
Since 1960s, however, formal
approaches have been
increasingly adopted for the
less well-structured planning
problems as well.
Historical Development of Operations Research
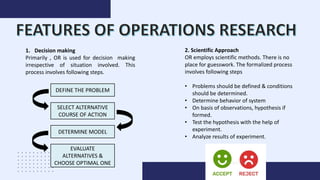
1. Decision making
Primarily , OR is used for decision making
irrespective of situation involved. This
process involves following steps.
DEFINE THE PROBLEM
SELECT ALTERNATIVE
COURSE OF ACTION
DETERMINE MODEL
EVALUATE
ALTERNATIVES &
CHOOSE OPTIMAL ONE
2. Scientific Approach
OR employs scientific methods. There is no
place for guesswork. The formalized process
involves following steps
• Problems should be defined & conditions
should be determined.
• Determine behavior of system
• On basis of observations, hypothesis if
formed.
• Test the hypothesis with the help of
experiment.
• Analyze results of experiment.
3. Objective
• OR attempts to find the best & optimal solution to the problem.
• It acts as the measure of effectiveness to compare alternatives.
4. Inter-disciplinary team approach.
• Requires team approach to a solution.
• No single person has knowledge of all the aspects of OR.
• Requires a group of people with different expertise for decision making.
• Experts in areas of Mathematics , Statistics, Engineering, Economics,
management, etc.
5. Digital Computer
• Very integral part of OR approach in decision making.
• Computers are required to handle huge sums of data and due to
complexity of model.
• “Canned Programs” are available to solve problems.
Methodology Of
Operations Research
Formulate the problem
Determine the assumptions and
formulate the problem in a
mathematical framework.
Acquire the input data.
Solve the model formulated and
interpret the results.
Validate the model
Implementation of solution obtained
1. Formulate the problem
• Define a clear & concise statement of the problem
• Analyst cannot deal with all the problems and
therefore one should select a few problems that are
likely to result in greatest profit increases or cost
reductions.
• After the problem is defined categorise it into the
following .
Problem
Standard problem
Also known as
programmed problems
These are well structured
problems characterized by
routine, repetitive decisions that
utilize specific decision making
technique in their solution
strategy
Special problem
Unique and non recurrent
in nature & therefore, ill
structured
2. Model building
• A model is a simplified representation of a real-
world situation that, ideally, strips a natural
phenomenon of its bewildering complexity and
replicates its essential behavior.
• The decision Maker has to abstract from the
empirical situation those factors which are more
relevant to the problem and combine them in logical
manner so that they form a counterpart or a model
of actual problem.
Model
Physical Model
Iconic Model
Analogue Model
Symbolic Model
Iconic Model
• An iconic model is an exact physical representation and may be larger or
smaller than what it represents.
• The characteristics of an iconic model and the object that it represents
are the same.
• Advantage: 1) Concrete & specific
2) Resembles visually the thing it represents & therefore
there are likely to be fewer problems in translating any
findings from the model in the real life situation.
• Disadvantage : They often do not lend themselves to manipulation for
experimental purpose.
Scale model of car
Analogue Model
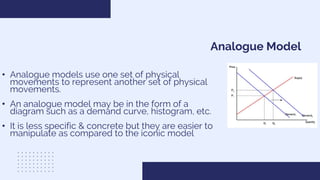
• Analogue models use one set of physical
movements to represent another set of physical
movements.
• An analogue model may be in the form of a
diagram such as a demand curve, histogram, etc.
• It is less specific & concrete but they are easier to
manipulate as compared to the iconic model
Symbolic/Mathematical Model
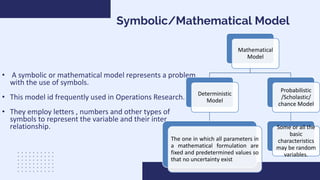
• A symbolic or mathematical model represents a problem
with the use of symbols.
• This model id frequently used in Operations Research.
• They employ letters , numbers and other types of
symbols to represent the variable and their inter
relationship.
Mathematical
Model
Deterministic
Model
The one in which all parameters in
a mathematical formulation are
fixed and predetermined values so
that no uncertainty exist
Probabilistic
/Scholastic/
chance Model
Some or all the
basic
characteristics
may be random
variables.
Symbolic/Mathematical Model
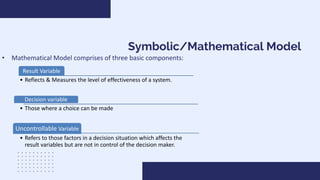
• Mathematical Model comprises of three basic components:
Result Variable
• Reflects & Measures the level of effectiveness of a system.
Decision variable
• Those where a choice can be made
Uncontrollable Variable
• Refers to those factors in a decision situation which affects the
result variables but are not in control of the decision maker.
3. Obtaining Input Data
• Sources of Data : 1) Company Reports
2) Company Documents
3) Interview with the company personnel
• It is very important to obtain accurate & complete data because the quality of
data determines the quality of output i.e. GIGO ( Garbage In garbage Out)
• Obtaining correct & relevant data is a difficult exercise
4. Solution Of Model
• A solution to a model implies determination of a specific set of decision variables
that would yields a desired level of output.
• Desired level of output is determined by the principle of choice adopted and
represents the level which optimizes.
• Feasible solution is a solution which satisfies all the constraints of the problem
whereas Infeasible solution are those solution which does not satisfy all the
constraints.
• Optimal solution is a feasible solution that optimizes whereas Non Optimal
solution is a feasible solution other than the optimal.
• Unique solution are those where only one optimal solution of the problem exists
whereas in Multiple Solutions more than one optimal solution exists and are
equally efficient.
Sensitivity analysis
• Also called as post-optimality analysis
• By sensitivity analysis we imply determination of the behavior of the system to
changes in the system inputs and specifications
• It is what if analysis , this is done because the input data and the structural
assumptions of the model may not be valid.
5. Model Validation
• The validation of a model requires determining whether the model can
adequately and reliably predict the behavior of the real system that it seeks to
represent
• Usually, the validity of a model is tested by comparing its performance with the
past data available in respect of the actual system.
6. Implementation
• Implementation is the process of incorporating the solution in the organization.
• No standard prescription can be given, which would ensure that the solution
obtained would automatically be adopted & implemented
because the technique & models used in OR may sound such and may be
detailed in mathematical terms.
• A model that secures a moderate theoretical benefit and is implemented is
better than a model which ranks very high on obtaining theoretical advantage
but cannot be implemented.
Files
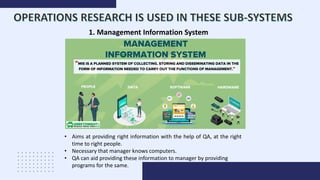
1. Management Information System
• Aims at providing right information with the help of QA, at the right
time to right people.
• Necessary that manager knows computers.
• QA can aid providing these information to manager by providing
programs for the same.
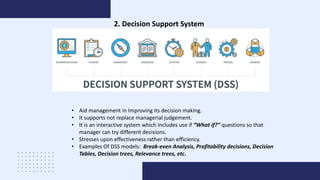
2. Decision Support System
• Aid management in Improving its decision making.
• It supports not replace managerial judgement.
• It is an interactive system which includes use if “What if?” questions so that
manager can try different decisions.
• Stresses upon effectiveness rather than efficiency.
• Examples Of DSS models: Break-even Analysis, Profitability decisions, Decision
Tables, Decision trees, Relevance trees, etc.
3. Artificial Intelligence and expert systems
• Artificial intelligence (AI) refers to the simulation of human intelligence in
machines that are programmed to think like humans and mimic their
actions.
• Support and automate decision making and act like intelligent decision-
makers
• Empowered with AI, you can make small decisions on the go, solve
complex problems, initiate strategic changes, evaluate risks, and assess
your entire business performance.
ASSUMPTIONS UNDERLYING
LINEAR PROGRAMMING
• Proportionality- every orange contributes to the
profit equally , ie if x=10rupees (profit) the total
profit= (units sold) 10x (profit per unit)
• Certainty- that the number of oranges and
apples their respective quantities p.p.u(profit per
unit) are known with certainty.
• Additivity-1 oranges value has to remain as one
and adding another, 2 oranges should be 20
rupees p.p.u. and the objective function of the
equation has to be written as the sum of each
activity conducted.
• Finite Choices- there are only so many ways you
can sell apples and oranges, and negatives on
either side are unacceptable.
Continuity
• Another assumption of linear
programming is that the decision
variables are continuous. This means a
combination of outputs can be used
with the fractional values along with the
integer values.
• But its impossible to sell .47 of an
orange thus for one off decisions we
round off integers and see if they fall in
the feasible range and is the best
integer solution .
• WIP.
Z=10x+5y is maximized
Objective Function for
maximized Z(profit)
Z=10x+5y
1 unit =10 rupees
1unit=5 rupees
THA
THANK YOU
OUR TEAM
Sheenu Aggarwal
Roll No – 30/039
Nisha Juneja
Roll No – 30/025
Sripriya Mehta
Roll No – 30/043
Rohan Pandey
Roll No – 30/034

More Related Content

Similar to QT final.pptx

Operational research ppt
Operational research pptOperational research ppt
Operational research ppt
DhrubajyotiBora1
 
Decision making by suresh aadi8888
Decision making by suresh aadi8888Decision making by suresh aadi8888
Decision making by suresh aadi8888Suresh Aadi Sharma
 
1st Lecture.pdf
1st Lecture.pdf1st Lecture.pdf
1st Lecture.pdf
TayyabHameed15
 
05.system model and diagram
05.system model and diagram05.system model and diagram
05.system model and diagram
Rio Aurachman
 
LPP application and problem formulation
LPP application and problem formulationLPP application and problem formulation
LPP application and problem formulation
Karishma Chaudhary
 
Analysis in Action 21 September 2021
Analysis in Action 21 September 2021Analysis in Action 21 September 2021
Analysis in Action 21 September 2021
IIBA UK Chapter
 
Research Methodology Chapter 3
Research Methodology Chapter 3Research Methodology Chapter 3
Research Methodology Chapter 3Pulchowk Campus
 
Chapter 4.ppt mizan Tepi university student population
Chapter 4.ppt mizan Tepi university student populationChapter 4.ppt mizan Tepi university student population
Chapter 4.ppt mizan Tepi university student population
MalichaGalma
 
Fundamentals of Quantitative Analysis
Fundamentals of Quantitative AnalysisFundamentals of Quantitative Analysis
Fundamentals of Quantitative Analysis
Jubayer Alam Shoikat
 
TIARA Module 3 Design and Analysis Dr. Anne Sales 082019
TIARA Module 3 Design and Analysis  Dr. Anne Sales 082019TIARA Module 3 Design and Analysis  Dr. Anne Sales 082019
TIARA Module 3 Design and Analysis Dr. Anne Sales 082019
Stacy Farr, PhD, MPH
 
Operation Research VS Software Engineering
Operation Research VS Software EngineeringOperation Research VS Software Engineering
Operation Research VS Software Engineering
Muthuganesh S
 
Chaptfhhdggdhghgdhgdhgdgffghfghffer-3.pptx
Chaptfhhdggdhghgdhgdhgdgffghfghffer-3.pptxChaptfhhdggdhghgdhgdhgdgffghfghffer-3.pptx
Chaptfhhdggdhghgdhgdhgdgffghfghffer-3.pptx
brhanegebrewahd414
 
Managerial Decision Making by Dr. B. J. Mohite
Managerial Decision Making by Dr. B. J. MohiteManagerial Decision Making by Dr. B. J. Mohite
Managerial Decision Making by Dr. B. J. Mohite
Zeal Education Society, Pune
 
05) marketing research design
05) marketing research design05) marketing research design
05) marketing research designSyed Osama Rizvi
 
Ronan Consulting Group - Systems Selection and Implementation
Ronan Consulting Group - Systems Selection and ImplementationRonan Consulting Group - Systems Selection and Implementation
Ronan Consulting Group - Systems Selection and Implementation
Steve Ronan
 
Engineering_Management.pptx.pdf
Engineering_Management.pptx.pdfEngineering_Management.pptx.pdf
Engineering_Management.pptx.pdf
luxasuhi
 
Iti week 10 (3)
Iti week 10 (3)Iti week 10 (3)
Iti week 10 (3)
Syed Zaid Irshad
 
effectivedecisionmaking-111214021741-phpapp02 (1).pptx
effectivedecisionmaking-111214021741-phpapp02 (1).pptxeffectivedecisionmaking-111214021741-phpapp02 (1).pptx
effectivedecisionmaking-111214021741-phpapp02 (1).pptx
SaminaNawaz14
 
Performance Management - Herman Augnis
Performance Management - Herman Augnis Performance Management - Herman Augnis
Performance Management - Herman Augnis
Preeti Bhaskar
 

Similar to QT final.pptx (20)

Operational research ppt
Operational research pptOperational research ppt
Operational research ppt
 
Decision making by suresh aadi8888
Decision making by suresh aadi8888Decision making by suresh aadi8888
Decision making by suresh aadi8888
 
1st Lecture.pdf
1st Lecture.pdf1st Lecture.pdf
1st Lecture.pdf
 
05.system model and diagram
05.system model and diagram05.system model and diagram
05.system model and diagram
 
LPP application and problem formulation
LPP application and problem formulationLPP application and problem formulation
LPP application and problem formulation
 
Analysis in Action 21 September 2021
Analysis in Action 21 September 2021Analysis in Action 21 September 2021
Analysis in Action 21 September 2021
 
Research Methodology Chapter 3
Research Methodology Chapter 3Research Methodology Chapter 3
Research Methodology Chapter 3
 
Chapter 4.ppt mizan Tepi university student population
Chapter 4.ppt mizan Tepi university student populationChapter 4.ppt mizan Tepi university student population
Chapter 4.ppt mizan Tepi university student population
 
Fundamentals of Quantitative Analysis
Fundamentals of Quantitative AnalysisFundamentals of Quantitative Analysis
Fundamentals of Quantitative Analysis
 
TIARA Module 3 Design and Analysis Dr. Anne Sales 082019
TIARA Module 3 Design and Analysis  Dr. Anne Sales 082019TIARA Module 3 Design and Analysis  Dr. Anne Sales 082019
TIARA Module 3 Design and Analysis Dr. Anne Sales 082019
 
Operation Research VS Software Engineering
Operation Research VS Software EngineeringOperation Research VS Software Engineering
Operation Research VS Software Engineering
 
01 intro
01 intro01 intro
01 intro
 
Chaptfhhdggdhghgdhgdhgdgffghfghffer-3.pptx
Chaptfhhdggdhghgdhgdhgdgffghfghffer-3.pptxChaptfhhdggdhghgdhgdhgdgffghfghffer-3.pptx
Chaptfhhdggdhghgdhgdhgdgffghfghffer-3.pptx
 
Managerial Decision Making by Dr. B. J. Mohite
Managerial Decision Making by Dr. B. J. MohiteManagerial Decision Making by Dr. B. J. Mohite
Managerial Decision Making by Dr. B. J. Mohite
 
05) marketing research design
05) marketing research design05) marketing research design
05) marketing research design
 
Ronan Consulting Group - Systems Selection and Implementation
Ronan Consulting Group - Systems Selection and ImplementationRonan Consulting Group - Systems Selection and Implementation
Ronan Consulting Group - Systems Selection and Implementation
 
Engineering_Management.pptx.pdf
Engineering_Management.pptx.pdfEngineering_Management.pptx.pdf
Engineering_Management.pptx.pdf
 
Iti week 10 (3)
Iti week 10 (3)Iti week 10 (3)
Iti week 10 (3)
 
effectivedecisionmaking-111214021741-phpapp02 (1).pptx
effectivedecisionmaking-111214021741-phpapp02 (1).pptxeffectivedecisionmaking-111214021741-phpapp02 (1).pptx
effectivedecisionmaking-111214021741-phpapp02 (1).pptx
 
Performance Management - Herman Augnis
Performance Management - Herman Augnis Performance Management - Herman Augnis
Performance Management - Herman Augnis
 

Recently uploaded

Chatty Kathy - UNC Bootcamp Final Project Presentation - Final Version - 5.23...
Chatty Kathy - UNC Bootcamp Final Project Presentation - Final Version - 5.23...Chatty Kathy - UNC Bootcamp Final Project Presentation - Final Version - 5.23...
Chatty Kathy - UNC Bootcamp Final Project Presentation - Final Version - 5.23...
John Andrews
 
一比一原版(NYU毕业证)纽约大学毕业证成绩单
一比一原版(NYU毕业证)纽约大学毕业证成绩单一比一原版(NYU毕业证)纽约大学毕业证成绩单
一比一原版(NYU毕业证)纽约大学毕业证成绩单
ewymefz
 
一比一原版(TWU毕业证)西三一大学毕业证成绩单
一比一原版(TWU毕业证)西三一大学毕业证成绩单一比一原版(TWU毕业证)西三一大学毕业证成绩单
一比一原版(TWU毕业证)西三一大学毕业证成绩单
ocavb
 
Predicting Product Ad Campaign Performance: A Data Analysis Project Presentation
Predicting Product Ad Campaign Performance: A Data Analysis Project PresentationPredicting Product Ad Campaign Performance: A Data Analysis Project Presentation
Predicting Product Ad Campaign Performance: A Data Analysis Project Presentation
Boston Institute of Analytics
 
Criminal IP - Threat Hunting Webinar.pdf
Criminal IP - Threat Hunting Webinar.pdfCriminal IP - Threat Hunting Webinar.pdf
Criminal IP - Threat Hunting Webinar.pdf
Criminal IP
 
Sample_Global Non-invasive Prenatal Testing (NIPT) Market, 2019-2030.pdf
Sample_Global Non-invasive Prenatal Testing (NIPT) Market, 2019-2030.pdfSample_Global Non-invasive Prenatal Testing (NIPT) Market, 2019-2030.pdf
Sample_Global Non-invasive Prenatal Testing (NIPT) Market, 2019-2030.pdf
Linda486226
 
一比一原版(UMich毕业证)密歇根大学|安娜堡分校毕业证成绩单
一比一原版(UMich毕业证)密歇根大学|安娜堡分校毕业证成绩单一比一原版(UMich毕业证)密歇根大学|安娜堡分校毕业证成绩单
一比一原版(UMich毕业证)密歇根大学|安娜堡分校毕业证成绩单
ewymefz
 
一比一原版(CBU毕业证)卡普顿大学毕业证成绩单
一比一原版(CBU毕业证)卡普顿大学毕业证成绩单一比一原版(CBU毕业证)卡普顿大学毕业证成绩单
一比一原版(CBU毕业证)卡普顿大学毕业证成绩单
nscud
 
一比一原版(YU毕业证)约克大学毕业证成绩单
一比一原版(YU毕业证)约克大学毕业证成绩单一比一原版(YU毕业证)约克大学毕业证成绩单
一比一原版(YU毕业证)约克大学毕业证成绩单
enxupq
 
Q1’2024 Update: MYCI’s Leap Year Rebound
Q1’2024 Update: MYCI’s Leap Year ReboundQ1’2024 Update: MYCI’s Leap Year Rebound
Q1’2024 Update: MYCI’s Leap Year Rebound
Oppotus
 
Empowering Data Analytics Ecosystem.pptx
Empowering Data Analytics Ecosystem.pptxEmpowering Data Analytics Ecosystem.pptx
Empowering Data Analytics Ecosystem.pptx
benishzehra469
 
Jpolillo Amazon PPC - Bid Optimization Sample
Jpolillo Amazon PPC - Bid Optimization SampleJpolillo Amazon PPC - Bid Optimization Sample
Jpolillo Amazon PPC - Bid Optimization Sample
James Polillo
 
tapal brand analysis PPT slide for comptetive data
tapal brand analysis PPT slide for comptetive datatapal brand analysis PPT slide for comptetive data
tapal brand analysis PPT slide for comptetive data
theahmadsaood
 
FP Growth Algorithm and its Applications
FP Growth Algorithm and its ApplicationsFP Growth Algorithm and its Applications
FP Growth Algorithm and its Applications
MaleehaSheikh2
 
Ch03-Managing the Object-Oriented Information Systems Project a.pdf
Ch03-Managing the Object-Oriented Information Systems Project a.pdfCh03-Managing the Object-Oriented Information Systems Project a.pdf
Ch03-Managing the Object-Oriented Information Systems Project a.pdf
haila53
 
Levelwise PageRank with Loop-Based Dead End Handling Strategy : SHORT REPORT ...
Levelwise PageRank with Loop-Based Dead End Handling Strategy : SHORT REPORT ...Levelwise PageRank with Loop-Based Dead End Handling Strategy : SHORT REPORT ...
Levelwise PageRank with Loop-Based Dead End Handling Strategy : SHORT REPORT ...
Subhajit Sahu
 
Algorithmic optimizations for Dynamic Levelwise PageRank (from STICD) : SHORT...
Algorithmic optimizations for Dynamic Levelwise PageRank (from STICD) : SHORT...Algorithmic optimizations for Dynamic Levelwise PageRank (from STICD) : SHORT...
Algorithmic optimizations for Dynamic Levelwise PageRank (from STICD) : SHORT...
Subhajit Sahu
 
社内勉強会資料_LLM Agents                              .
社内勉強会資料_LLM Agents                              .社内勉強会資料_LLM Agents                              .
社内勉強会資料_LLM Agents                              .
NABLAS株式会社
 
一比一原版(ArtEZ毕业证)ArtEZ艺术学院毕业证成绩单
一比一原版(ArtEZ毕业证)ArtEZ艺术学院毕业证成绩单一比一原版(ArtEZ毕业证)ArtEZ艺术学院毕业证成绩单
一比一原版(ArtEZ毕业证)ArtEZ艺术学院毕业证成绩单
vcaxypu
 
standardisation of garbhpala offhgfffghh
standardisation of garbhpala offhgfffghhstandardisation of garbhpala offhgfffghh
standardisation of garbhpala offhgfffghh
ArpitMalhotra16
 

Recently uploaded (20)

Chatty Kathy - UNC Bootcamp Final Project Presentation - Final Version - 5.23...
Chatty Kathy - UNC Bootcamp Final Project Presentation - Final Version - 5.23...Chatty Kathy - UNC Bootcamp Final Project Presentation - Final Version - 5.23...
Chatty Kathy - UNC Bootcamp Final Project Presentation - Final Version - 5.23...
 
一比一原版(NYU毕业证)纽约大学毕业证成绩单
一比一原版(NYU毕业证)纽约大学毕业证成绩单一比一原版(NYU毕业证)纽约大学毕业证成绩单
一比一原版(NYU毕业证)纽约大学毕业证成绩单
 
一比一原版(TWU毕业证)西三一大学毕业证成绩单
一比一原版(TWU毕业证)西三一大学毕业证成绩单一比一原版(TWU毕业证)西三一大学毕业证成绩单
一比一原版(TWU毕业证)西三一大学毕业证成绩单
 
Predicting Product Ad Campaign Performance: A Data Analysis Project Presentation
Predicting Product Ad Campaign Performance: A Data Analysis Project PresentationPredicting Product Ad Campaign Performance: A Data Analysis Project Presentation
Predicting Product Ad Campaign Performance: A Data Analysis Project Presentation
 
Criminal IP - Threat Hunting Webinar.pdf
Criminal IP - Threat Hunting Webinar.pdfCriminal IP - Threat Hunting Webinar.pdf
Criminal IP - Threat Hunting Webinar.pdf
 
Sample_Global Non-invasive Prenatal Testing (NIPT) Market, 2019-2030.pdf
Sample_Global Non-invasive Prenatal Testing (NIPT) Market, 2019-2030.pdfSample_Global Non-invasive Prenatal Testing (NIPT) Market, 2019-2030.pdf
Sample_Global Non-invasive Prenatal Testing (NIPT) Market, 2019-2030.pdf
 
一比一原版(UMich毕业证)密歇根大学|安娜堡分校毕业证成绩单
一比一原版(UMich毕业证)密歇根大学|安娜堡分校毕业证成绩单一比一原版(UMich毕业证)密歇根大学|安娜堡分校毕业证成绩单
一比一原版(UMich毕业证)密歇根大学|安娜堡分校毕业证成绩单
 
一比一原版(CBU毕业证)卡普顿大学毕业证成绩单
一比一原版(CBU毕业证)卡普顿大学毕业证成绩单一比一原版(CBU毕业证)卡普顿大学毕业证成绩单
一比一原版(CBU毕业证)卡普顿大学毕业证成绩单
 
一比一原版(YU毕业证)约克大学毕业证成绩单
一比一原版(YU毕业证)约克大学毕业证成绩单一比一原版(YU毕业证)约克大学毕业证成绩单
一比一原版(YU毕业证)约克大学毕业证成绩单
 
Q1’2024 Update: MYCI’s Leap Year Rebound
Q1’2024 Update: MYCI’s Leap Year ReboundQ1’2024 Update: MYCI’s Leap Year Rebound
Q1’2024 Update: MYCI’s Leap Year Rebound
 
Empowering Data Analytics Ecosystem.pptx
Empowering Data Analytics Ecosystem.pptxEmpowering Data Analytics Ecosystem.pptx
Empowering Data Analytics Ecosystem.pptx
 
Jpolillo Amazon PPC - Bid Optimization Sample
Jpolillo Amazon PPC - Bid Optimization SampleJpolillo Amazon PPC - Bid Optimization Sample
Jpolillo Amazon PPC - Bid Optimization Sample
 
tapal brand analysis PPT slide for comptetive data
tapal brand analysis PPT slide for comptetive datatapal brand analysis PPT slide for comptetive data
tapal brand analysis PPT slide for comptetive data
 
FP Growth Algorithm and its Applications
FP Growth Algorithm and its ApplicationsFP Growth Algorithm and its Applications
FP Growth Algorithm and its Applications
 
Ch03-Managing the Object-Oriented Information Systems Project a.pdf
Ch03-Managing the Object-Oriented Information Systems Project a.pdfCh03-Managing the Object-Oriented Information Systems Project a.pdf
Ch03-Managing the Object-Oriented Information Systems Project a.pdf
 
Levelwise PageRank with Loop-Based Dead End Handling Strategy : SHORT REPORT ...
Levelwise PageRank with Loop-Based Dead End Handling Strategy : SHORT REPORT ...Levelwise PageRank with Loop-Based Dead End Handling Strategy : SHORT REPORT ...
Levelwise PageRank with Loop-Based Dead End Handling Strategy : SHORT REPORT ...
 
Algorithmic optimizations for Dynamic Levelwise PageRank (from STICD) : SHORT...
Algorithmic optimizations for Dynamic Levelwise PageRank (from STICD) : SHORT...Algorithmic optimizations for Dynamic Levelwise PageRank (from STICD) : SHORT...
Algorithmic optimizations for Dynamic Levelwise PageRank (from STICD) : SHORT...
 
社内勉強会資料_LLM Agents                              .
社内勉強会資料_LLM Agents                              .社内勉強会資料_LLM Agents                              .
社内勉強会資料_LLM Agents                              .
 
一比一原版(ArtEZ毕业证)ArtEZ艺术学院毕业证成绩单
一比一原版(ArtEZ毕业证)ArtEZ艺术学院毕业证成绩单一比一原版(ArtEZ毕业证)ArtEZ艺术学院毕业证成绩单
一比一原版(ArtEZ毕业证)ArtEZ艺术学院毕业证成绩单
 
standardisation of garbhpala offhgfffghh
standardisation of garbhpala offhgfffghhstandardisation of garbhpala offhgfffghh
standardisation of garbhpala offhgfffghh
 

QT final.pptx

  • 1. Decision Making & Quantitative Techniques Sripriya Mehta Nisha Juneja Sheenu Aggarwal Rohan Pandey ASM 2 0 2 2 - 2 0 2 4
  • 2. TABLE OF CONTENT • Introduction • Methodology of OR • Nature and characteristic features of OR • Assumptions underlying linear programming • Historical development • Quantitative Approach to decision making • Quantitative analysis and computer based information system
  • 3. Introduction Why do we need Quantitative Technique? We need Quantitative Technique to make decision. Decision-making is an all-pervasive feature of management. It is a process by which a manager, when faced with a problem, chooses a specific course of action from among a set of possible alternatives. As a managers we need to take decision on continuous basis. Those decision can’t be made on the basis of rule of thumb, common sense or snap judgement. We need some basis to make that decision.
  • 4. Approaches Traditional Approach Modern Approach . Art or talent that is acquired over a period of time through experience. Systematic and scientific method as now business operates in complex and fast changing environment
  • 5. Classification of Decision Situation Decision under Uncertainty Decision under Certainty Decisions under certainty, where all facts are known fully and for sure Where the event that would actually occur is not known but probabilities can be assigned to various possible occurrences (1 of 3)
  • 6. Dynamic Decision Static Decision Decisions for one time period only A sequence of interrelated decisions made either simultaneously or over several time periods, called dynamic decisions. Classification of Decision Situation (2 of 3)
  • 7. Rational Opponent Nature Opponent Decisions where the opponent is nature Eg - digging an oil well Setting the advertising strategy when the actions of competitors have to be considered Classification of Decision Situation (3 of 3)
  • 8. Decision Making and Quantitative Analysis P E S T L E Political Environmental Social Technological Legal Ecological
  • 9. In Second world war, British military management called upon a group of scientists to examine the strategies and tactics of various military operations. New scientific and quantitative techniques were developed to assist military operations and to determine the pattern of Submarine attacks, flight pattern The name operational research was derived directly from the context in which it was used-research activity on operational areas of the armed forces. Later, operations research was adopted by the industry and some of the techniques that had been applied In 1950s, OR was mainly used to handle management problems that were clear-cut, well- structured and repetitive in nature. Since 1960s, however, formal approaches have been increasingly adopted for the less well-structured planning problems as well. Historical Development of Operations Research
  • 10. 1. Decision making Primarily , OR is used for decision making irrespective of situation involved. This process involves following steps. DEFINE THE PROBLEM SELECT ALTERNATIVE COURSE OF ACTION DETERMINE MODEL EVALUATE ALTERNATIVES & CHOOSE OPTIMAL ONE 2. Scientific Approach OR employs scientific methods. There is no place for guesswork. The formalized process involves following steps • Problems should be defined & conditions should be determined. • Determine behavior of system • On basis of observations, hypothesis if formed. • Test the hypothesis with the help of experiment. • Analyze results of experiment.
  • 11. 3. Objective • OR attempts to find the best & optimal solution to the problem. • It acts as the measure of effectiveness to compare alternatives. 4. Inter-disciplinary team approach. • Requires team approach to a solution. • No single person has knowledge of all the aspects of OR. • Requires a group of people with different expertise for decision making. • Experts in areas of Mathematics , Statistics, Engineering, Economics, management, etc. 5. Digital Computer • Very integral part of OR approach in decision making. • Computers are required to handle huge sums of data and due to complexity of model. • “Canned Programs” are available to solve problems.
  • 12. Methodology Of Operations Research Formulate the problem Determine the assumptions and formulate the problem in a mathematical framework. Acquire the input data. Solve the model formulated and interpret the results. Validate the model Implementation of solution obtained
  • 13. 1. Formulate the problem • Define a clear & concise statement of the problem • Analyst cannot deal with all the problems and therefore one should select a few problems that are likely to result in greatest profit increases or cost reductions. • After the problem is defined categorise it into the following . Problem Standard problem Also known as programmed problems These are well structured problems characterized by routine, repetitive decisions that utilize specific decision making technique in their solution strategy Special problem Unique and non recurrent in nature & therefore, ill structured
  • 14. 2. Model building • A model is a simplified representation of a real- world situation that, ideally, strips a natural phenomenon of its bewildering complexity and replicates its essential behavior. • The decision Maker has to abstract from the empirical situation those factors which are more relevant to the problem and combine them in logical manner so that they form a counterpart or a model of actual problem. Model Physical Model Iconic Model Analogue Model Symbolic Model
  • 15. Iconic Model • An iconic model is an exact physical representation and may be larger or smaller than what it represents. • The characteristics of an iconic model and the object that it represents are the same. • Advantage: 1) Concrete & specific 2) Resembles visually the thing it represents & therefore there are likely to be fewer problems in translating any findings from the model in the real life situation. • Disadvantage : They often do not lend themselves to manipulation for experimental purpose. Scale model of car
  • 16. Analogue Model • Analogue models use one set of physical movements to represent another set of physical movements. • An analogue model may be in the form of a diagram such as a demand curve, histogram, etc. • It is less specific & concrete but they are easier to manipulate as compared to the iconic model
  • 17. Symbolic/Mathematical Model • A symbolic or mathematical model represents a problem with the use of symbols. • This model id frequently used in Operations Research. • They employ letters , numbers and other types of symbols to represent the variable and their inter relationship. Mathematical Model Deterministic Model The one in which all parameters in a mathematical formulation are fixed and predetermined values so that no uncertainty exist Probabilistic /Scholastic/ chance Model Some or all the basic characteristics may be random variables.
  • 18. Symbolic/Mathematical Model • Mathematical Model comprises of three basic components: Result Variable • Reflects & Measures the level of effectiveness of a system. Decision variable • Those where a choice can be made Uncontrollable Variable • Refers to those factors in a decision situation which affects the result variables but are not in control of the decision maker.
  • 19. 3. Obtaining Input Data • Sources of Data : 1) Company Reports 2) Company Documents 3) Interview with the company personnel • It is very important to obtain accurate & complete data because the quality of data determines the quality of output i.e. GIGO ( Garbage In garbage Out) • Obtaining correct & relevant data is a difficult exercise
  • 20. 4. Solution Of Model • A solution to a model implies determination of a specific set of decision variables that would yields a desired level of output. • Desired level of output is determined by the principle of choice adopted and represents the level which optimizes. • Feasible solution is a solution which satisfies all the constraints of the problem whereas Infeasible solution are those solution which does not satisfy all the constraints. • Optimal solution is a feasible solution that optimizes whereas Non Optimal solution is a feasible solution other than the optimal. • Unique solution are those where only one optimal solution of the problem exists whereas in Multiple Solutions more than one optimal solution exists and are equally efficient.
  • 21. Sensitivity analysis • Also called as post-optimality analysis • By sensitivity analysis we imply determination of the behavior of the system to changes in the system inputs and specifications • It is what if analysis , this is done because the input data and the structural assumptions of the model may not be valid.
  • 22. 5. Model Validation • The validation of a model requires determining whether the model can adequately and reliably predict the behavior of the real system that it seeks to represent • Usually, the validity of a model is tested by comparing its performance with the past data available in respect of the actual system.
  • 23. 6. Implementation • Implementation is the process of incorporating the solution in the organization. • No standard prescription can be given, which would ensure that the solution obtained would automatically be adopted & implemented because the technique & models used in OR may sound such and may be detailed in mathematical terms. • A model that secures a moderate theoretical benefit and is implemented is better than a model which ranks very high on obtaining theoretical advantage but cannot be implemented.
  • 24. Files
  • 25. 1. Management Information System • Aims at providing right information with the help of QA, at the right time to right people. • Necessary that manager knows computers. • QA can aid providing these information to manager by providing programs for the same.
  • 26. 2. Decision Support System • Aid management in Improving its decision making. • It supports not replace managerial judgement. • It is an interactive system which includes use if “What if?” questions so that manager can try different decisions. • Stresses upon effectiveness rather than efficiency. • Examples Of DSS models: Break-even Analysis, Profitability decisions, Decision Tables, Decision trees, Relevance trees, etc.
  • 27. 3. Artificial Intelligence and expert systems • Artificial intelligence (AI) refers to the simulation of human intelligence in machines that are programmed to think like humans and mimic their actions. • Support and automate decision making and act like intelligent decision- makers • Empowered with AI, you can make small decisions on the go, solve complex problems, initiate strategic changes, evaluate risks, and assess your entire business performance.
  • 28. ASSUMPTIONS UNDERLYING LINEAR PROGRAMMING • Proportionality- every orange contributes to the profit equally , ie if x=10rupees (profit) the total profit= (units sold) 10x (profit per unit) • Certainty- that the number of oranges and apples their respective quantities p.p.u(profit per unit) are known with certainty. • Additivity-1 oranges value has to remain as one and adding another, 2 oranges should be 20 rupees p.p.u. and the objective function of the equation has to be written as the sum of each activity conducted. • Finite Choices- there are only so many ways you can sell apples and oranges, and negatives on either side are unacceptable.
  • 29. Continuity • Another assumption of linear programming is that the decision variables are continuous. This means a combination of outputs can be used with the fractional values along with the integer values. • But its impossible to sell .47 of an orange thus for one off decisions we round off integers and see if they fall in the feasible range and is the best integer solution . • WIP.
  • 30. Z=10x+5y is maximized Objective Function for maximized Z(profit) Z=10x+5y 1 unit =10 rupees 1unit=5 rupees
  • 31. THA THANK YOU OUR TEAM Sheenu Aggarwal Roll No – 30/039 Nisha Juneja Roll No – 30/025 Sripriya Mehta Roll No – 30/043 Rohan Pandey Roll No – 30/034