Download as PDF, PPTX
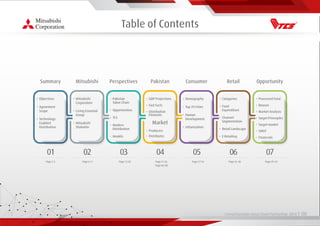
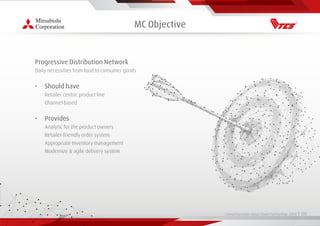
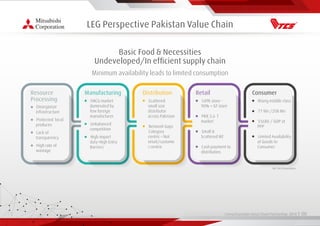
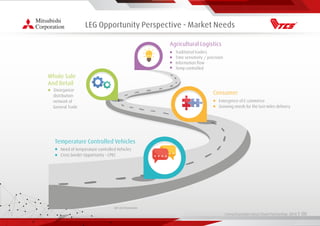
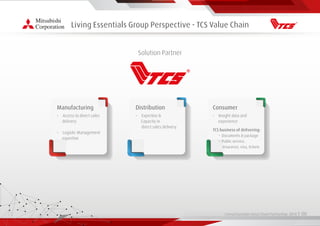
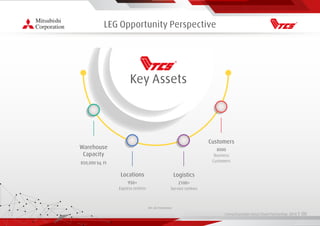
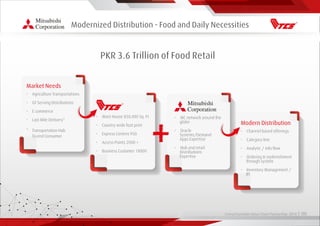
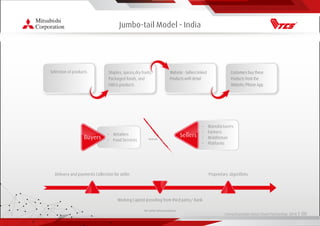
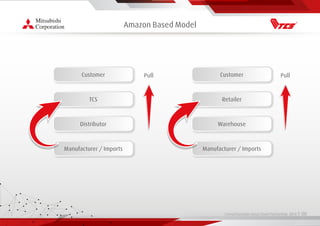
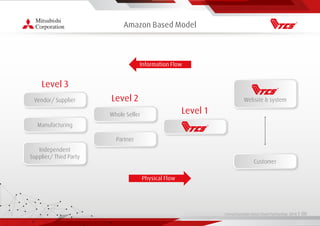
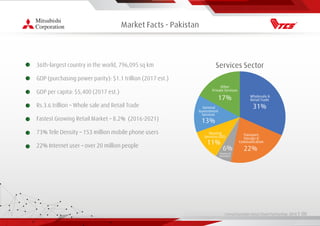
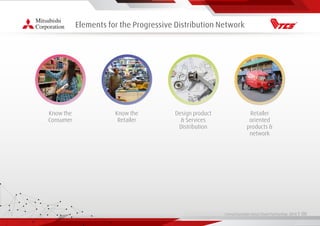
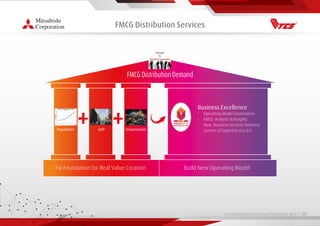

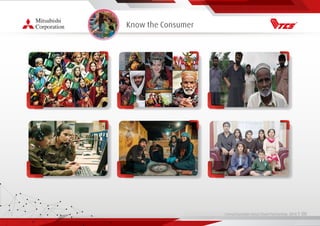
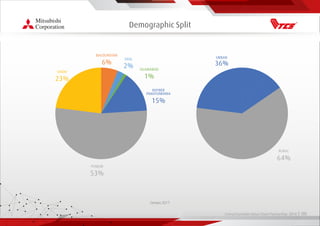
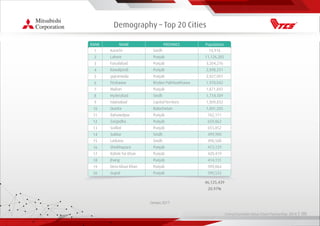
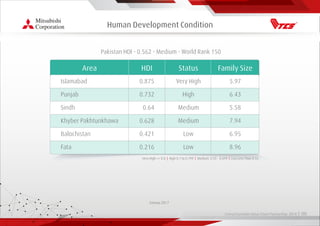
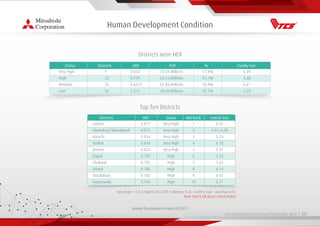
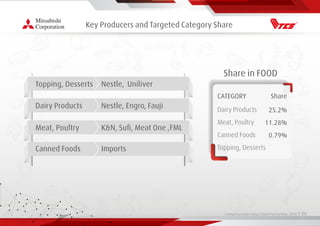
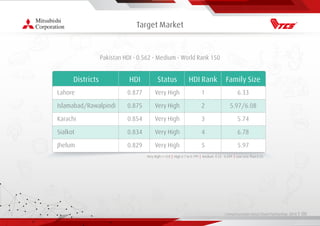
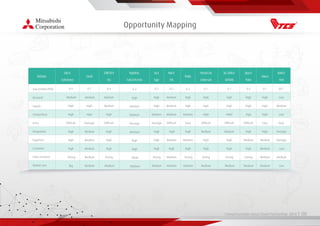
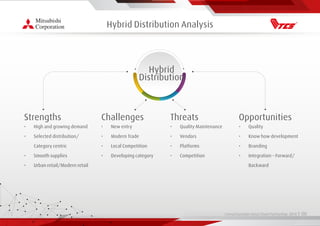
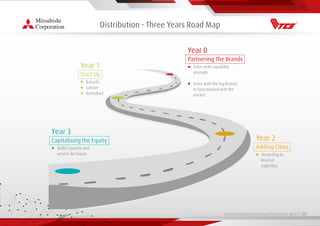
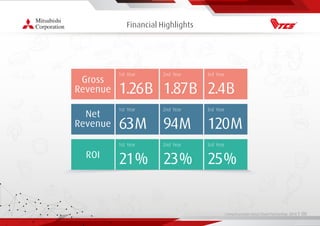
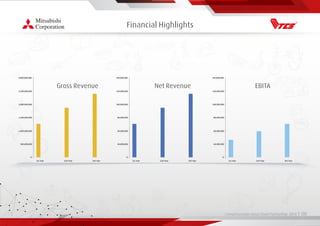

The document provides an overview of a proposed value chain partnership between Living Essentials and Mitsubishi Corporation to develop a modern distribution network for food and daily necessities in Pakistan. It outlines the objectives to build a retailer-centric product line and analytics-enabled distribution system. It also reviews opportunities in the Pakistani market landscape, consumer demographics, and potential distribution and retail models to pursue.


