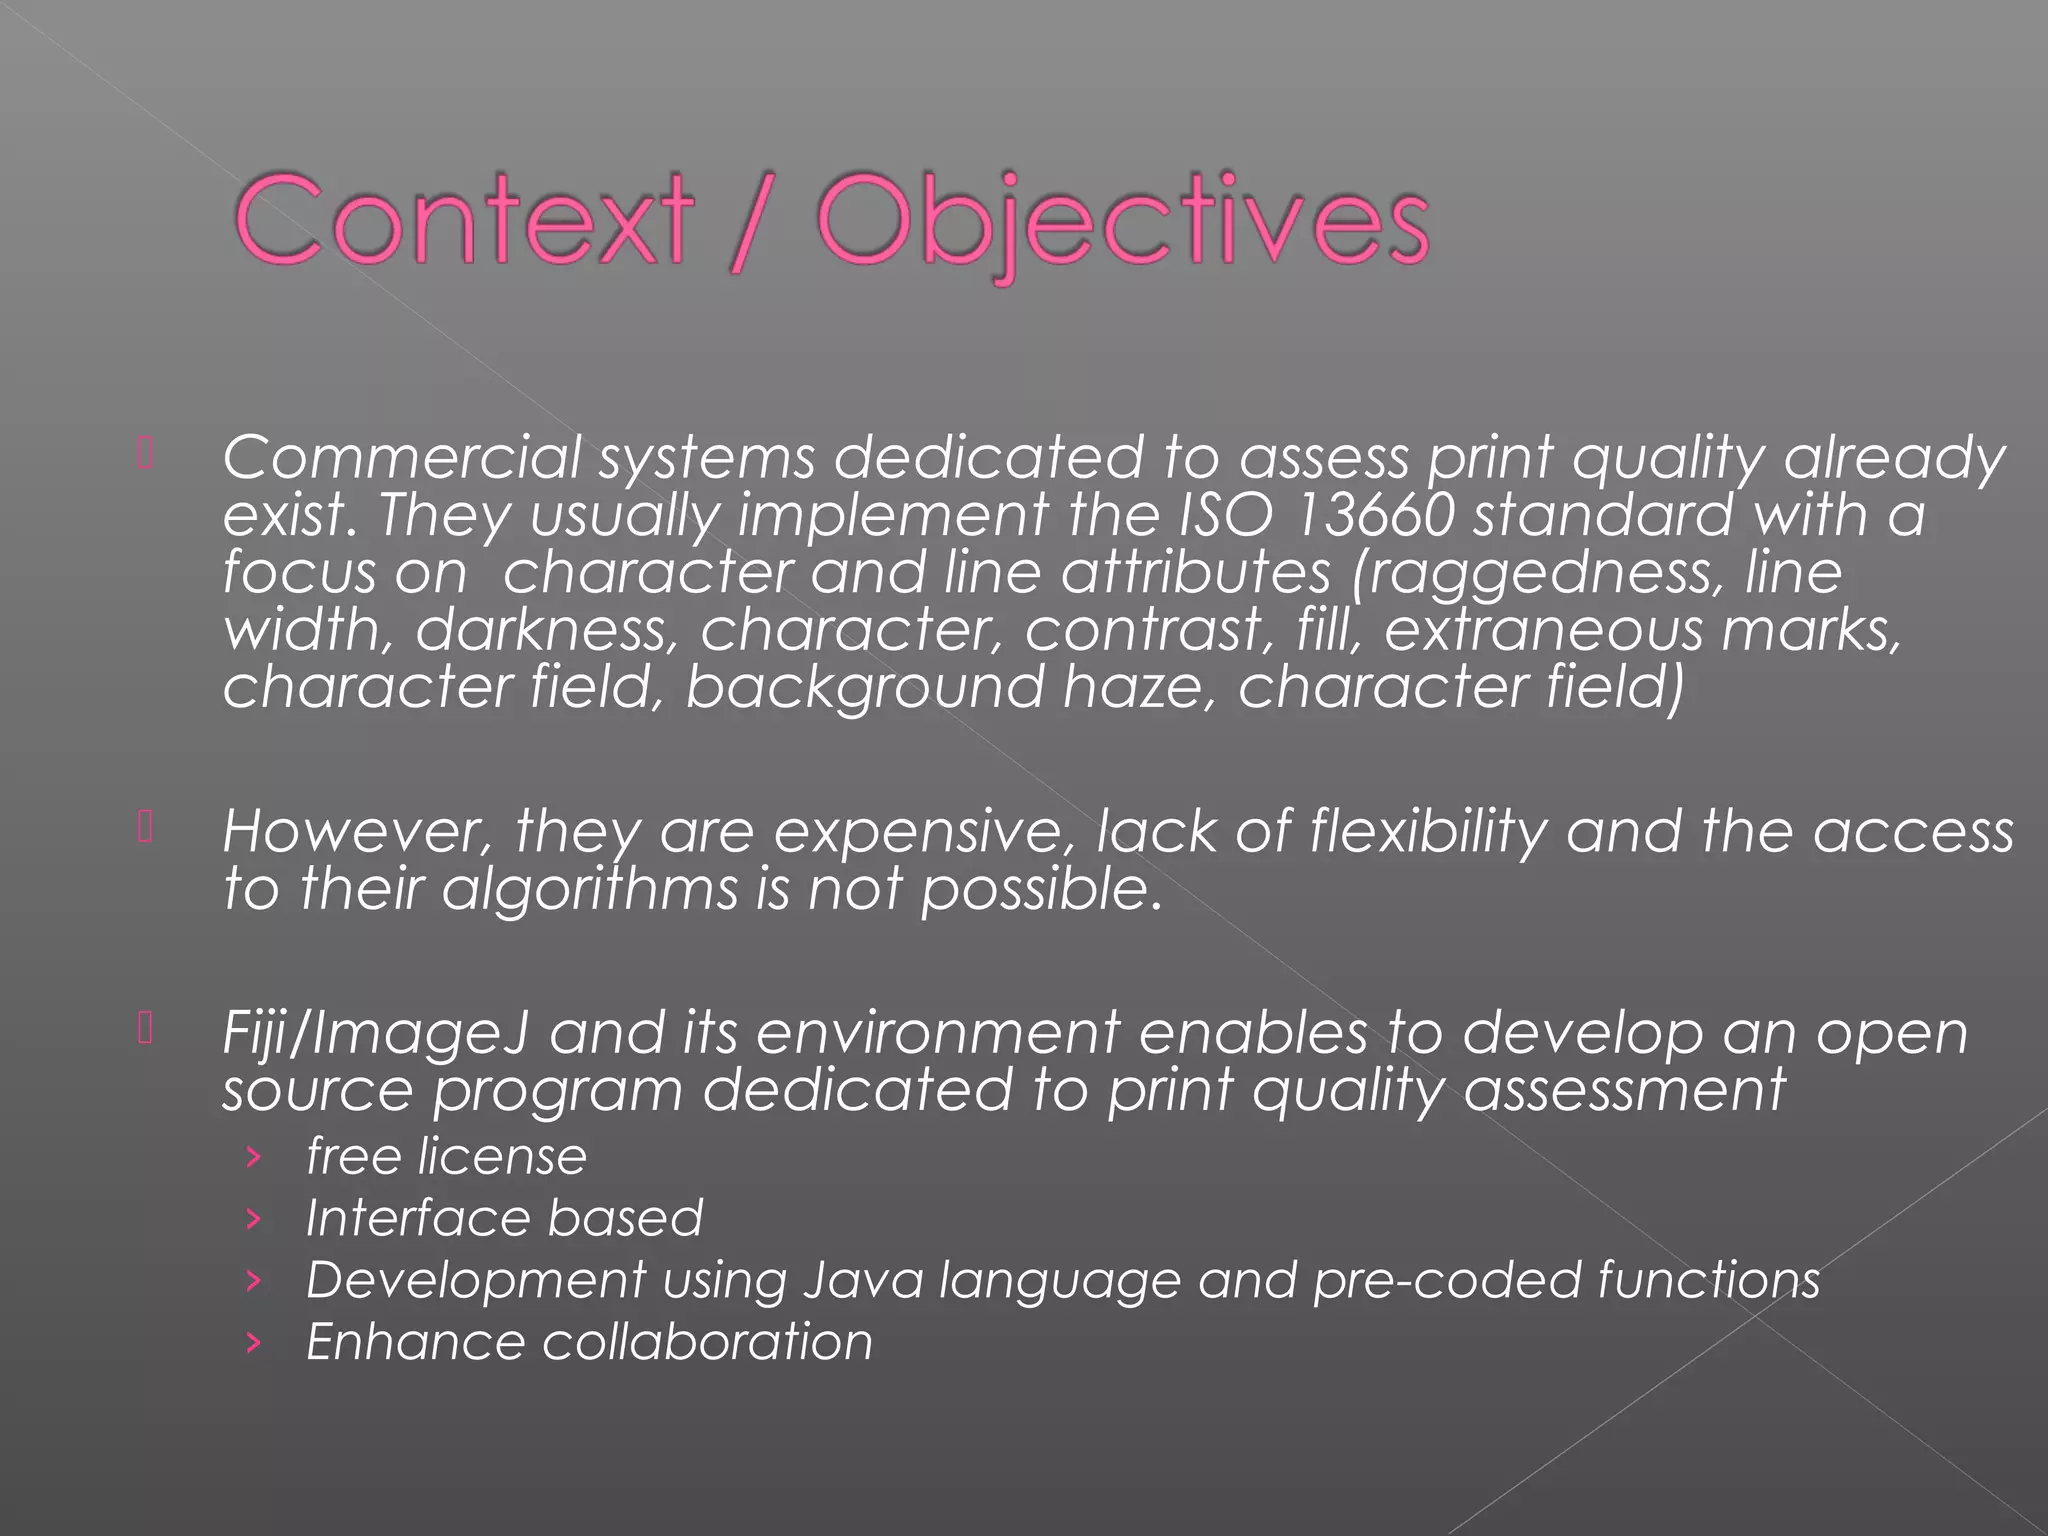
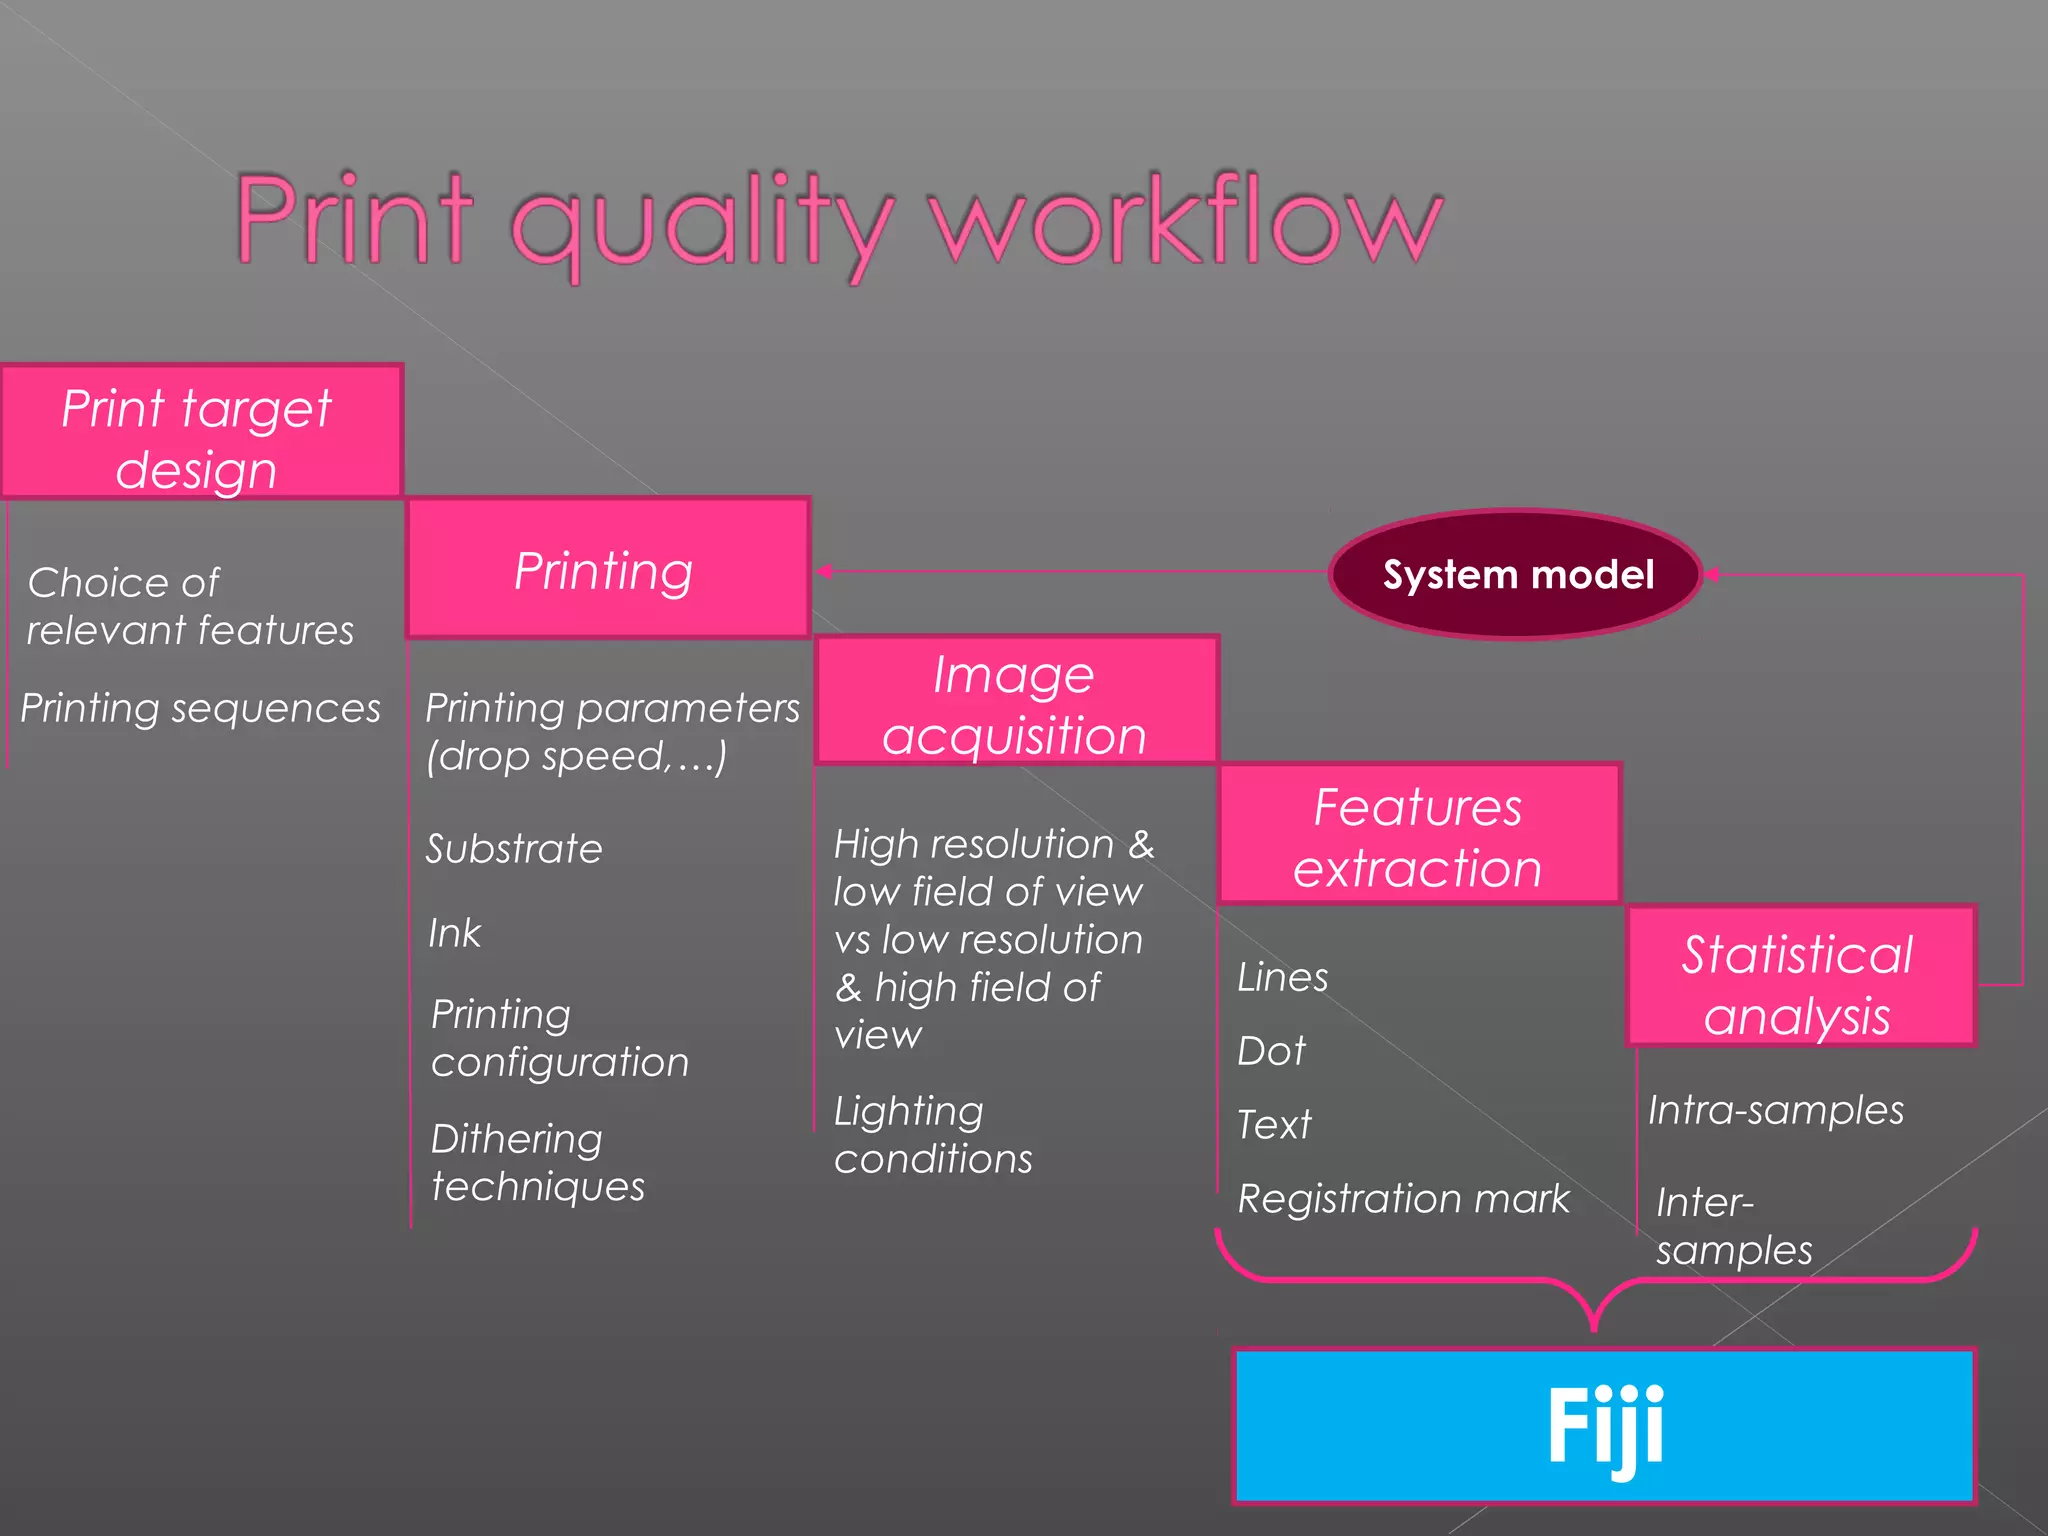
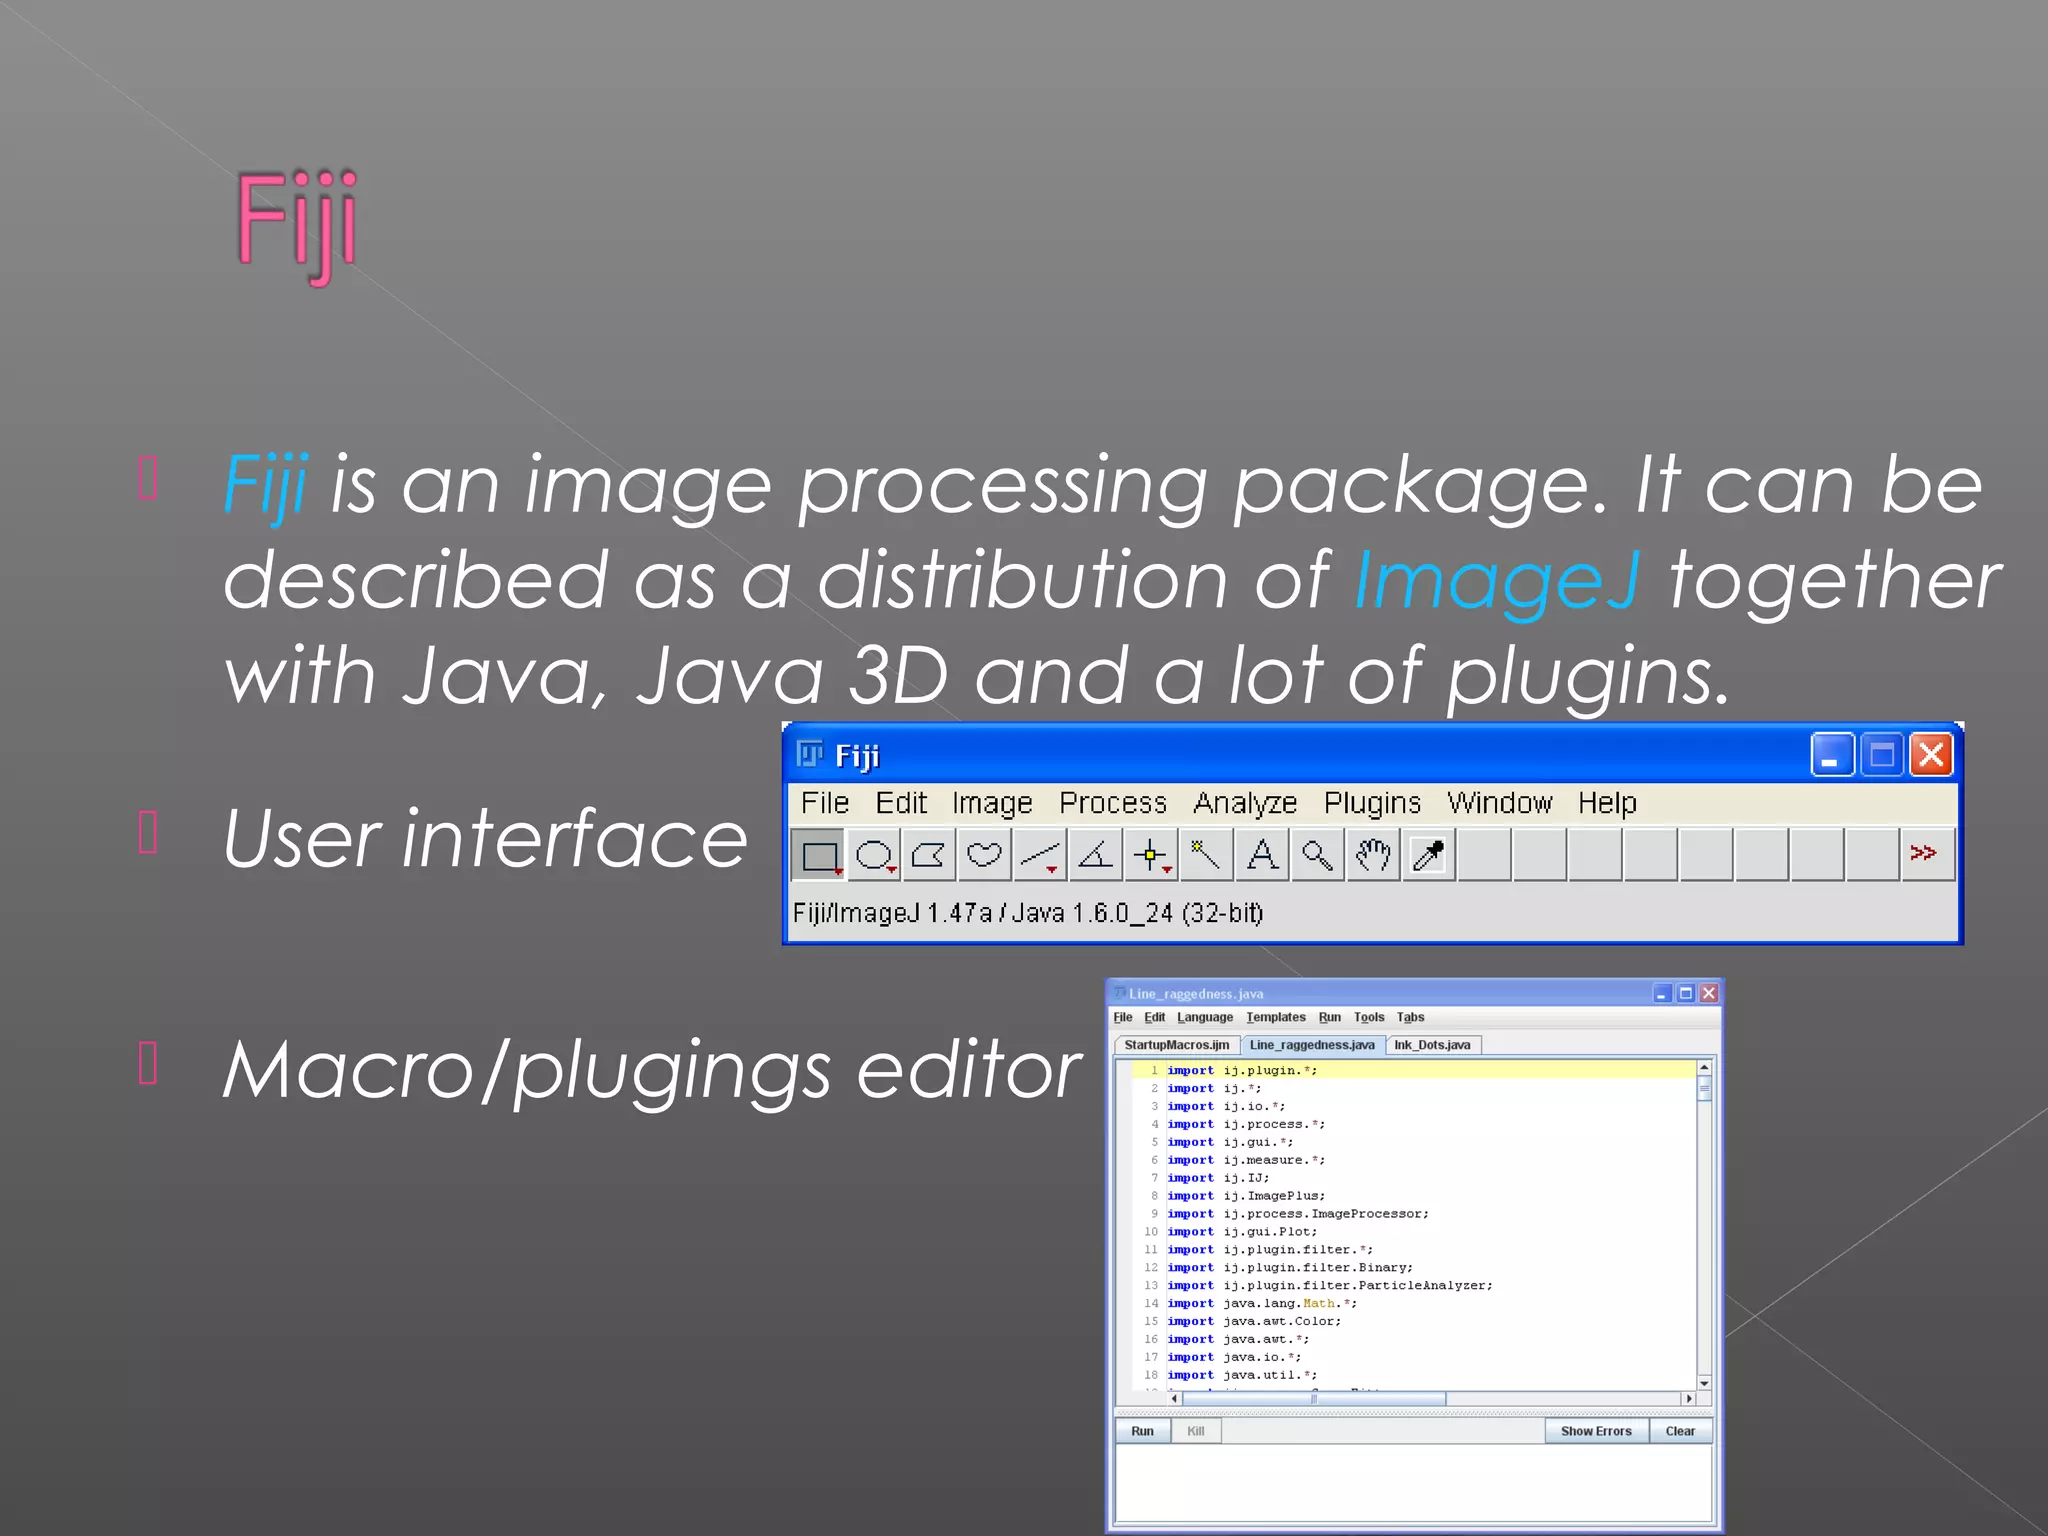
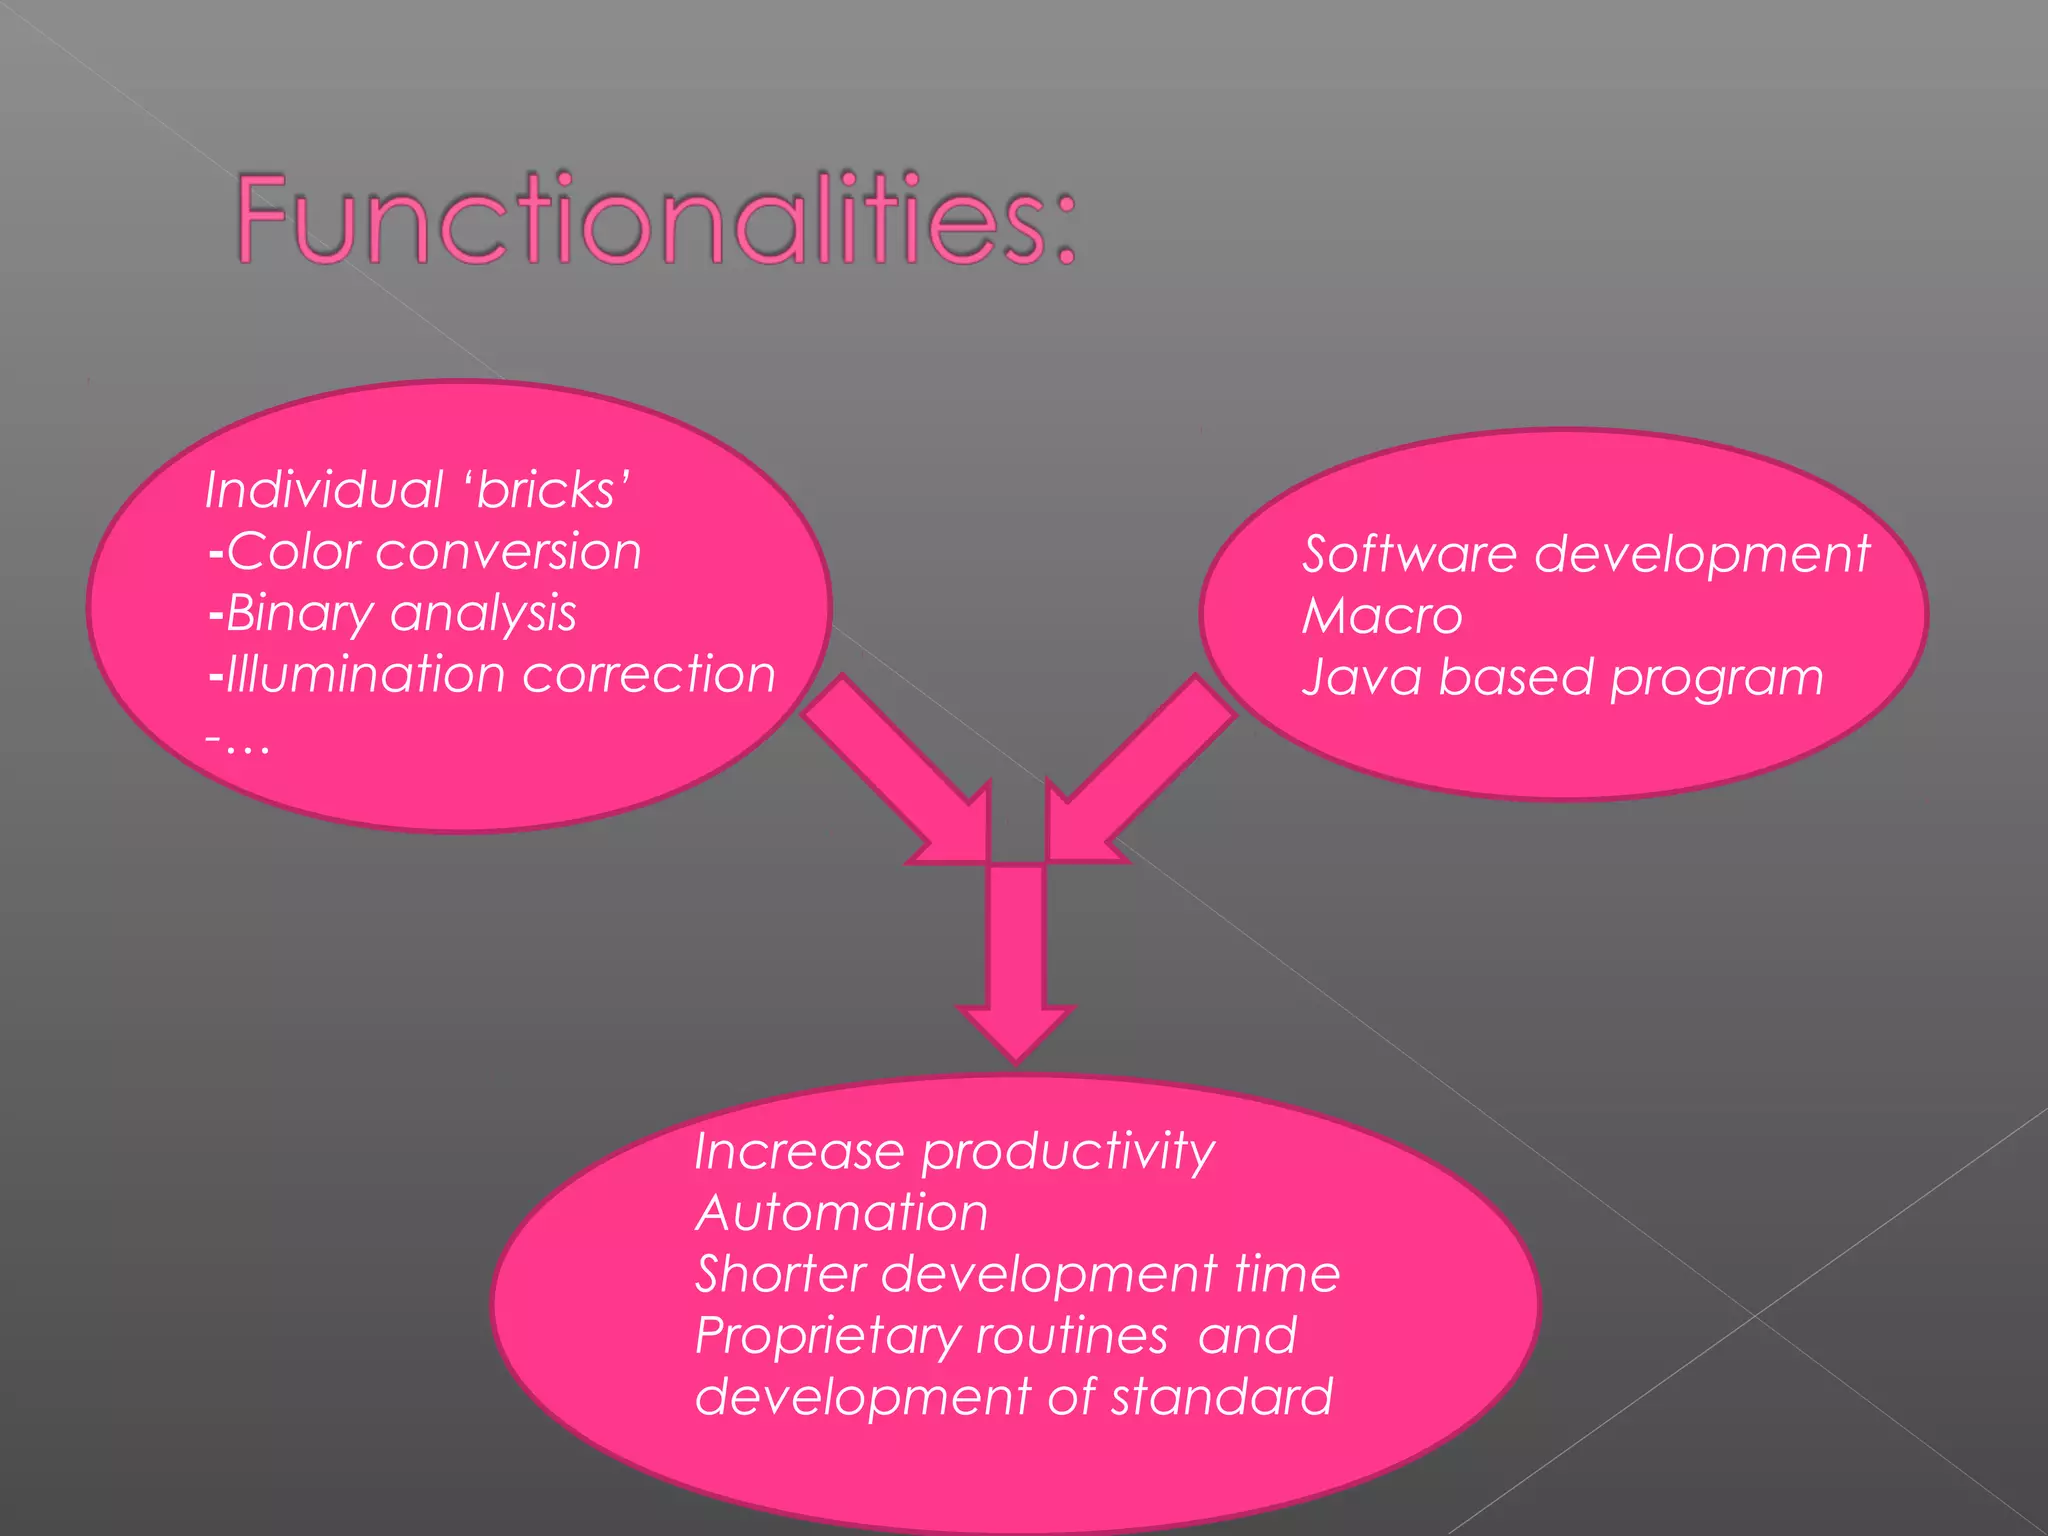
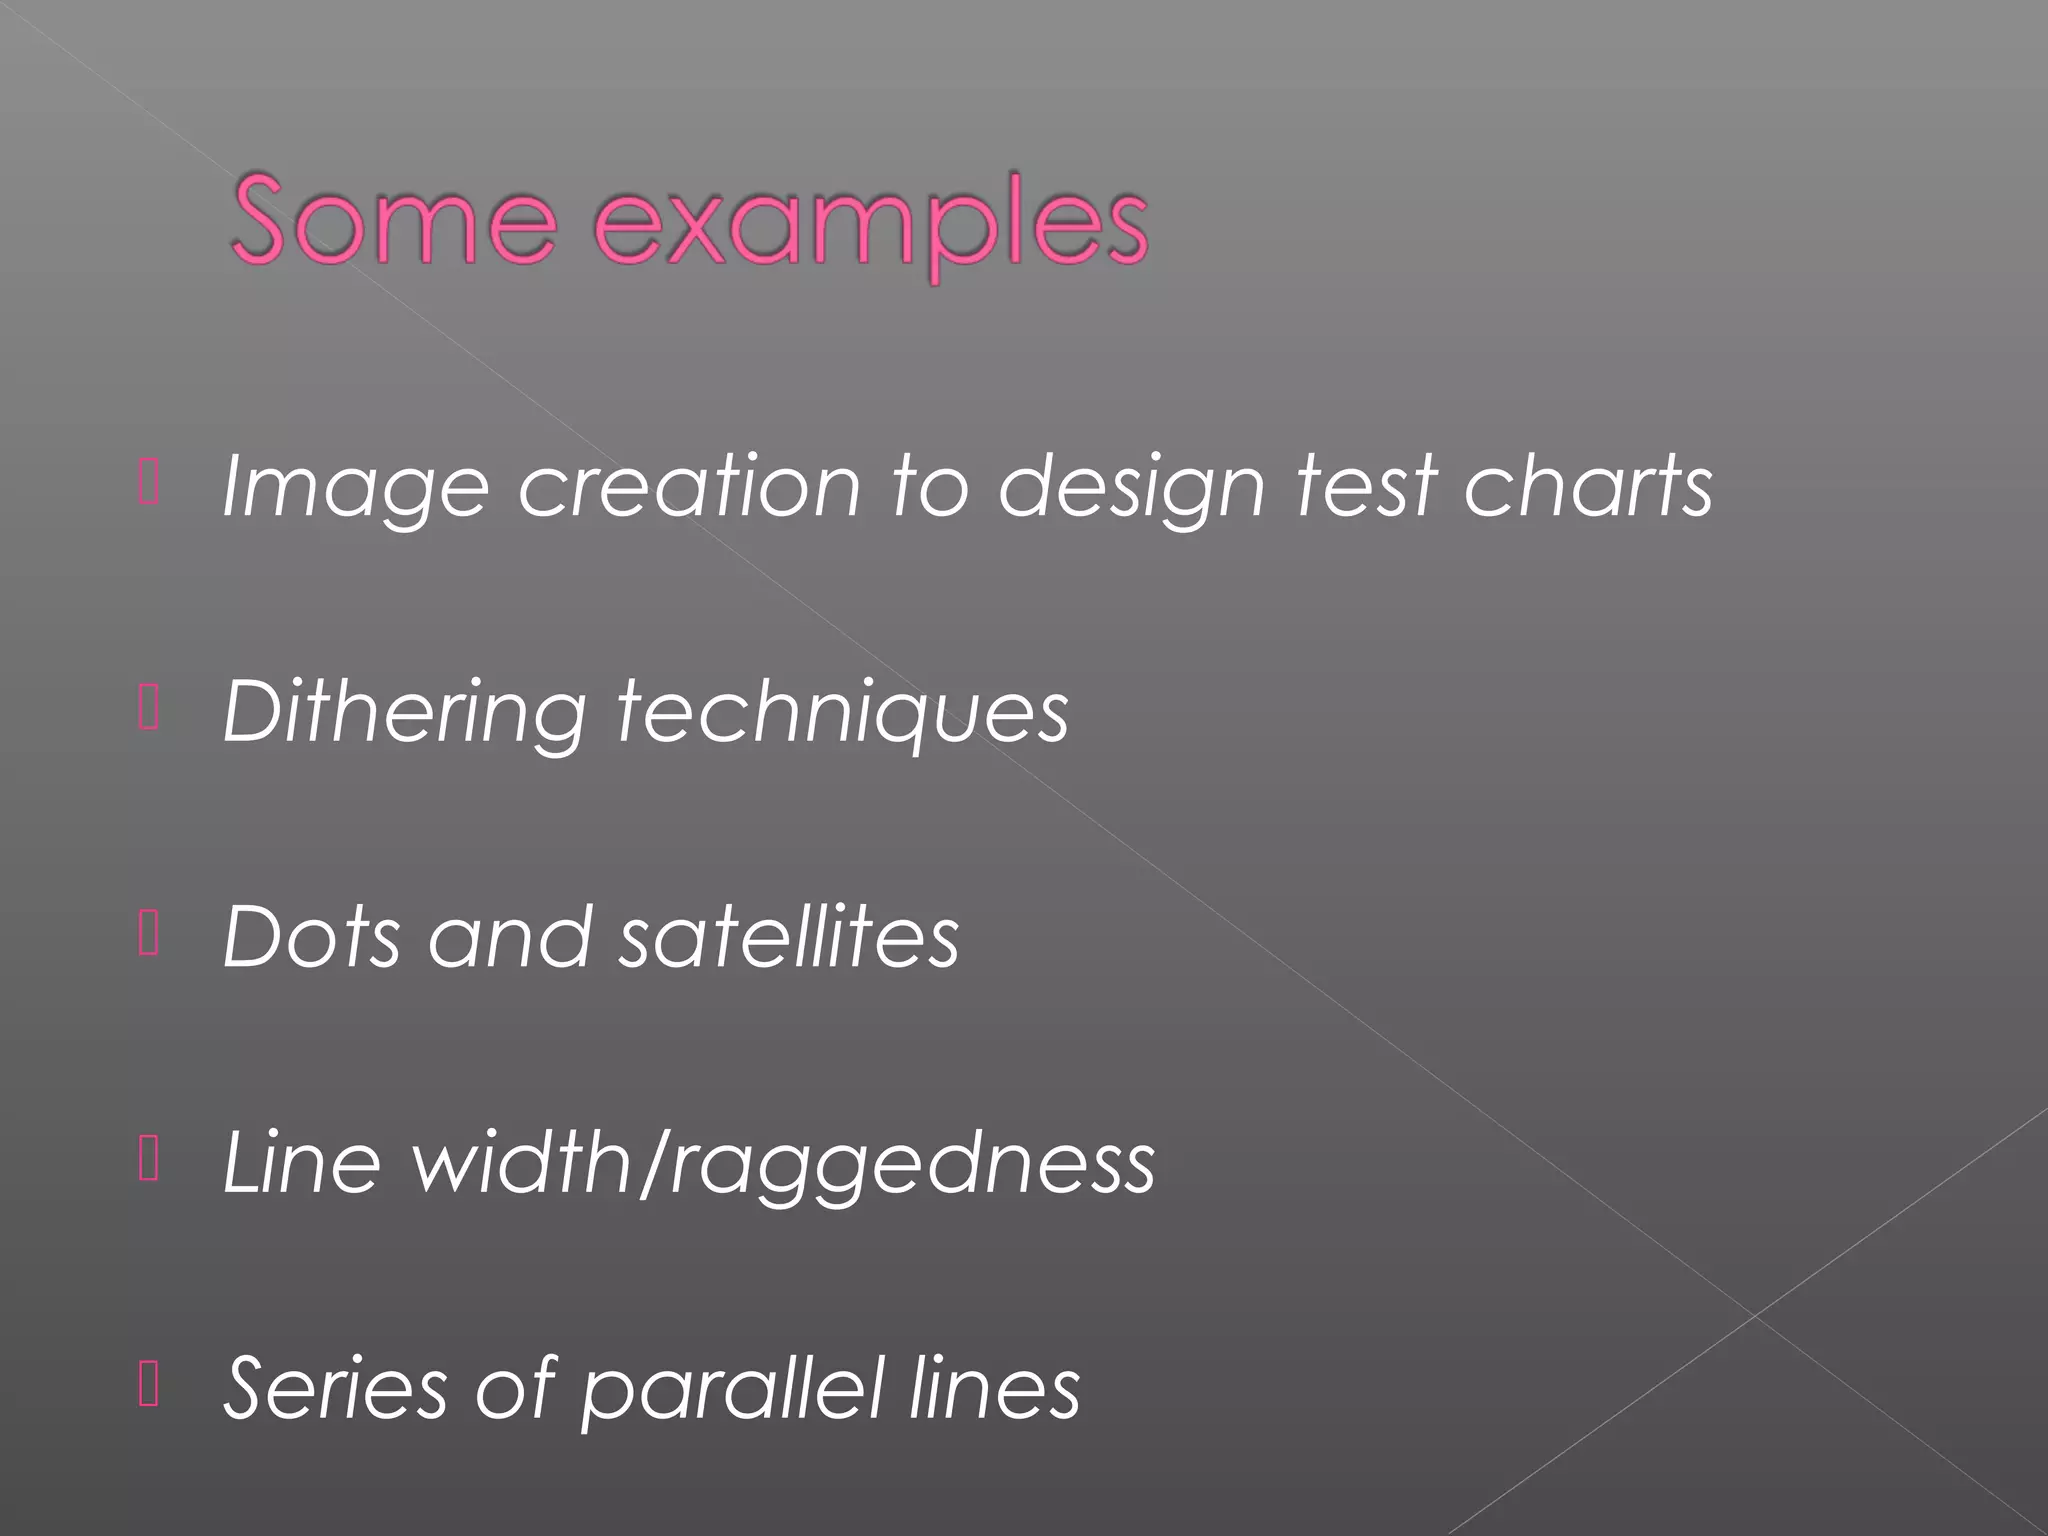
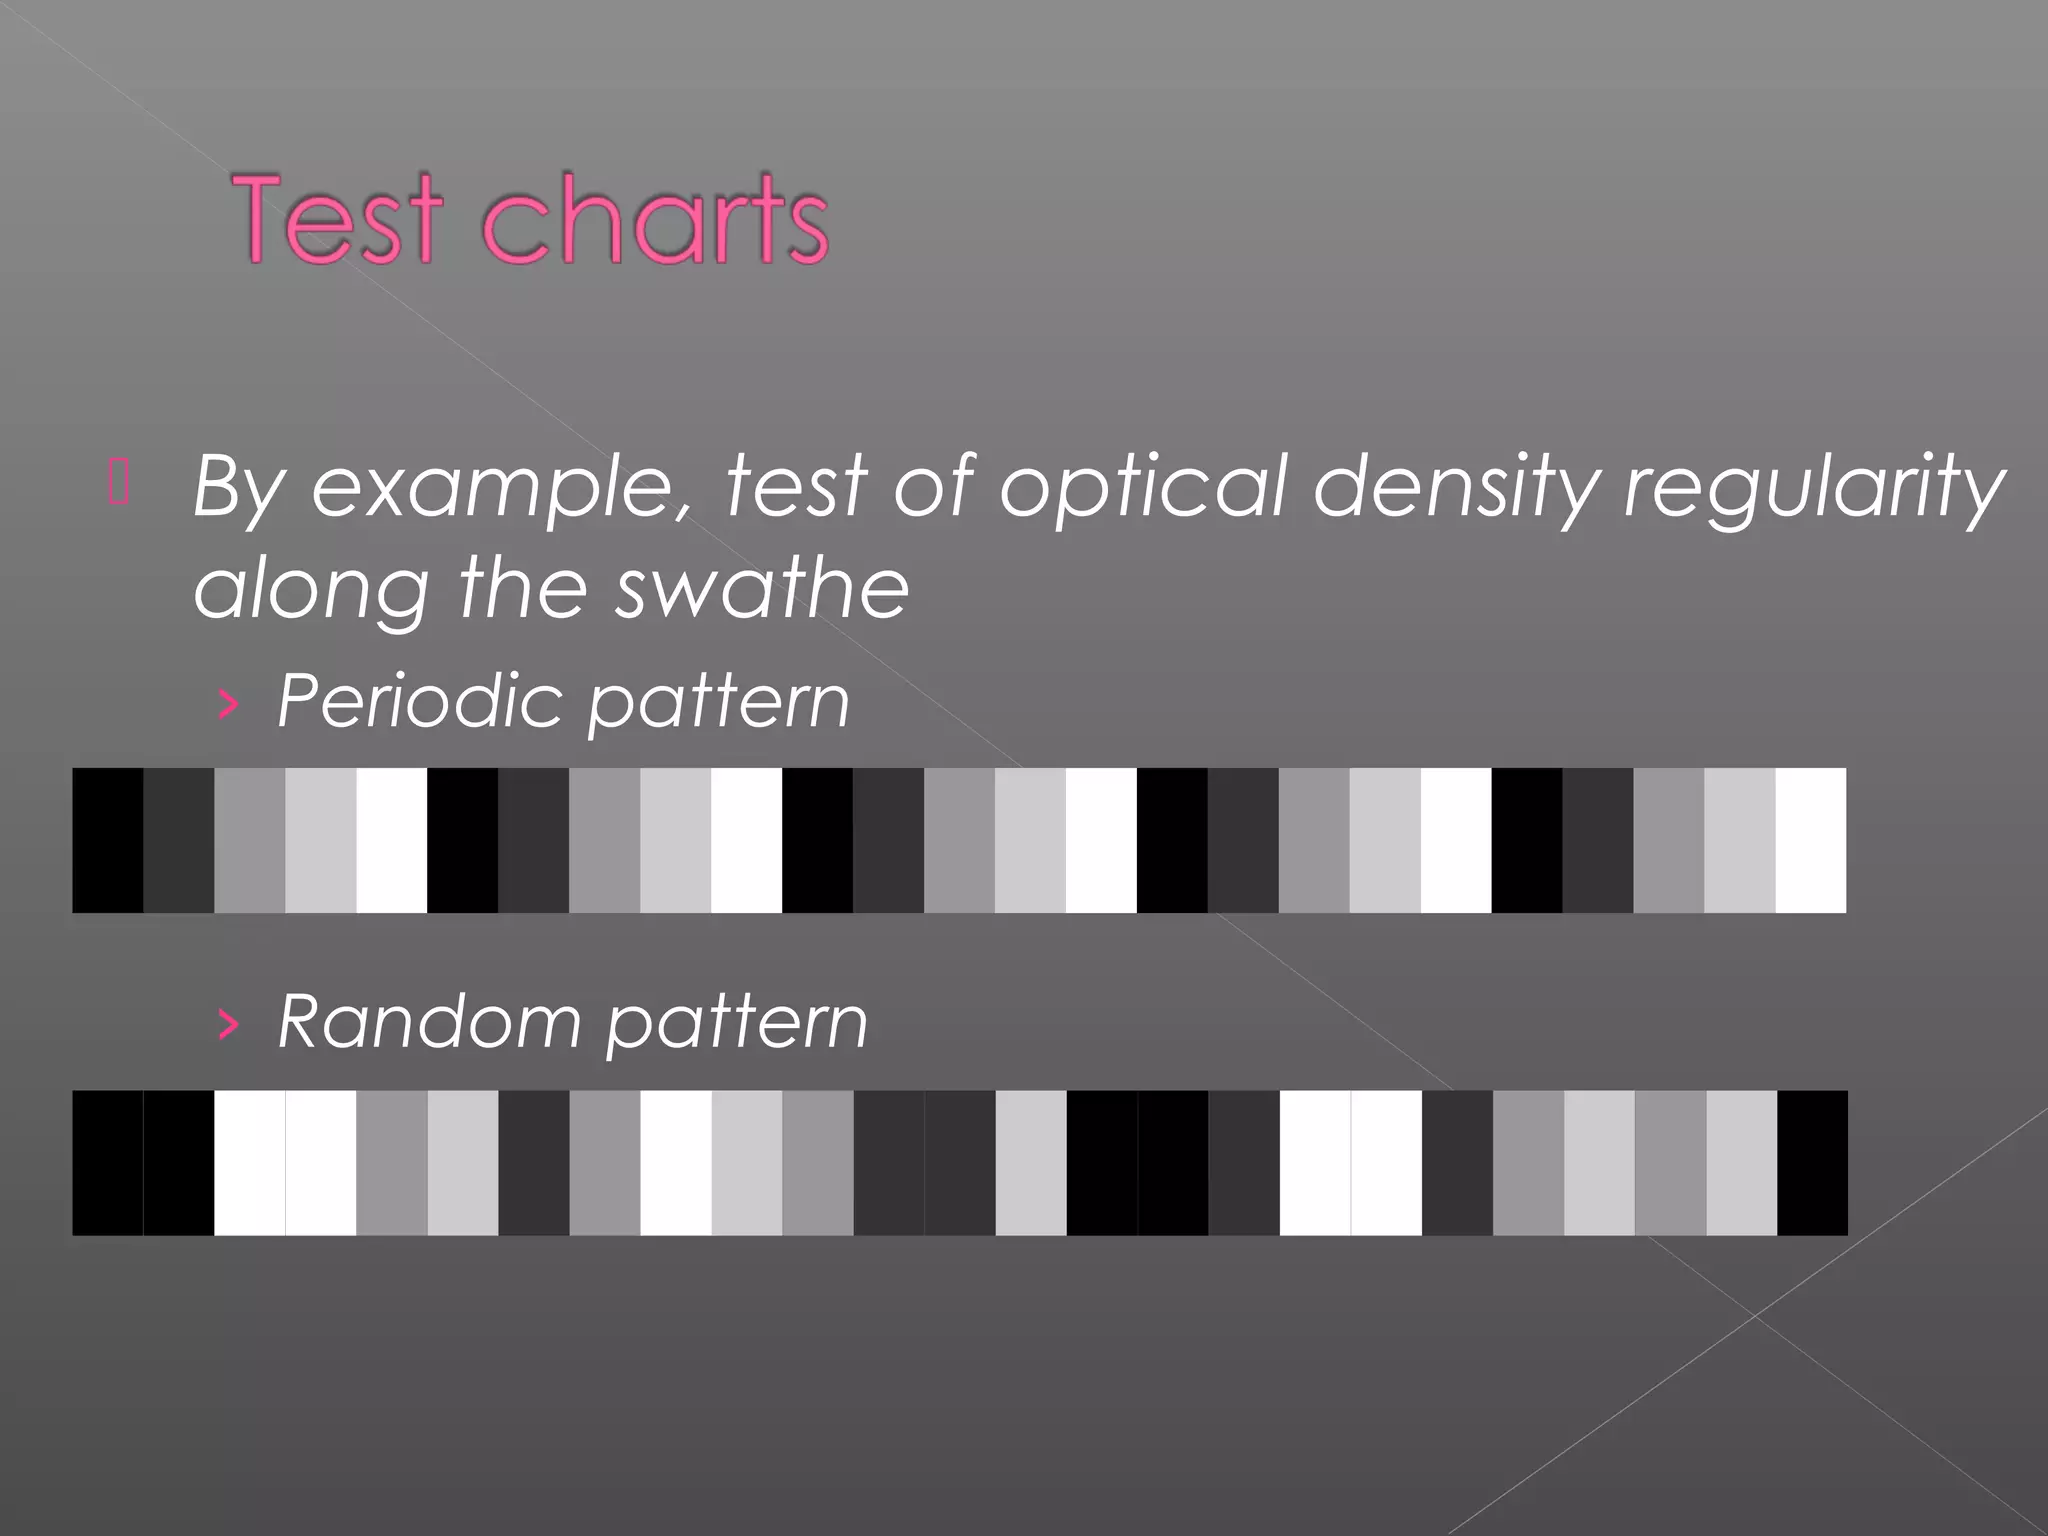
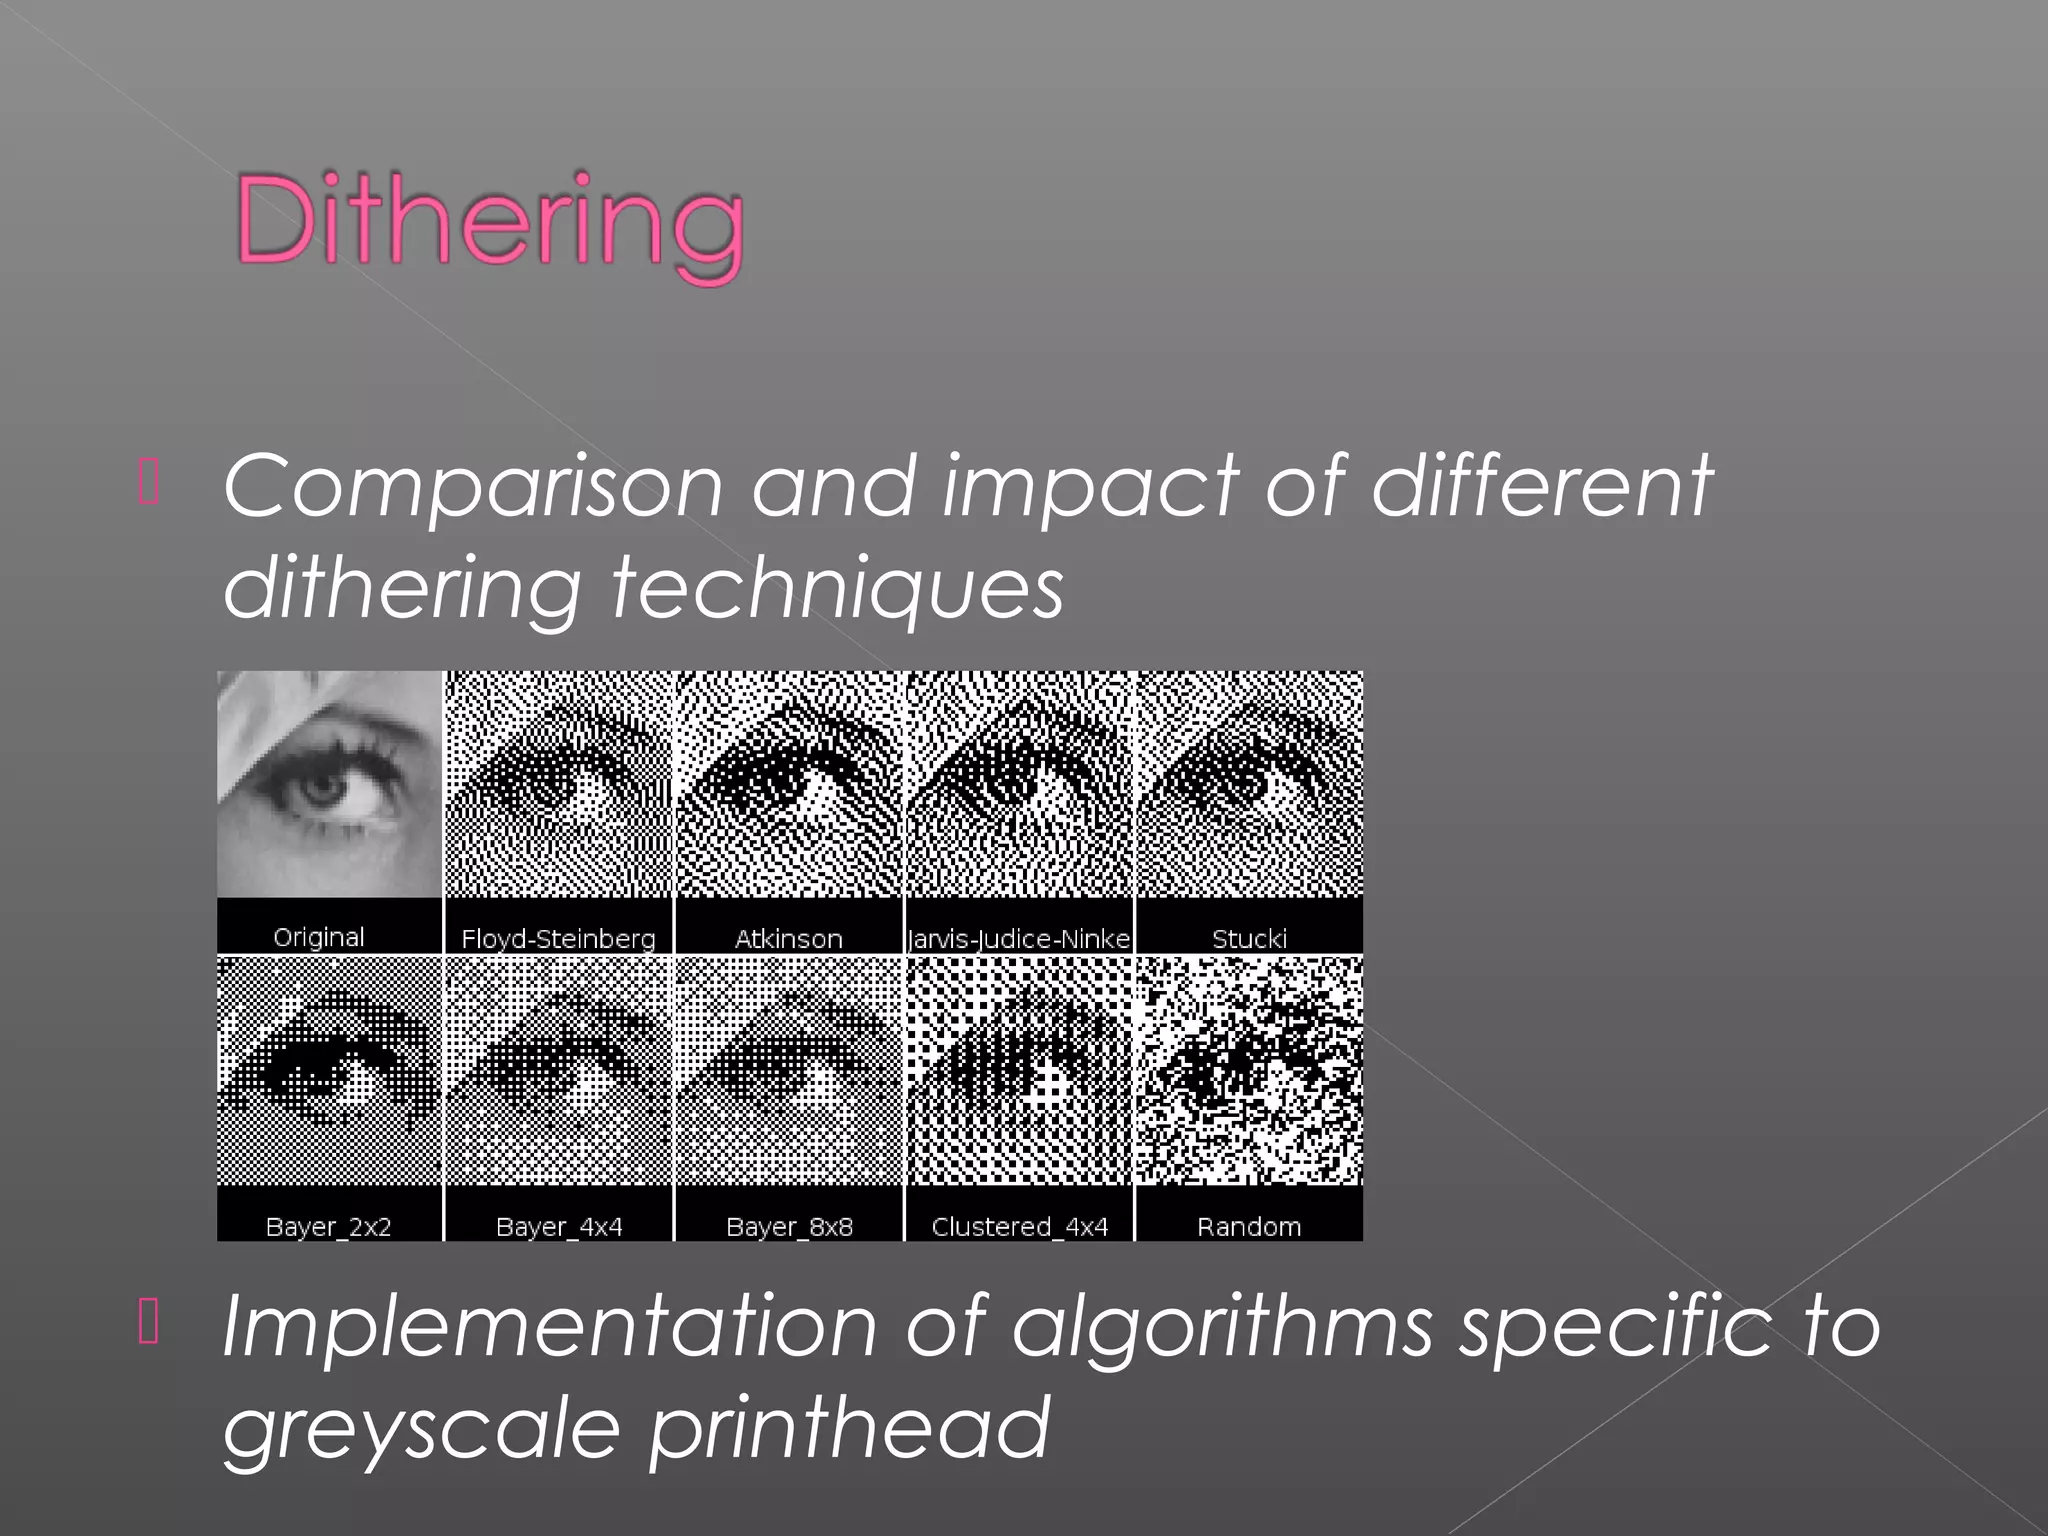
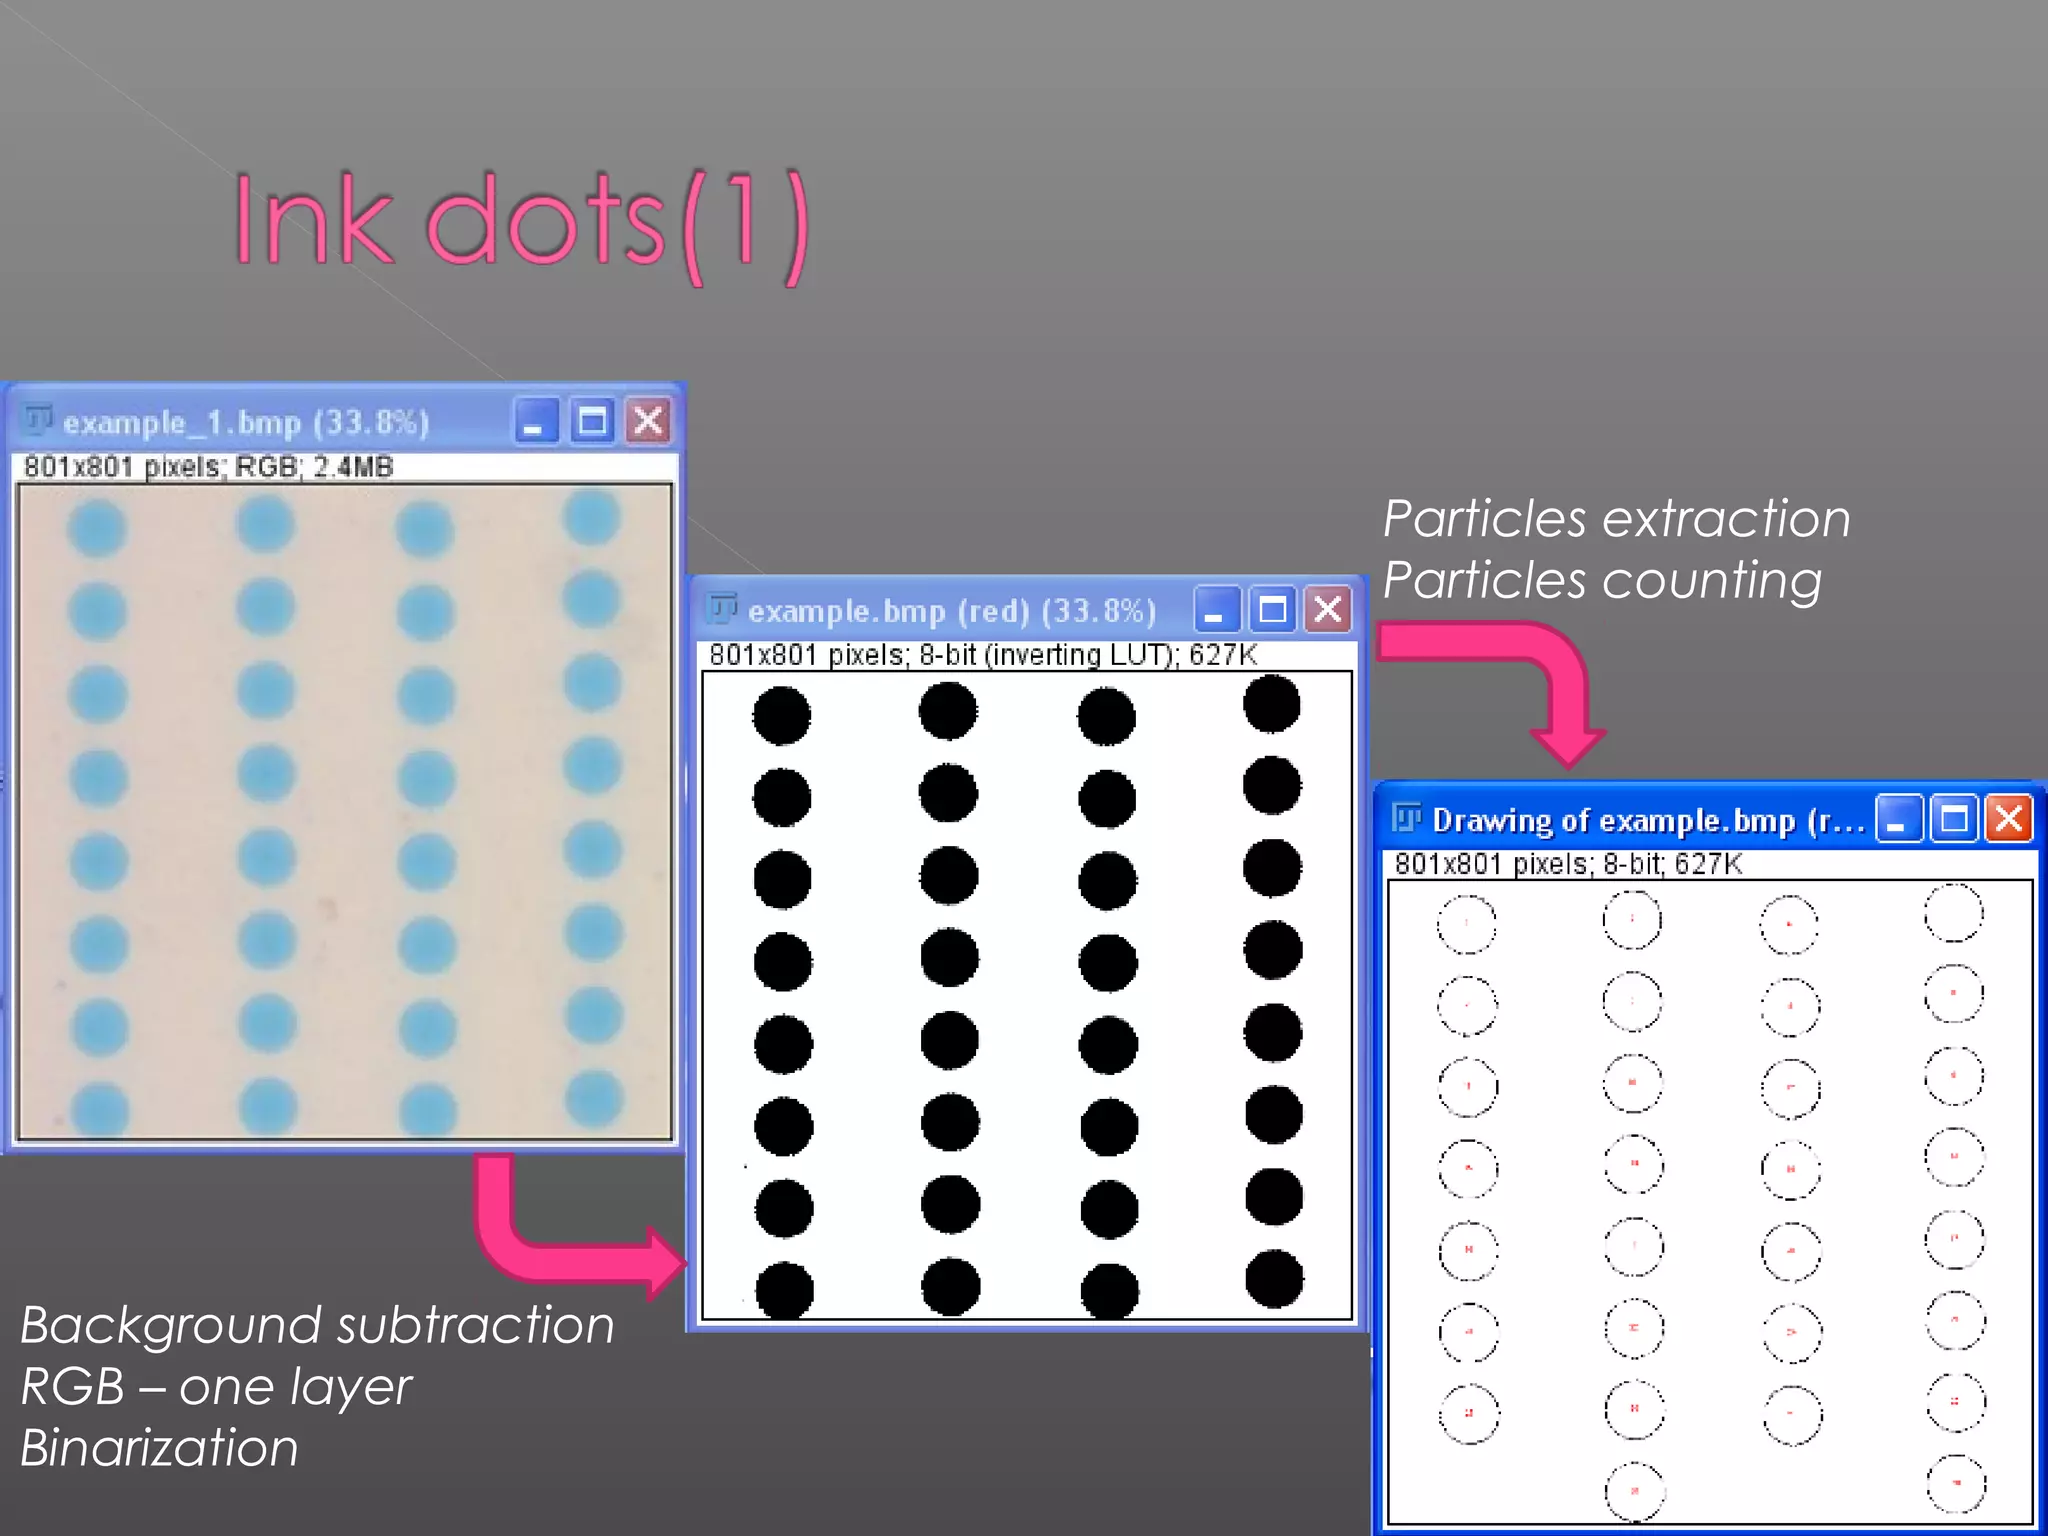
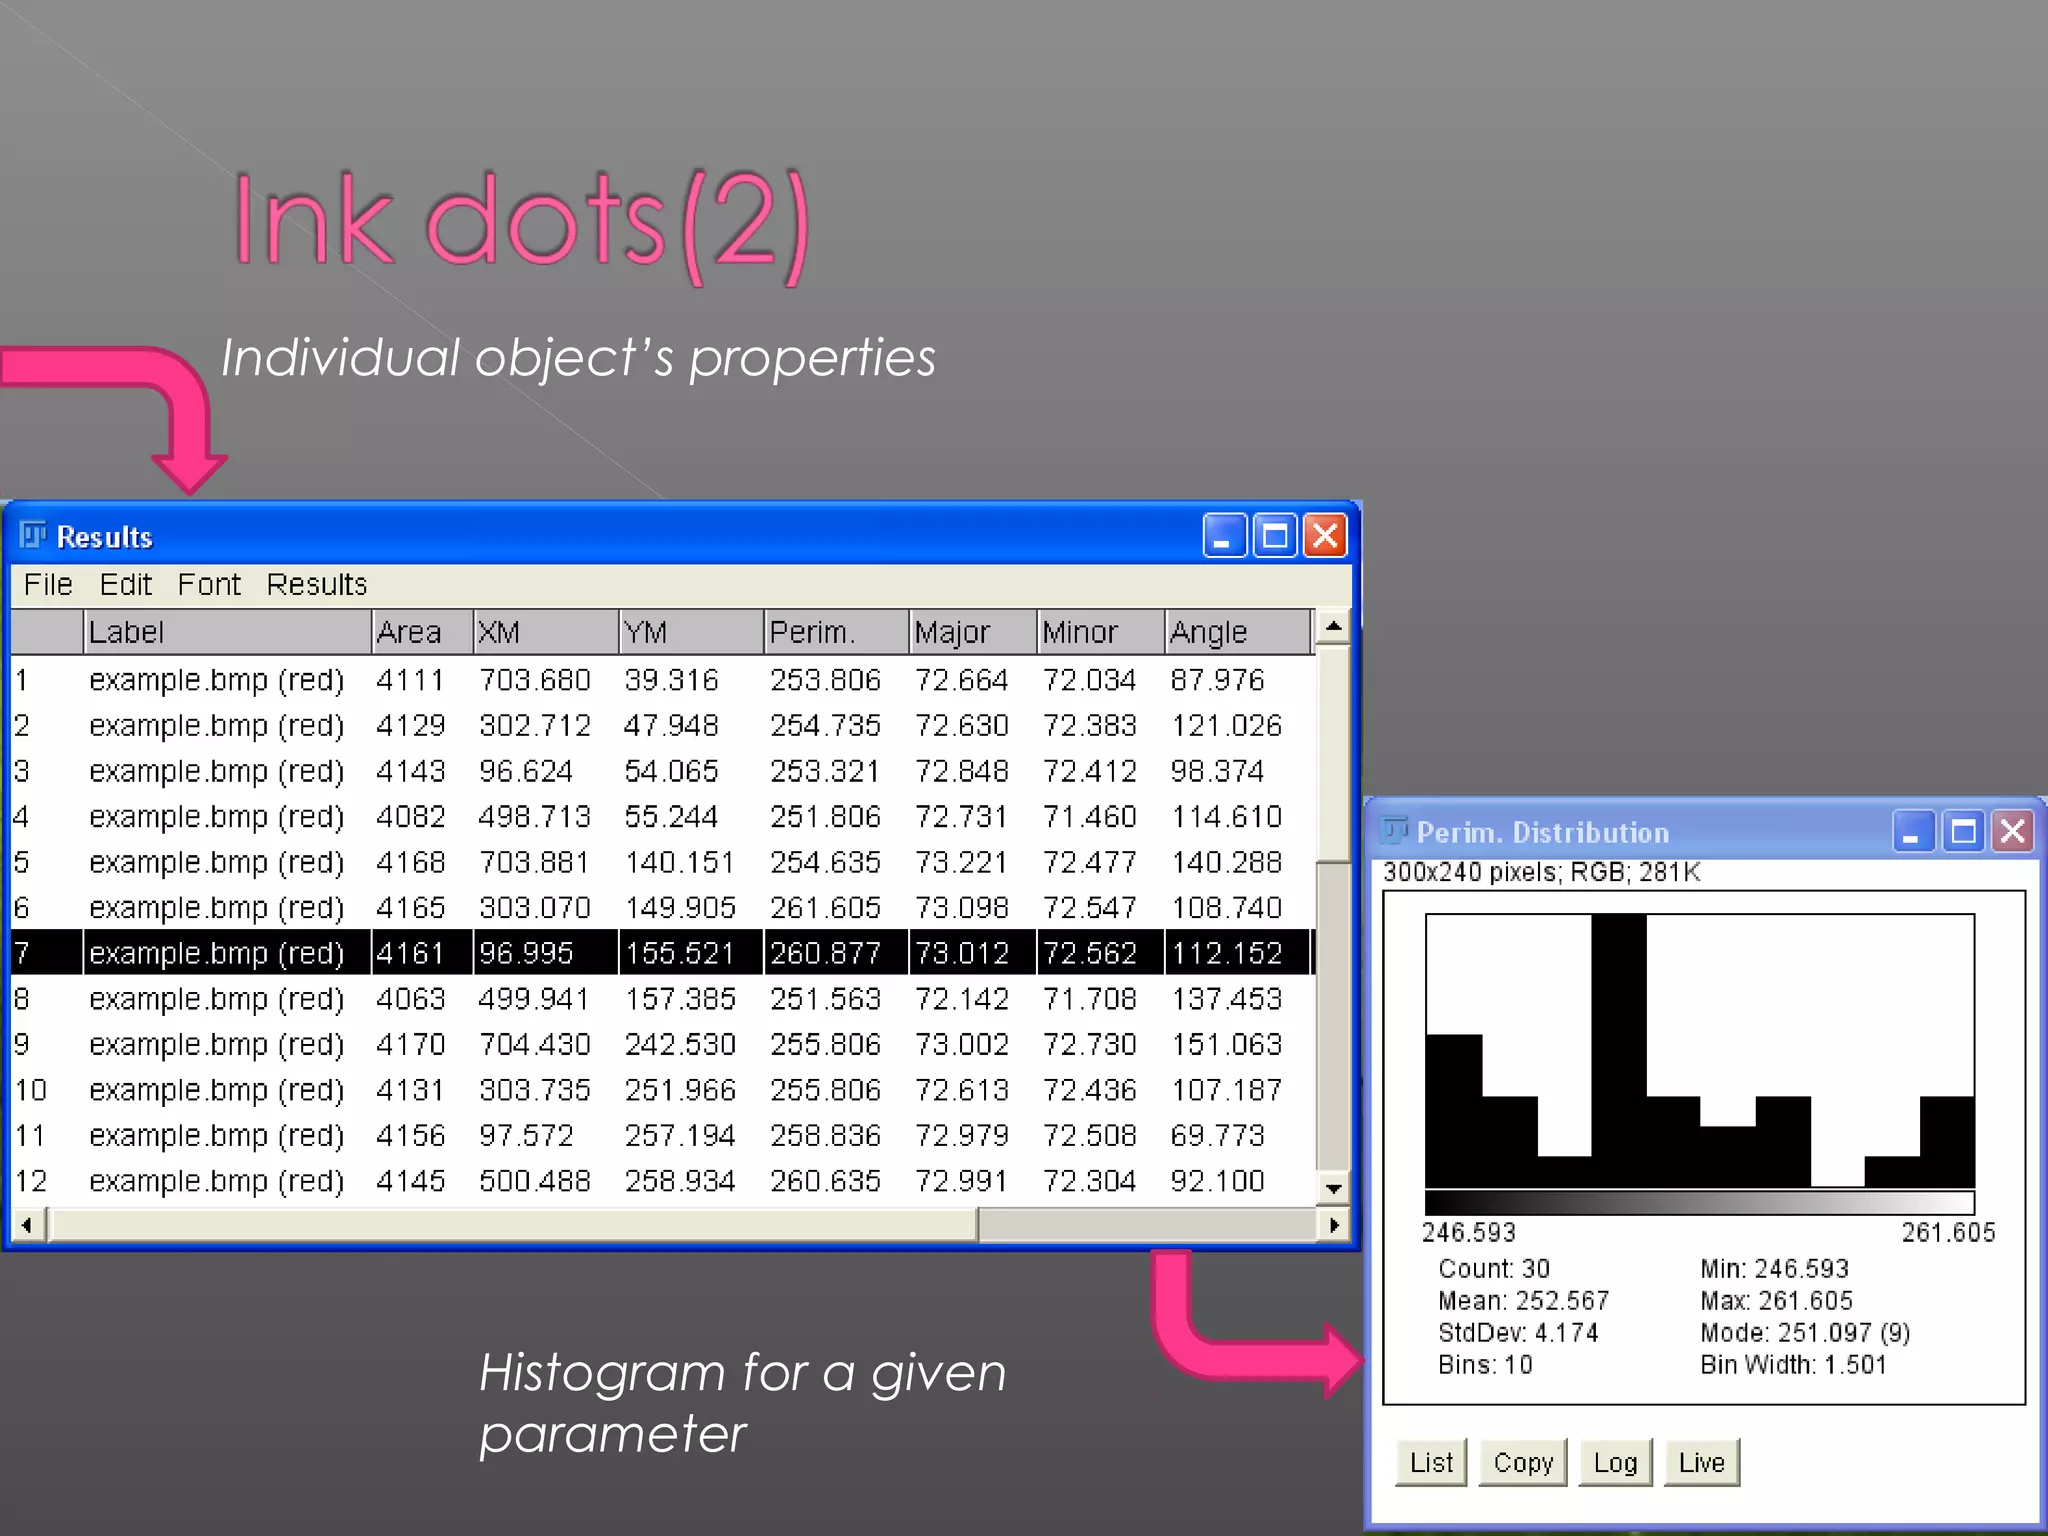
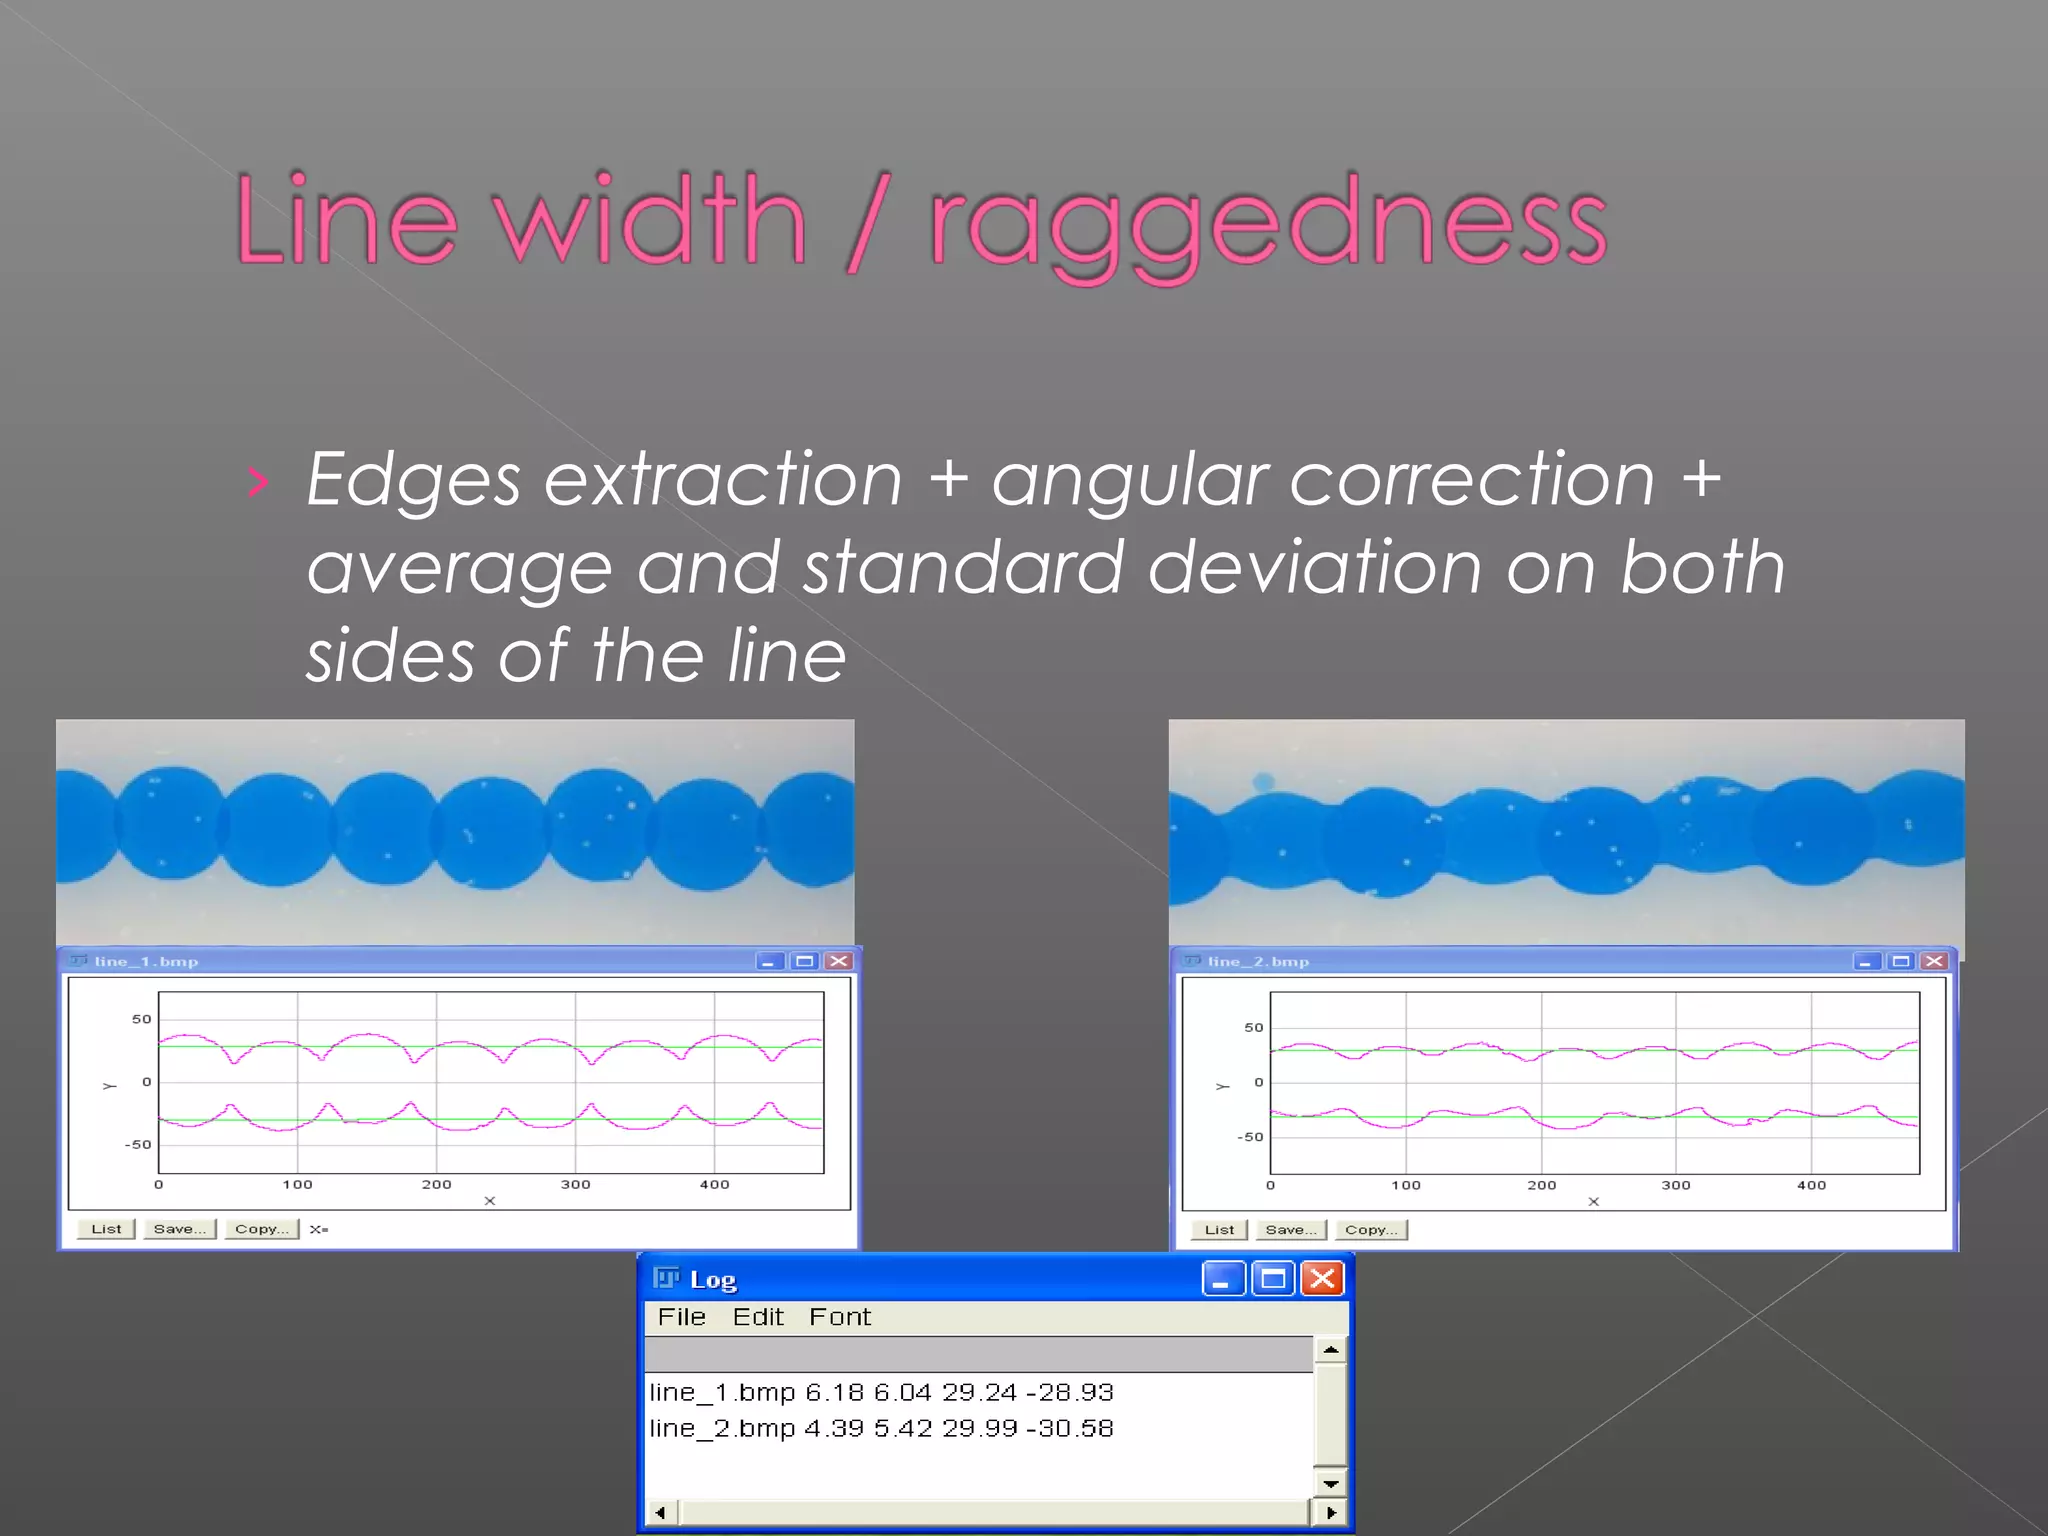
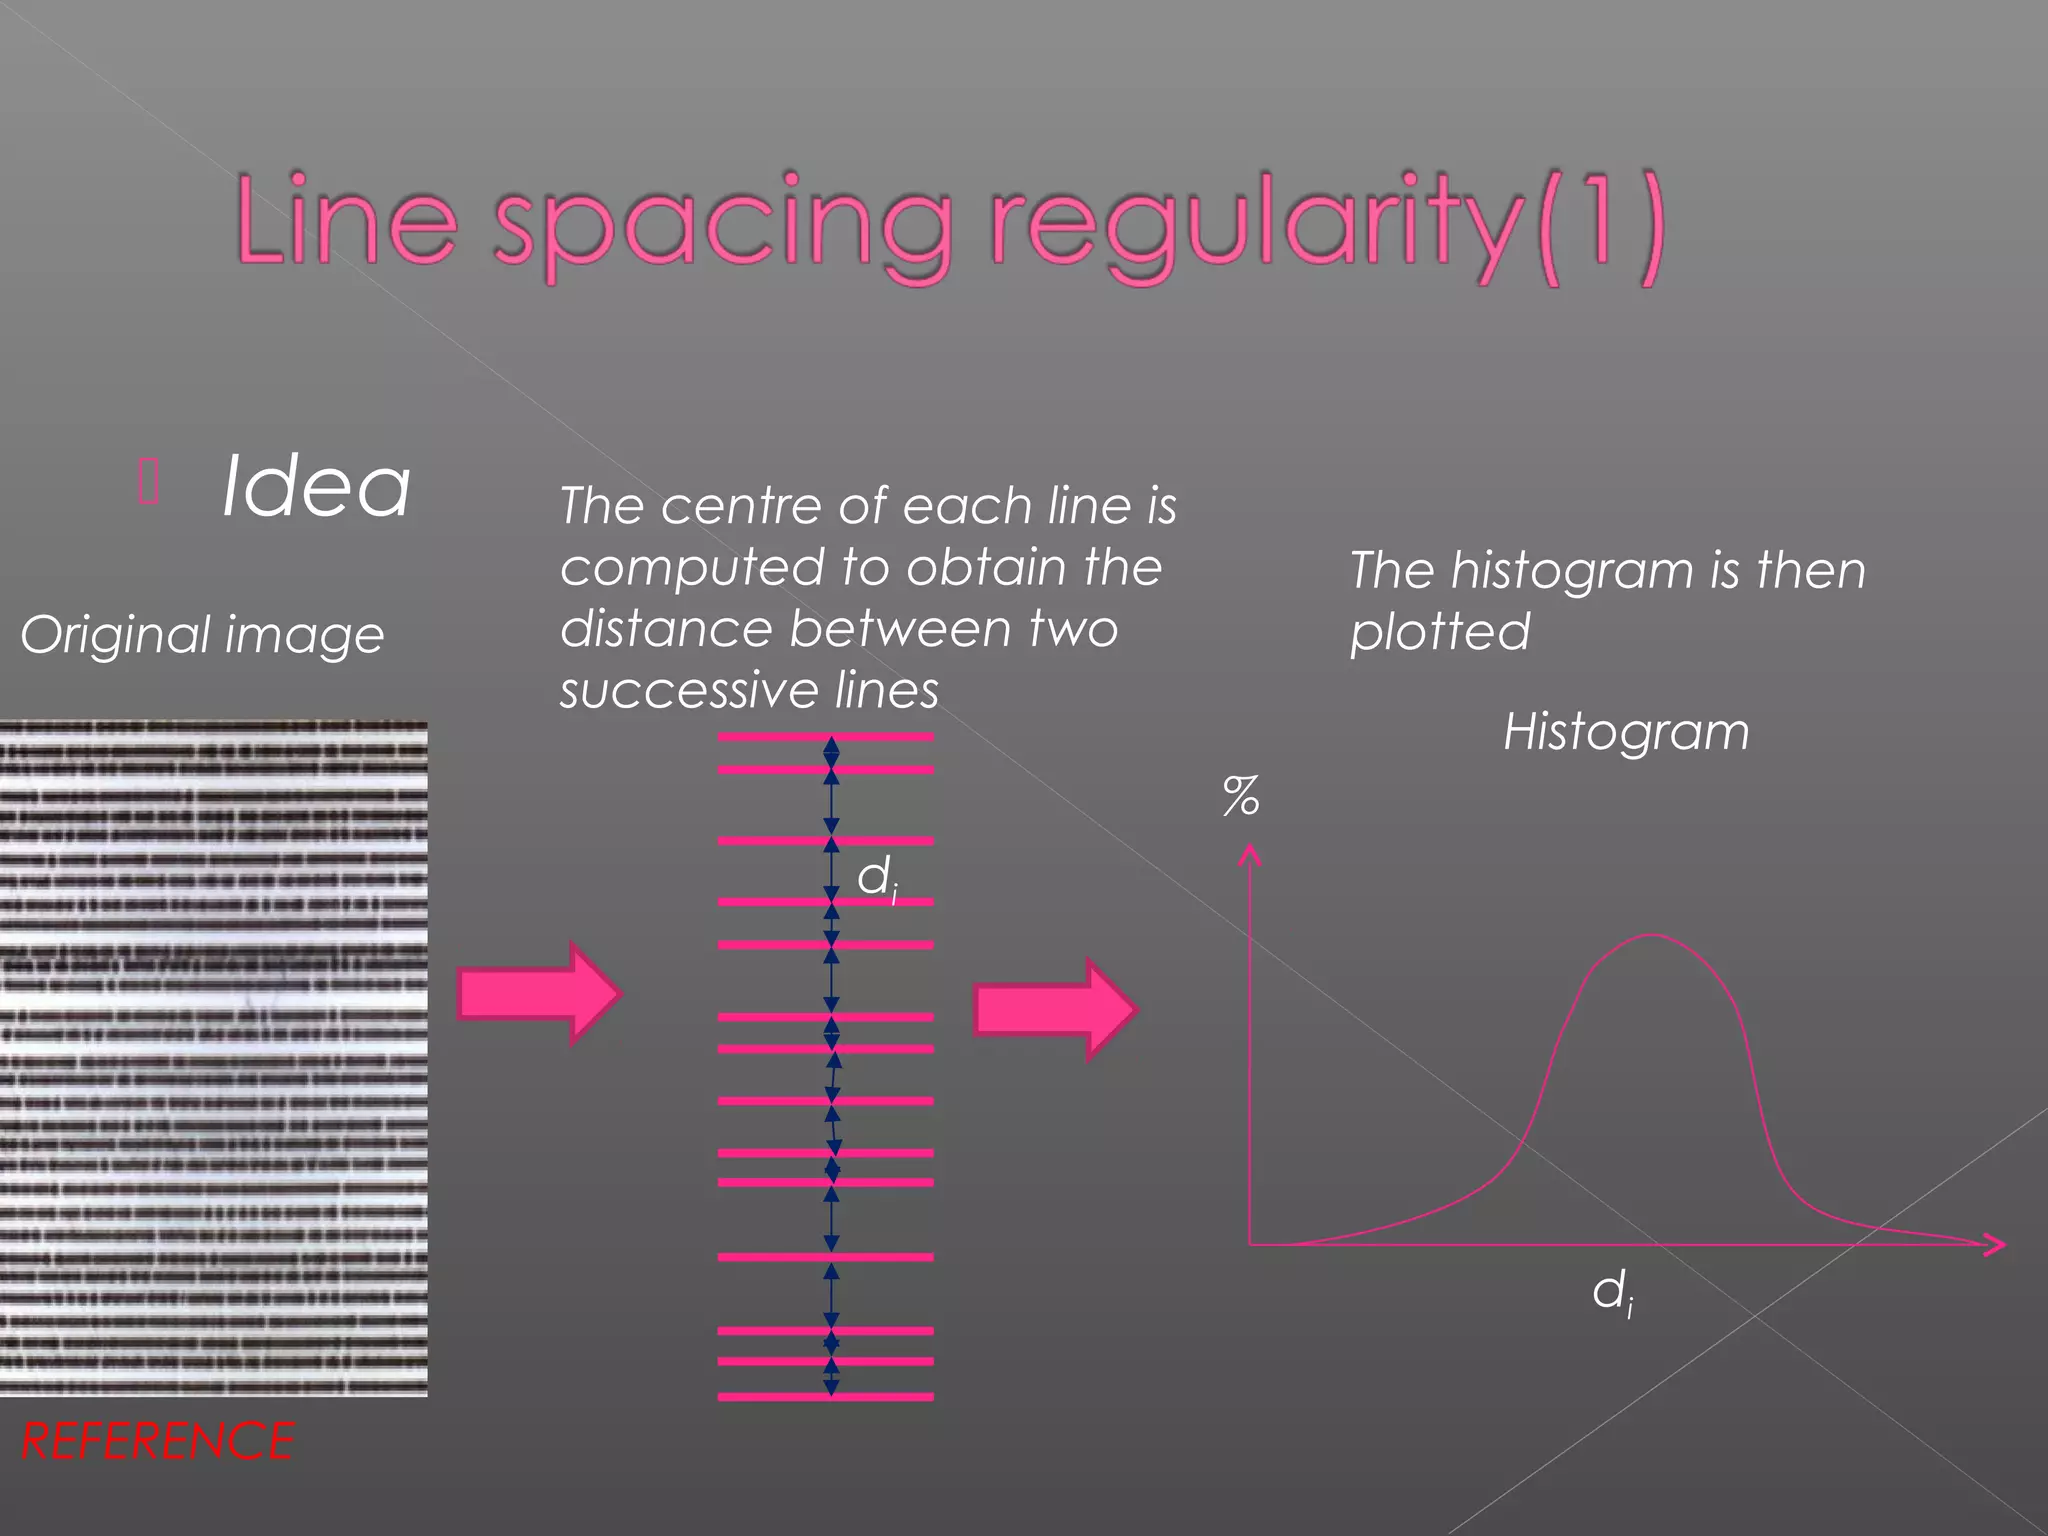
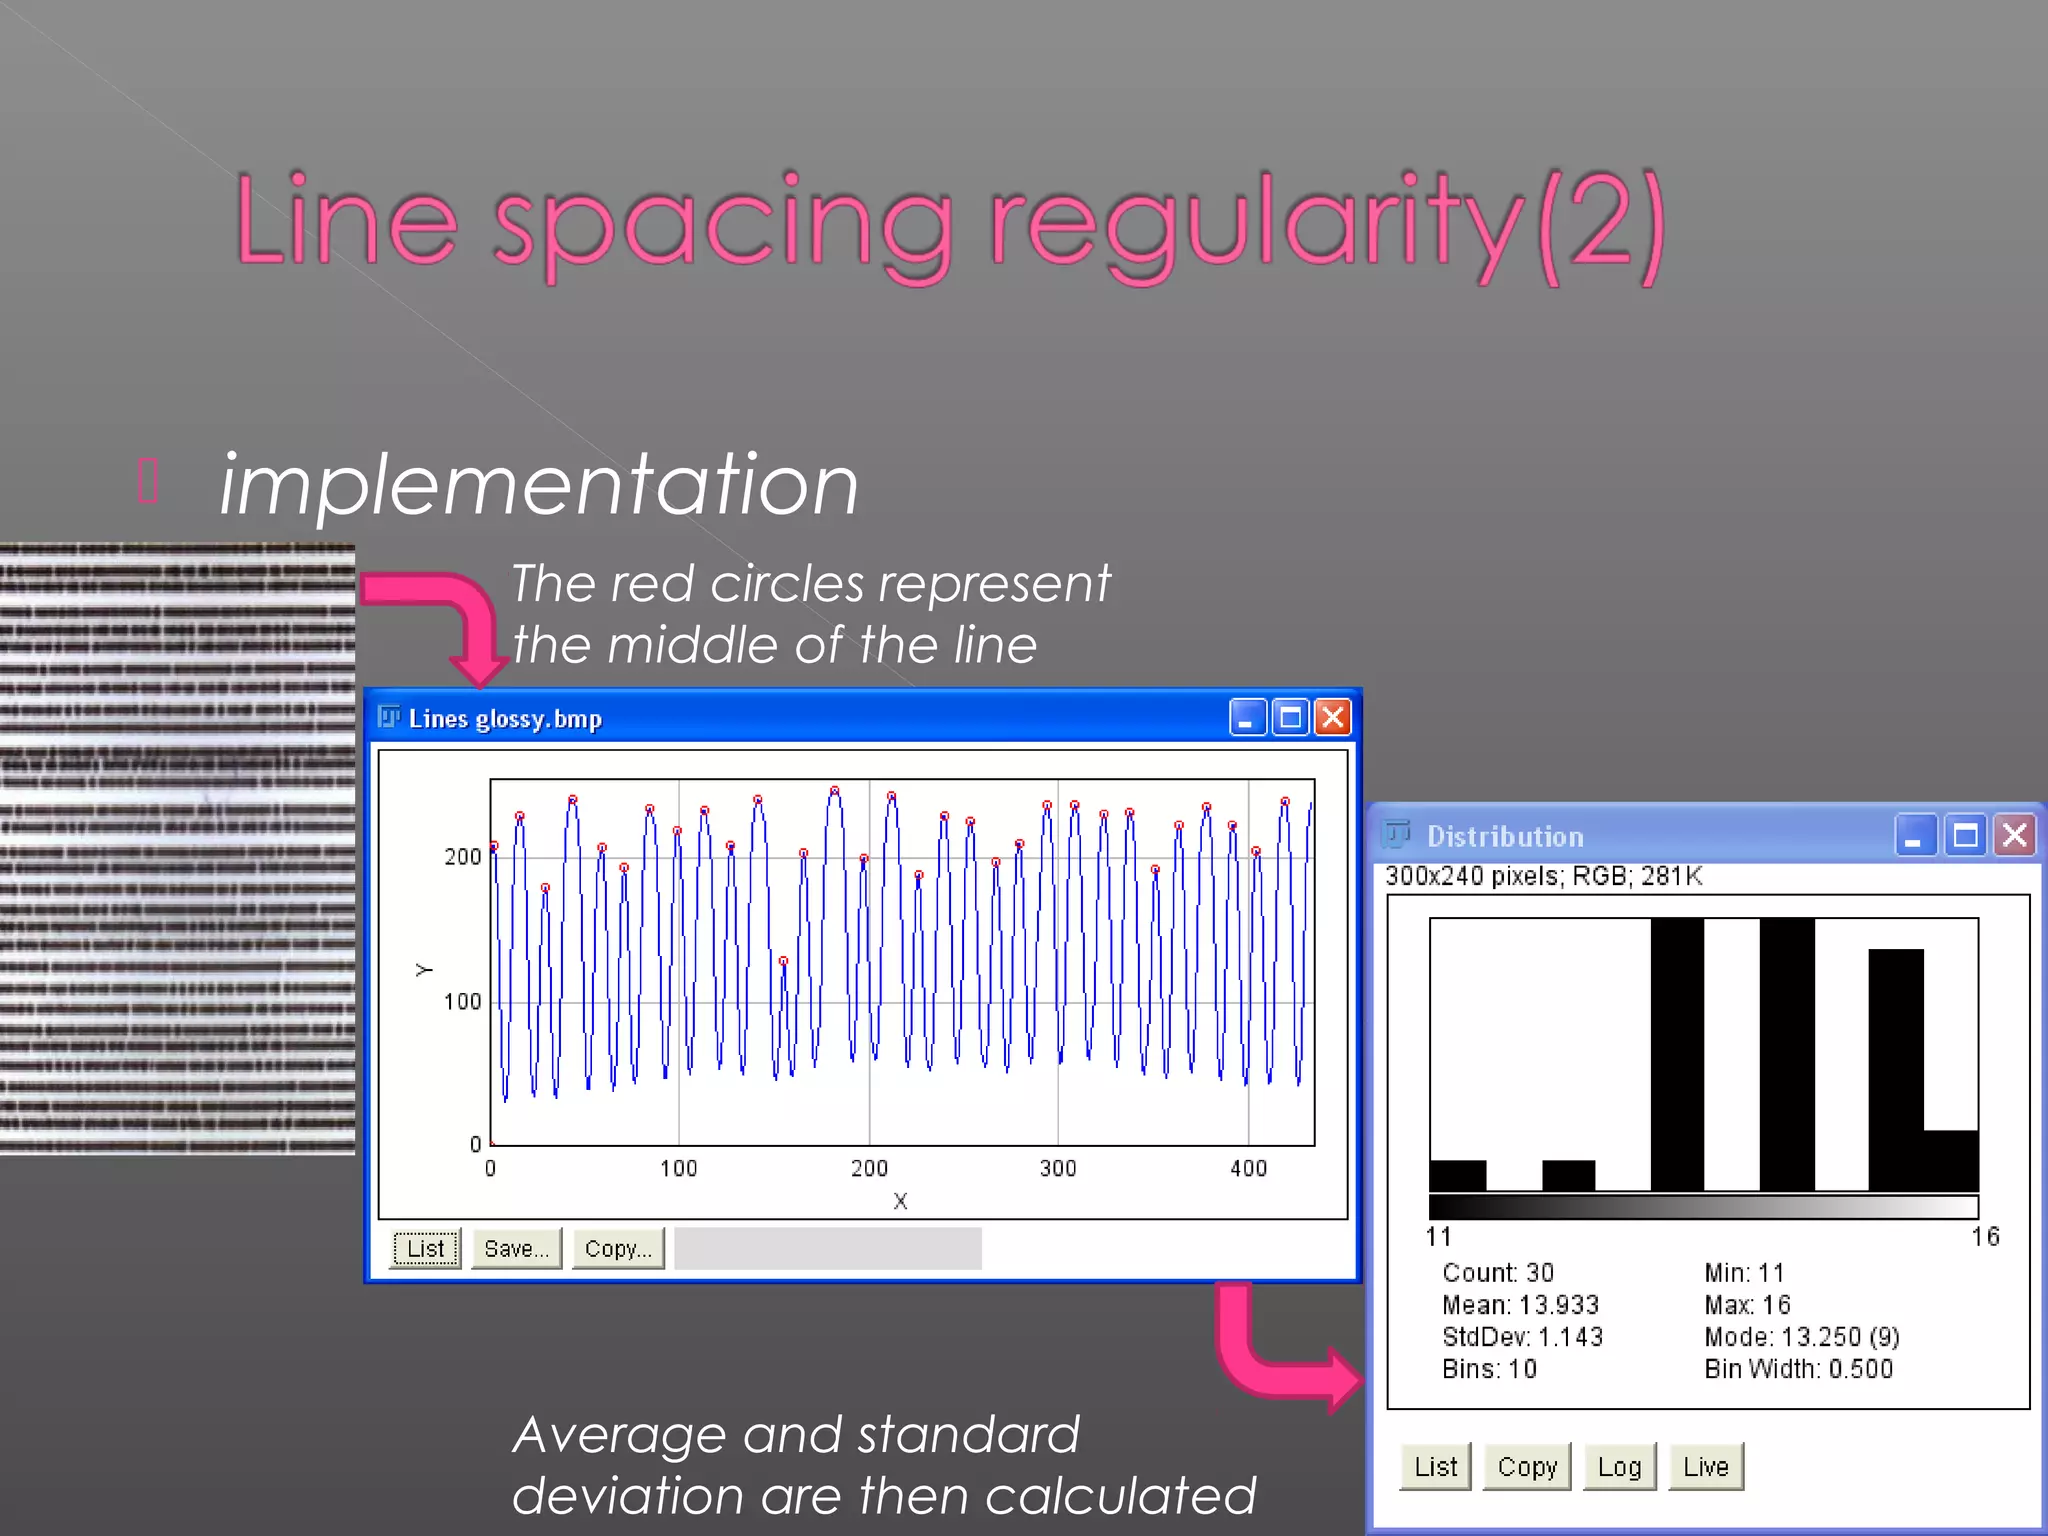
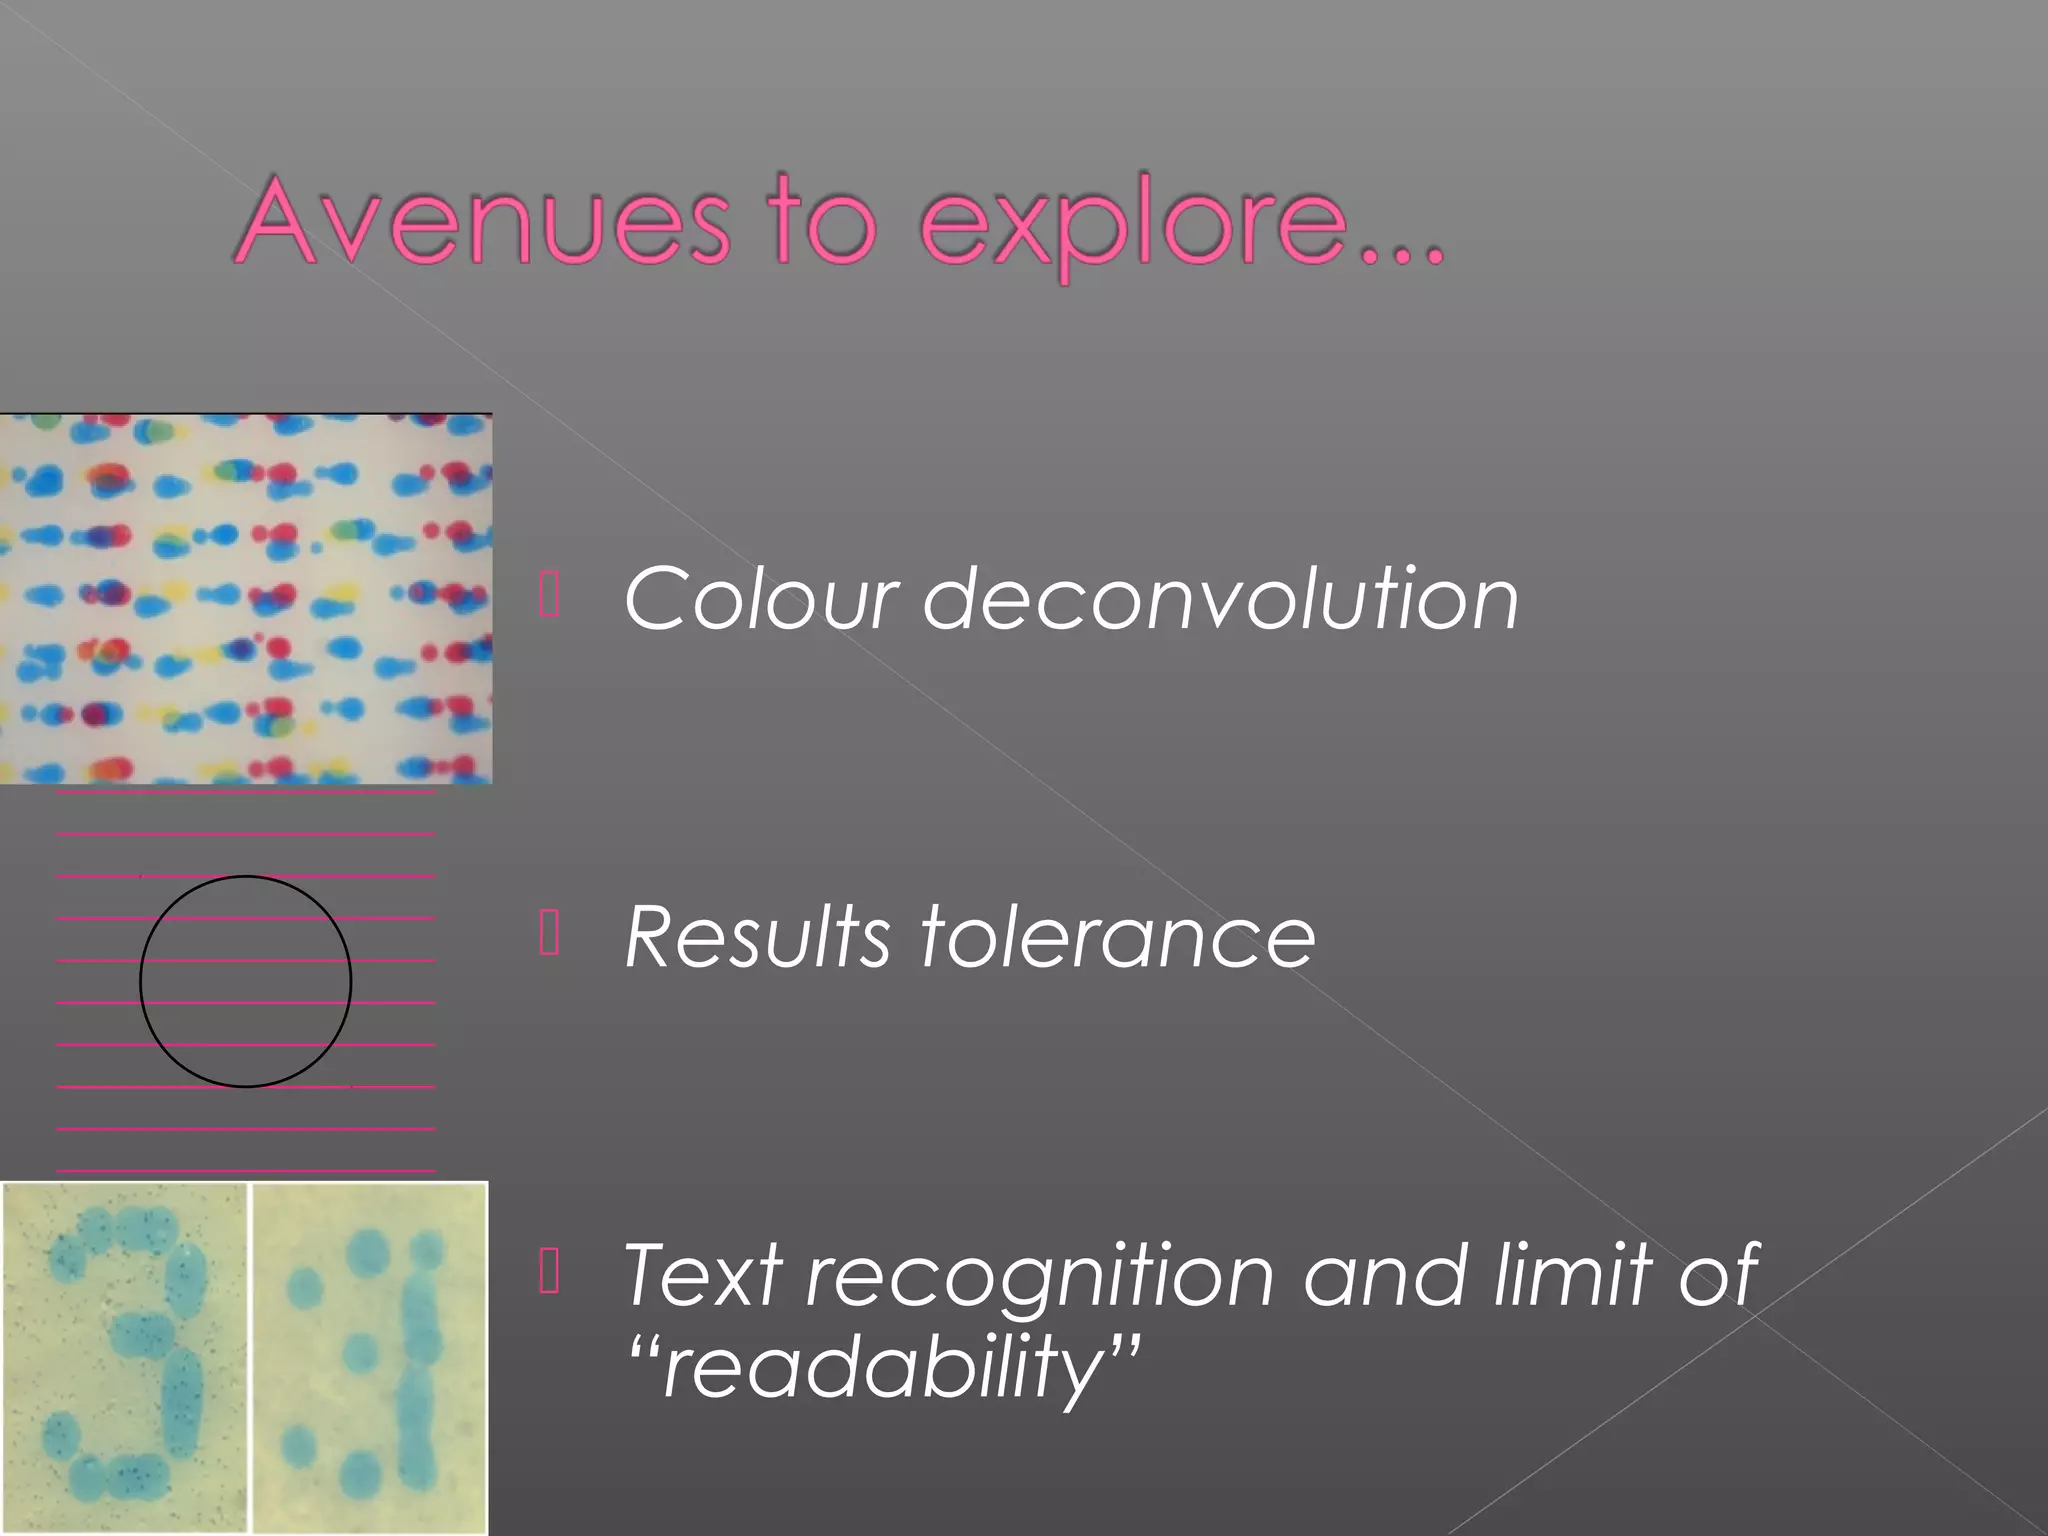
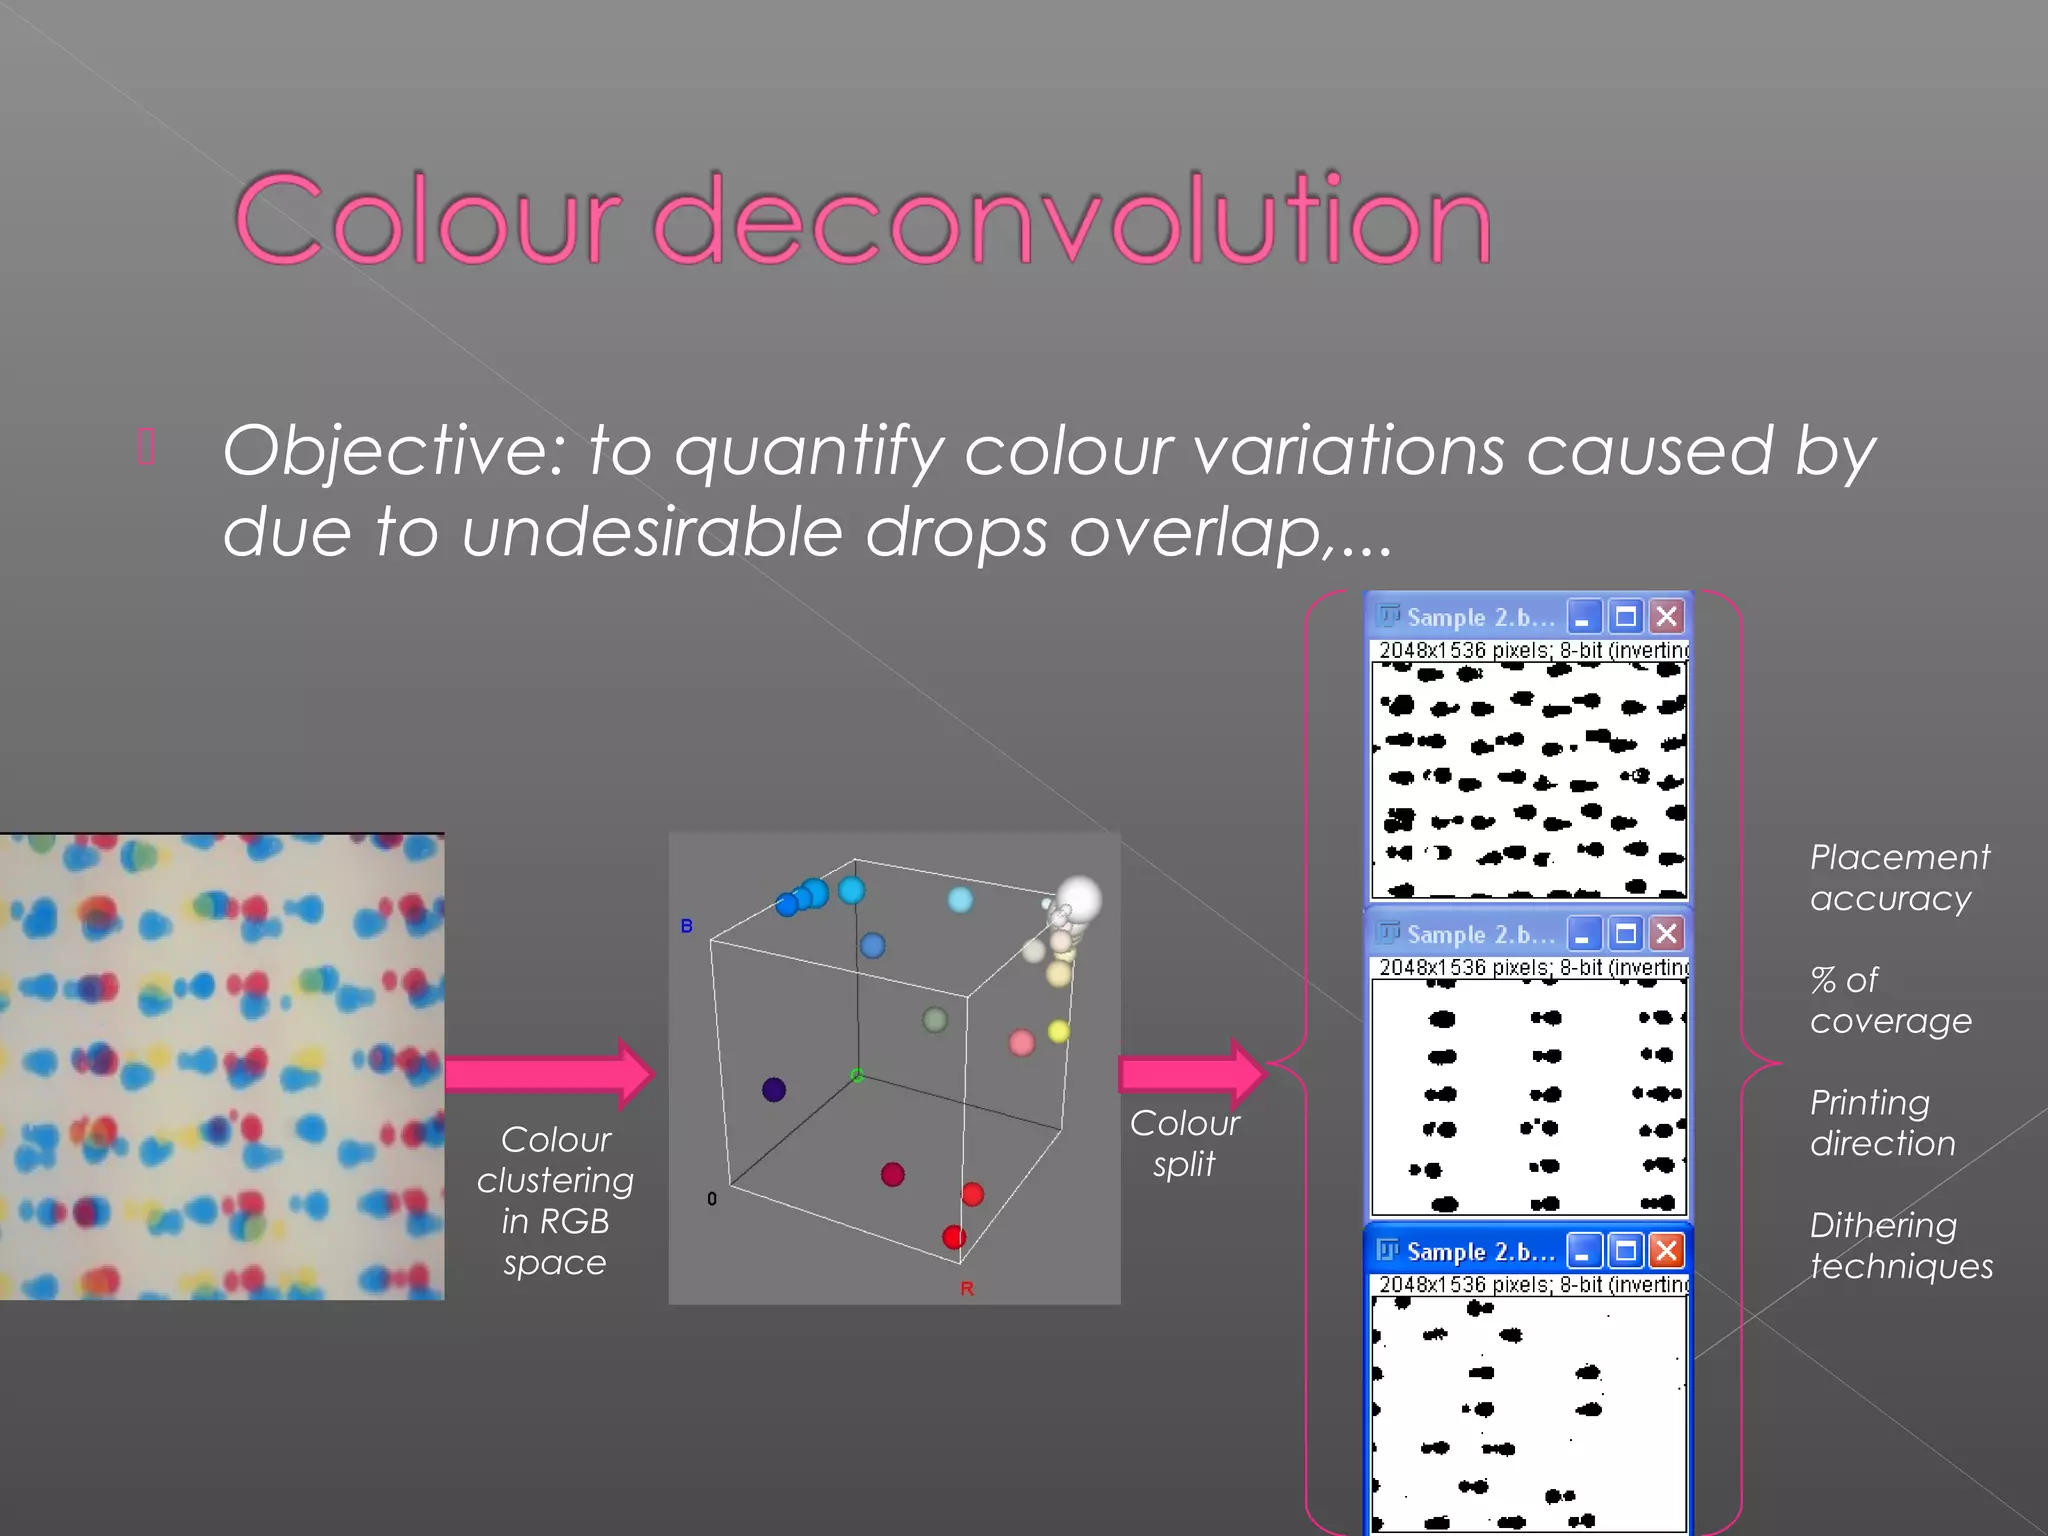
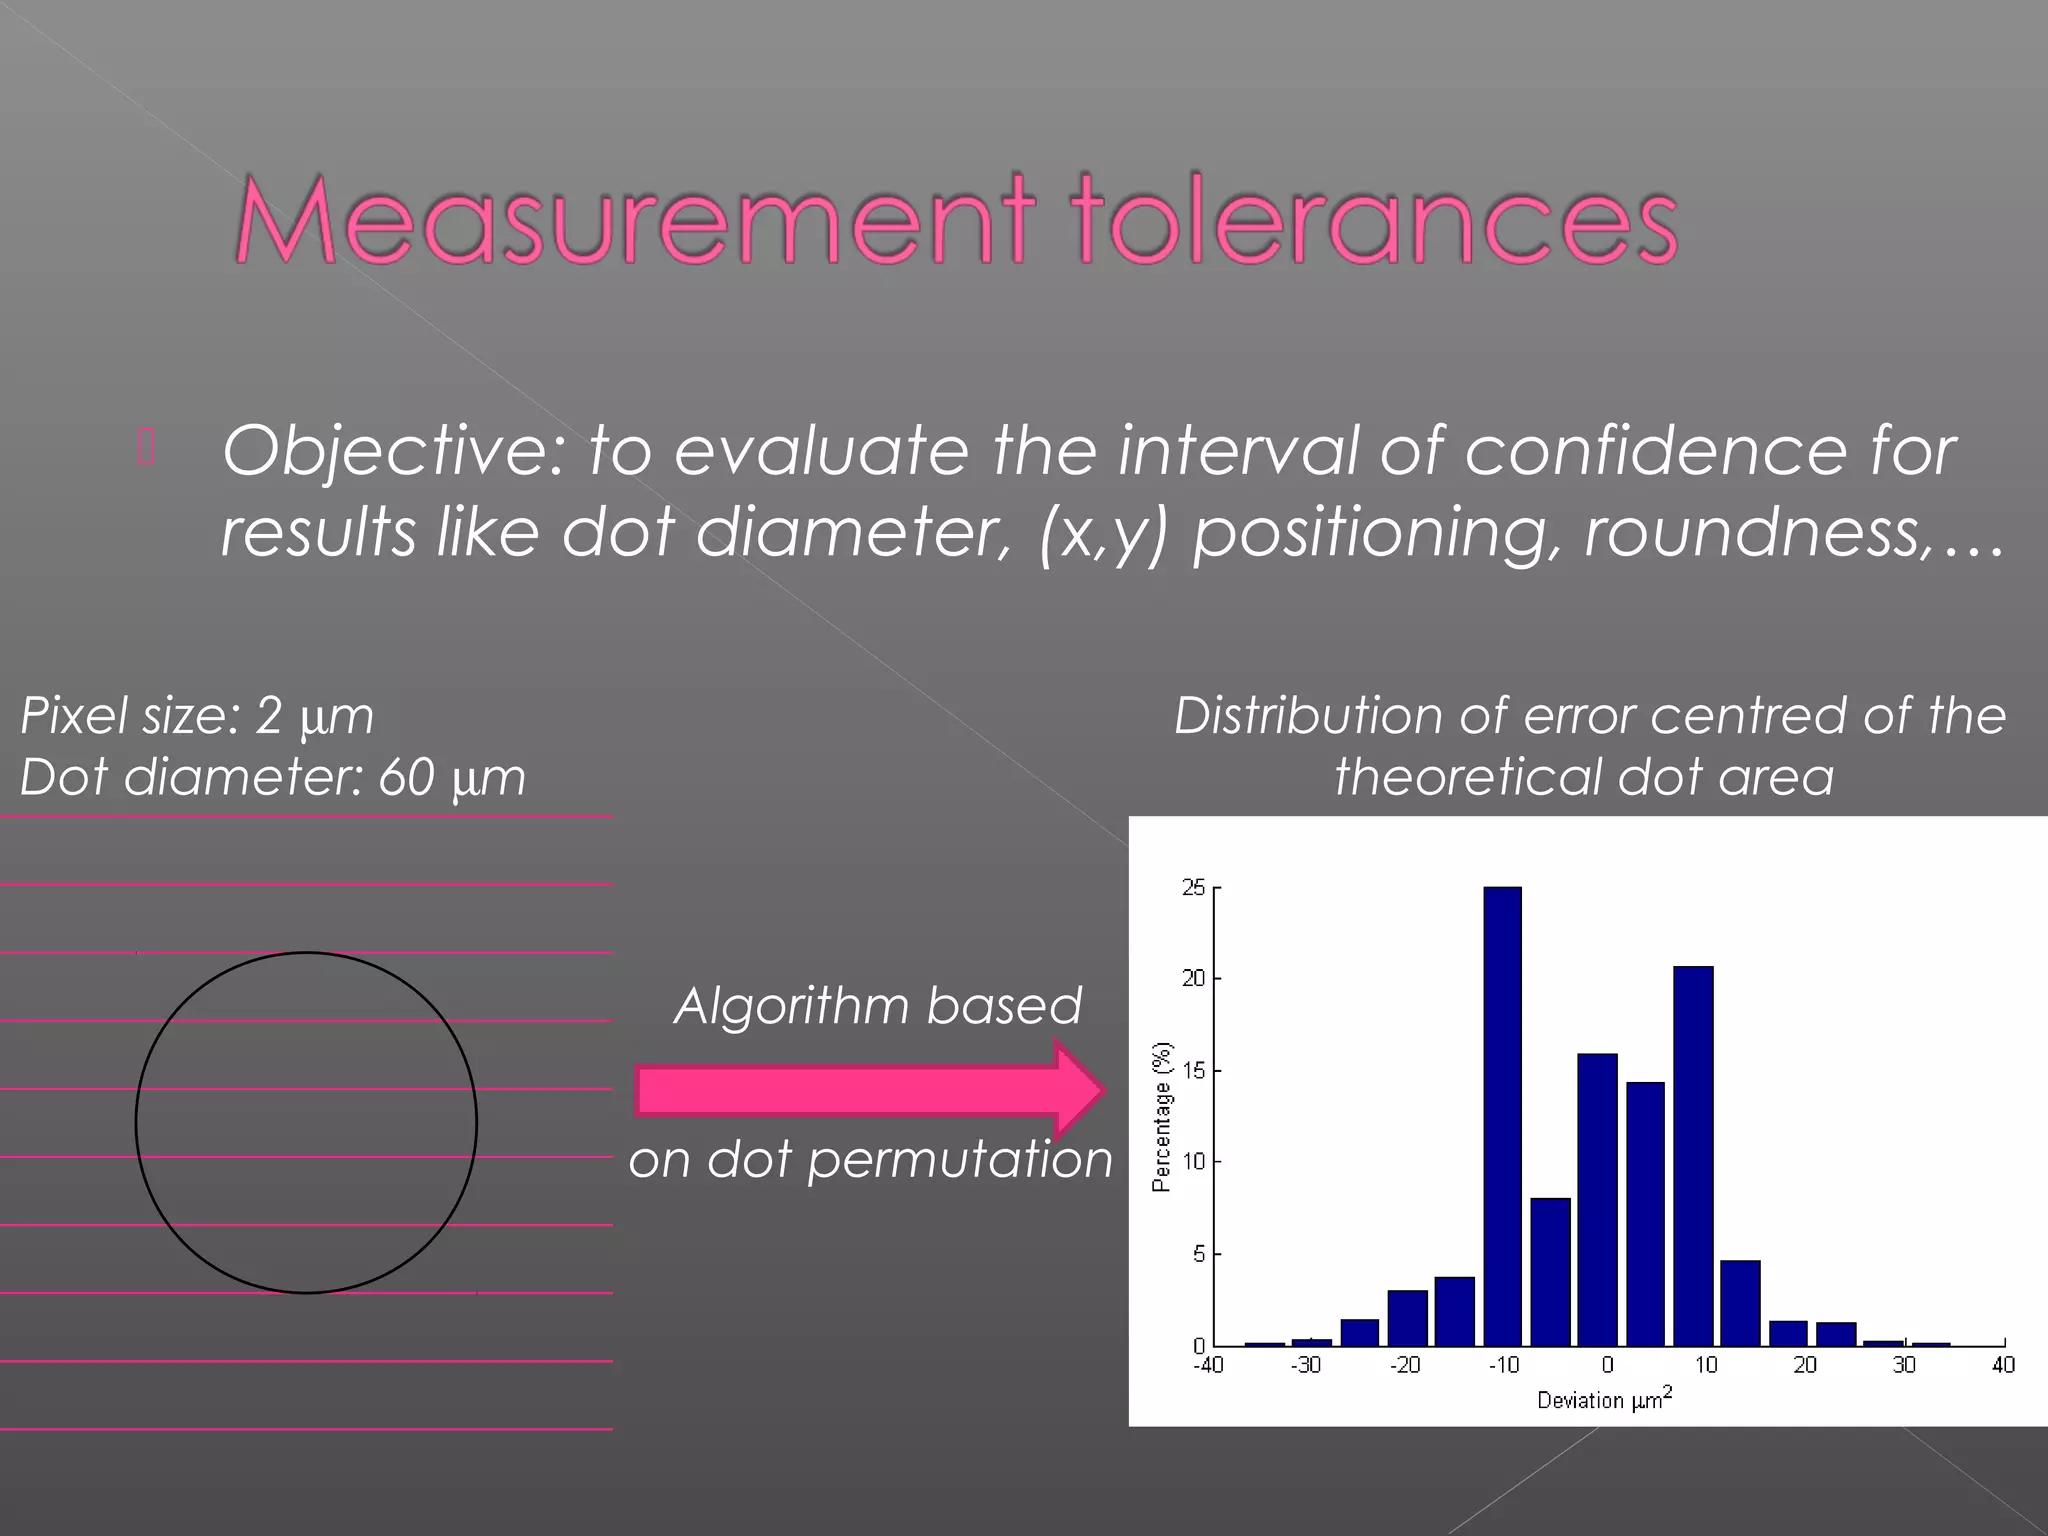
Tech-Forward - Achieving Business Readiness For Copilot in Microsoft 365
Open source print quality software
1.
2. Commercial systems dedicated to assess print quality already
exist. They usually implement the ISO 13660 standard with a
focus on character and line attributes (raggedness, line
width, darkness, character, contrast, fill, extraneous marks,
character field, background haze, character field)
However, they are expensive, lack of flexibility and the access
to their algorithms is not possible.
Fiji/ImageJ and its environment enables to develop an open
source program dedicated to print quality assessment
› free license
› Interface based
› Development using Java language and pre-coded functions
› Enhance collaboration
3. Print target
design
Choice of Printing System model
relevant features
Image
Printing sequences Printing parameters
(drop speed,…) acquisition
Features
Substrate High resolution &
low field of view extraction
Ink vs low resolution
Lines Statistical
& high field of
Printing
view analysis
configuration Dot
Lighting Text Intra-samples
Dithering conditions
techniques Registration mark Inter-
samples
Fiji
4. Fiji is an image processing package. It can be
described as a distribution of ImageJ together
with Java, Java 3D and a lot of plugins.
User interface
Macro/plugings editor
5. Individual ‘bricks’
-Color conversion Software development
-Binary analysis Macro
-Illumination correction Java based program
-…
Increase productivity
Automation
Shorter development time
Proprietary routines and
development of standard
6. Image creation to design test charts
Dithering techniques
Dots and satellites
Line width/raggedness
Series of parallel lines
7. By example, test of optical density regularity
along the swathe
› Periodic pattern
› Random pattern
8. Comparison and impact of different
dithering techniques
Implementation of algorithms specific to
greyscale printhead
11. › Edges extraction + angular correction +
average and standard deviation on both
sides of the line
12. Idea The centre of each line is
computed to obtain the The histogram is then
Original image distance between two plotted
successive lines
Histogram
%
di
di
REFERENCE
13. implementation
The red circles represent
the middle of the line
Average and standard
deviation are then calculated
14. Colour deconvolution
Results tolerance
Text recognition and limit of
“readability”
15. Objective: to quantify colour variations caused by
due to undesirable drops overlap,...
Placement
accuracy
% of
coverage
Printing
Colour Colour
direction
clustering split
in RGB Dithering
space techniques
16. Objective: to evaluate the interval of confidence for
results like dot diameter, (x,y) positioning, roundness,…
Pixel size: 2 µm Distribution of error centred of the
Dot diameter: 60 µm theoretical dot area
Algorithm based
on dot permutation
17. Image analysis is an approach, but not
the end of the story
PQ can be described along several others
physical dimensions (Optical density,
colour gamut, full tone uniformity…)
Some levels of overlapping exist between
them
18. If you:
› want to know more about ImageJ / Fiji
› are interested in developing an ISO13660
open source software
› have a specific need regarding print quality
assessment, beyond image analysis
I would be please to heard from you.