Download to read offline
![Turner et al. [2008]
ClinicalTrials.gov
In medicine…](https://image.slidesharecdn.com/bitss-righttoresearch-aug15-150814161046-lva1-app6891/75/Open-Data-and-the-Social-Sciences-OpenCon-Community-Webcast-11-2048.jpg)
![Turner et al. [2008]
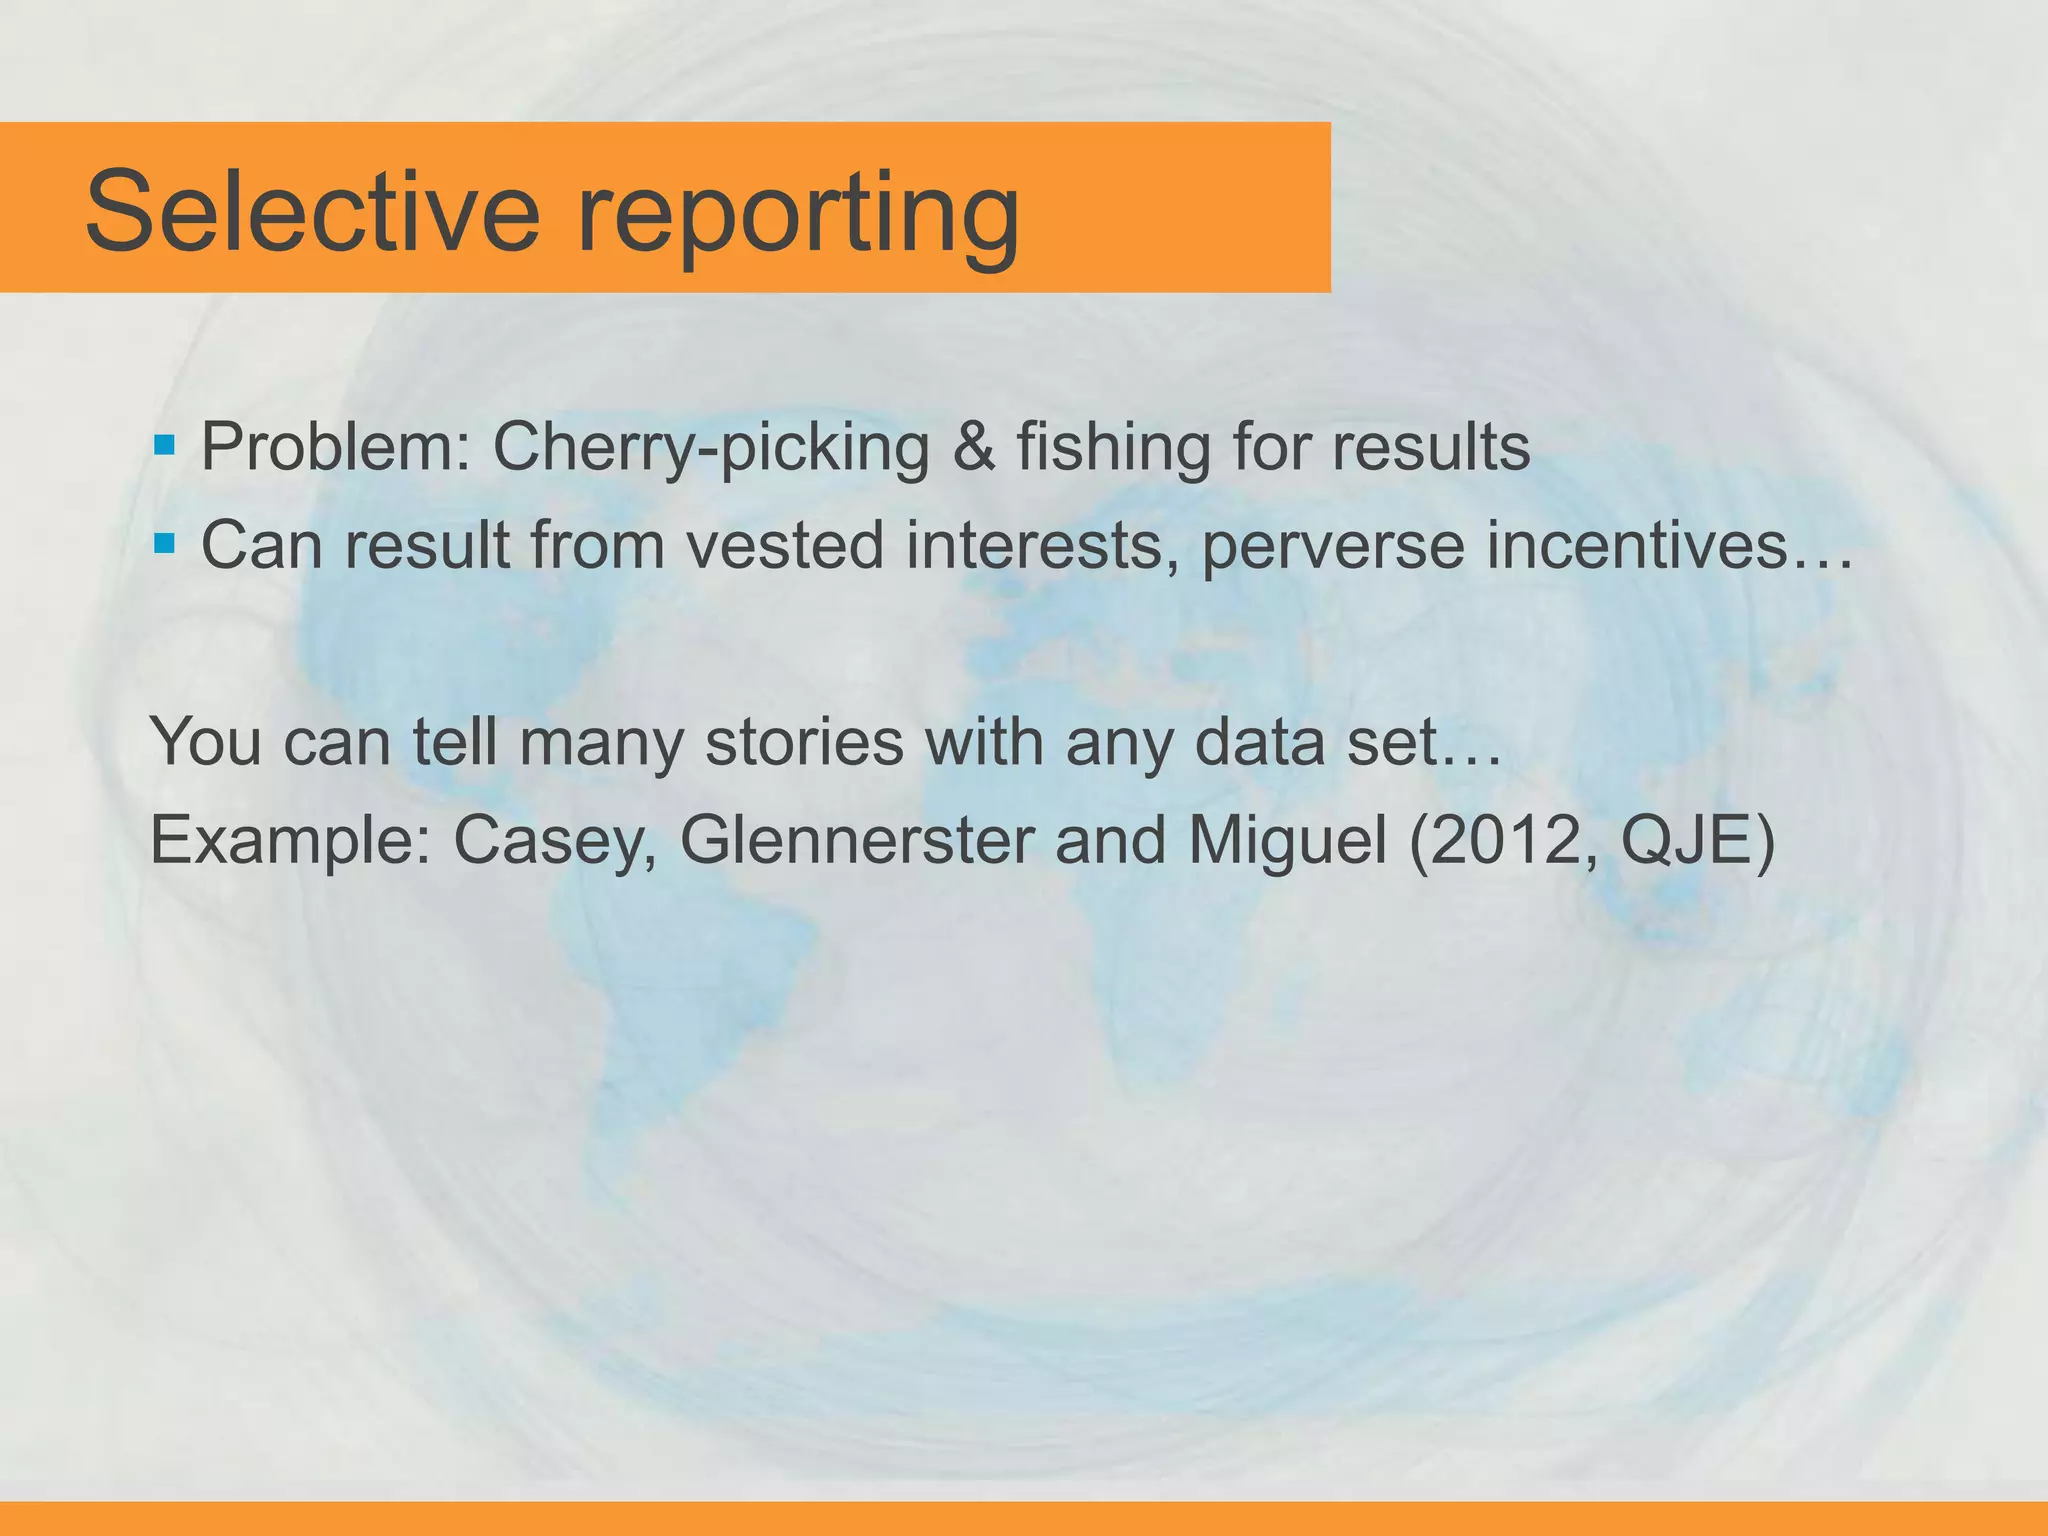
In economics…
Brodeur et al 2012. Data 50,000 tests published in AER, JPE, QJE (2005-2011)](https://image.slidesharecdn.com/bitss-righttoresearch-aug15-150814161046-lva1-app6891/75/Open-Data-and-the-Social-Sciences-OpenCon-Community-Webcast-13-2048.jpg)

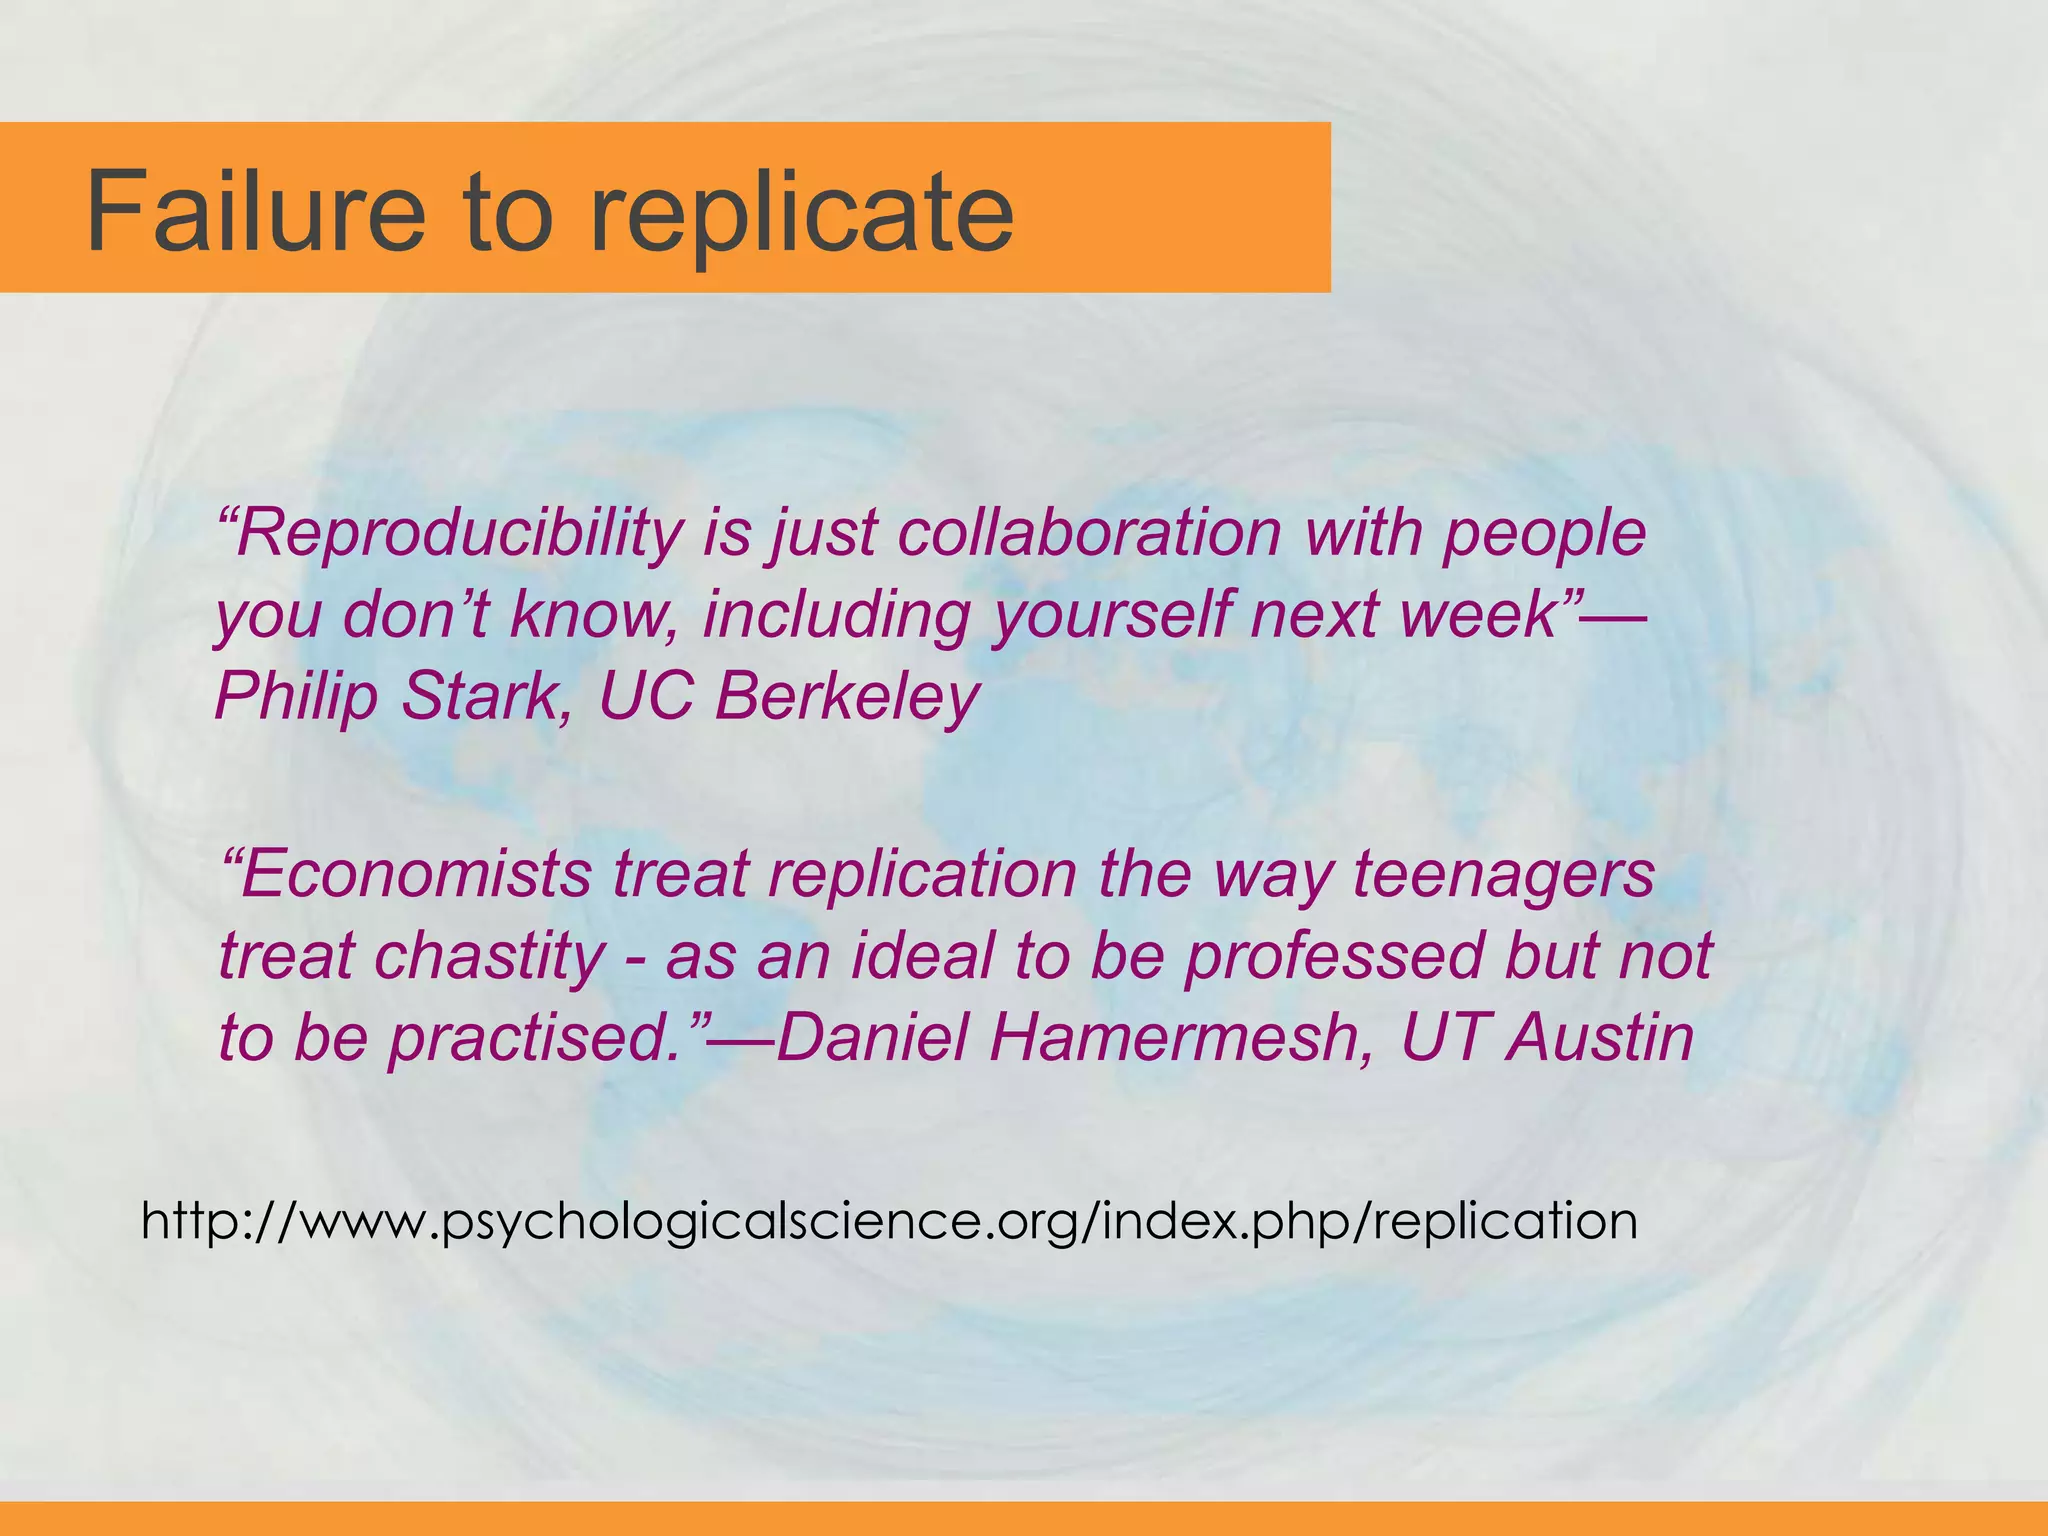
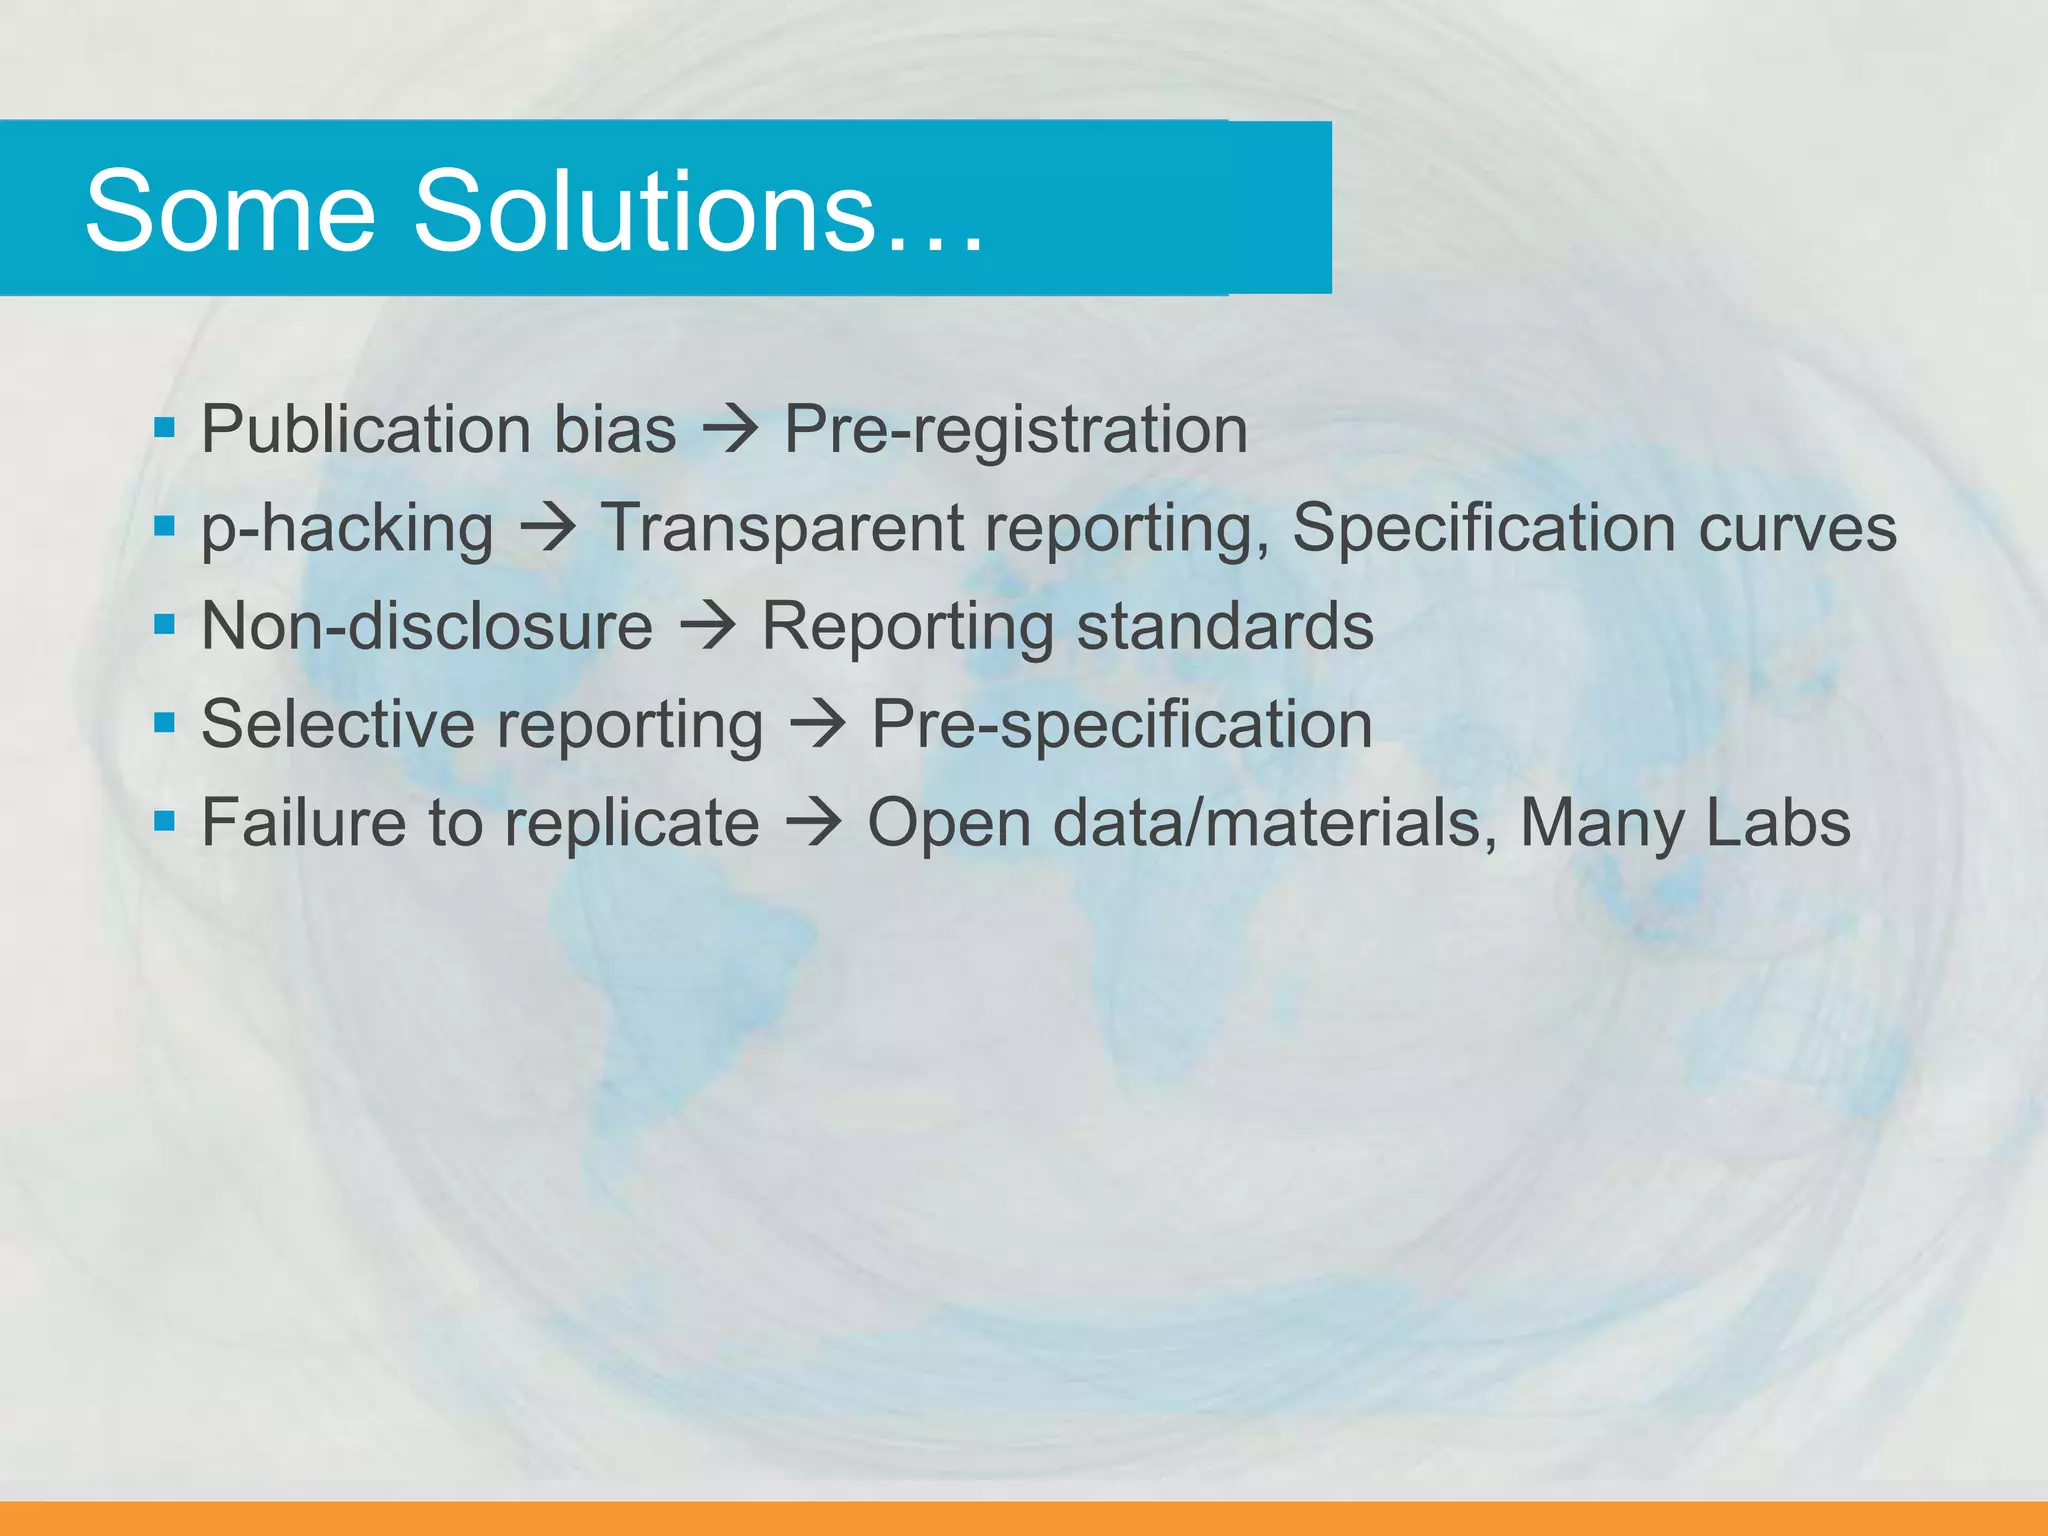
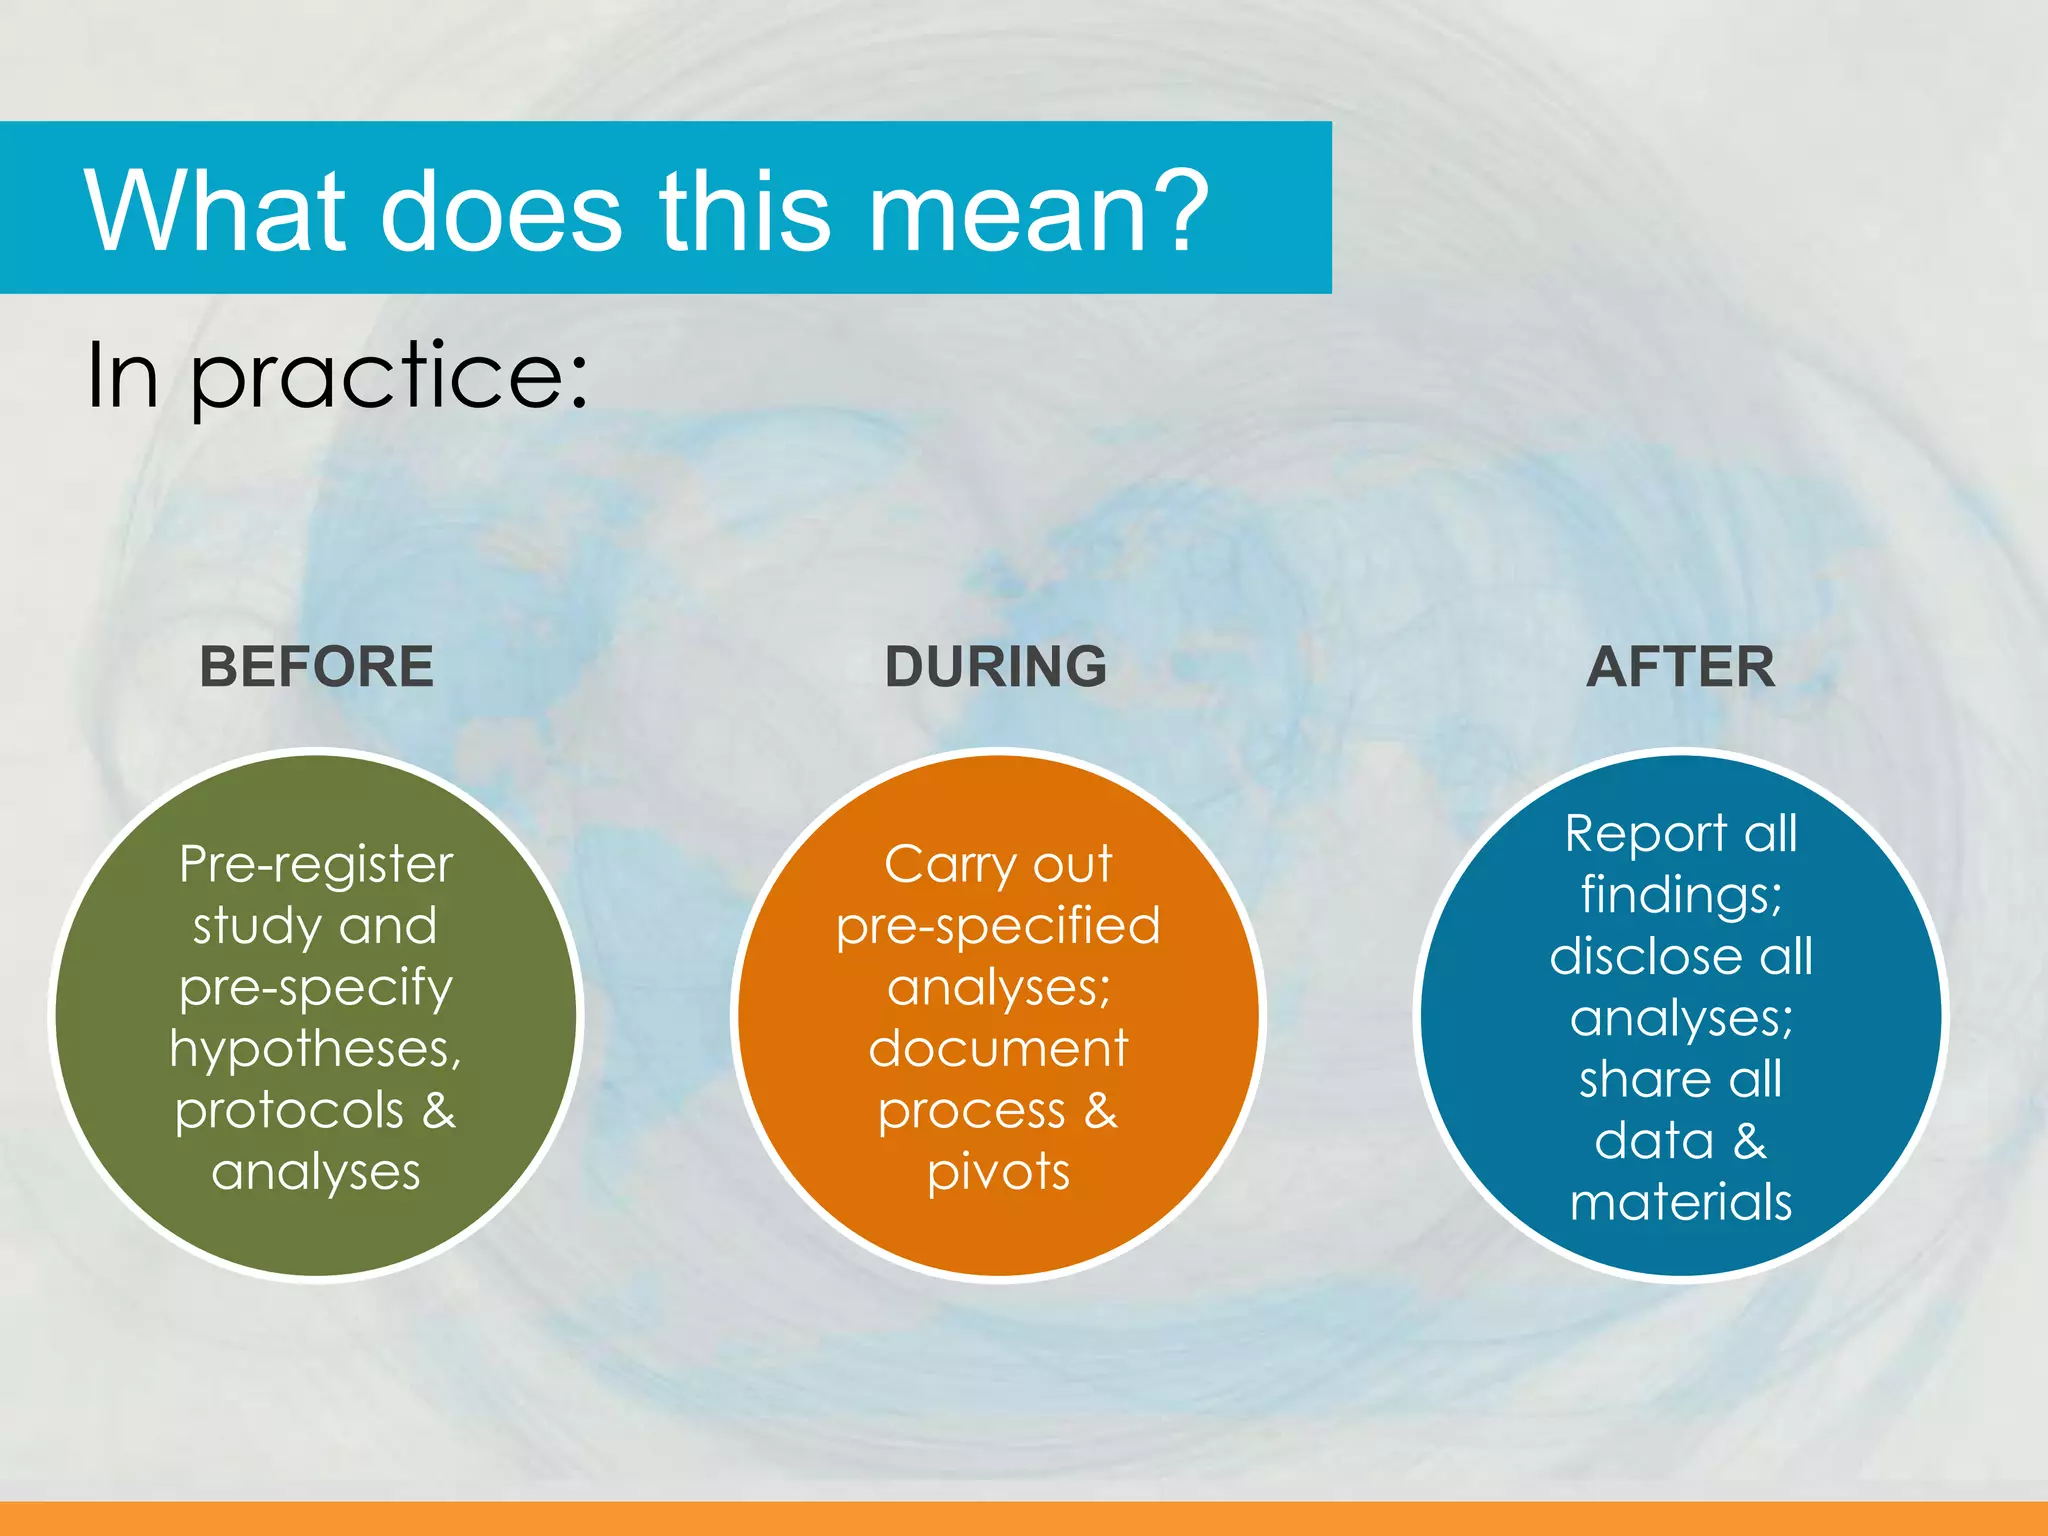
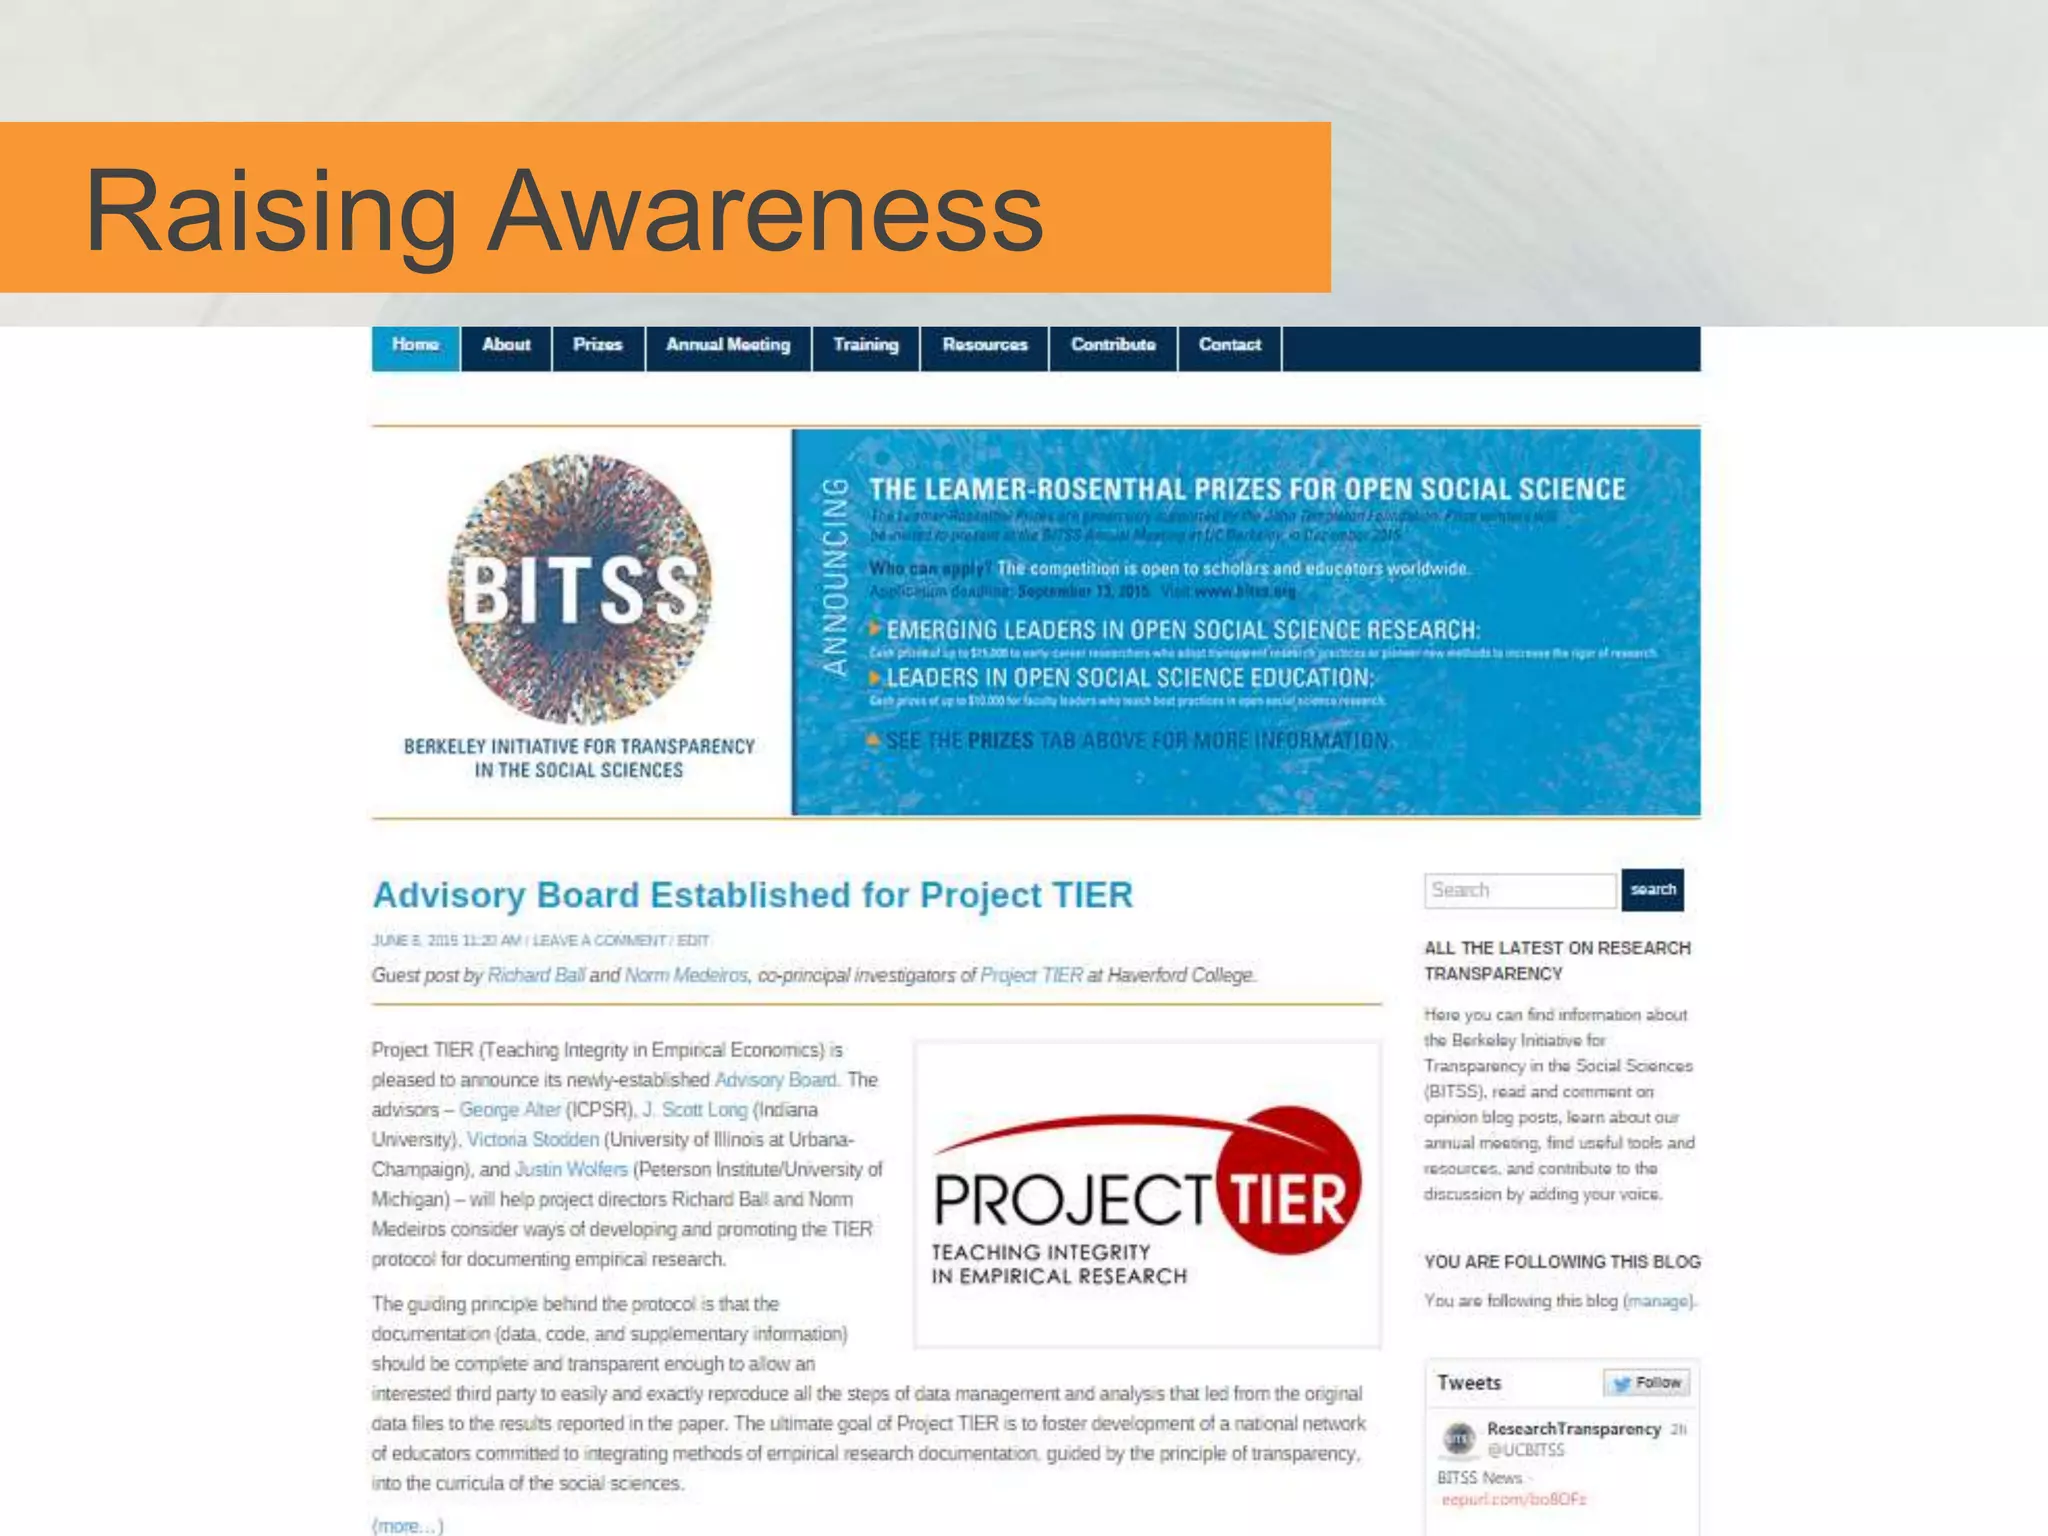

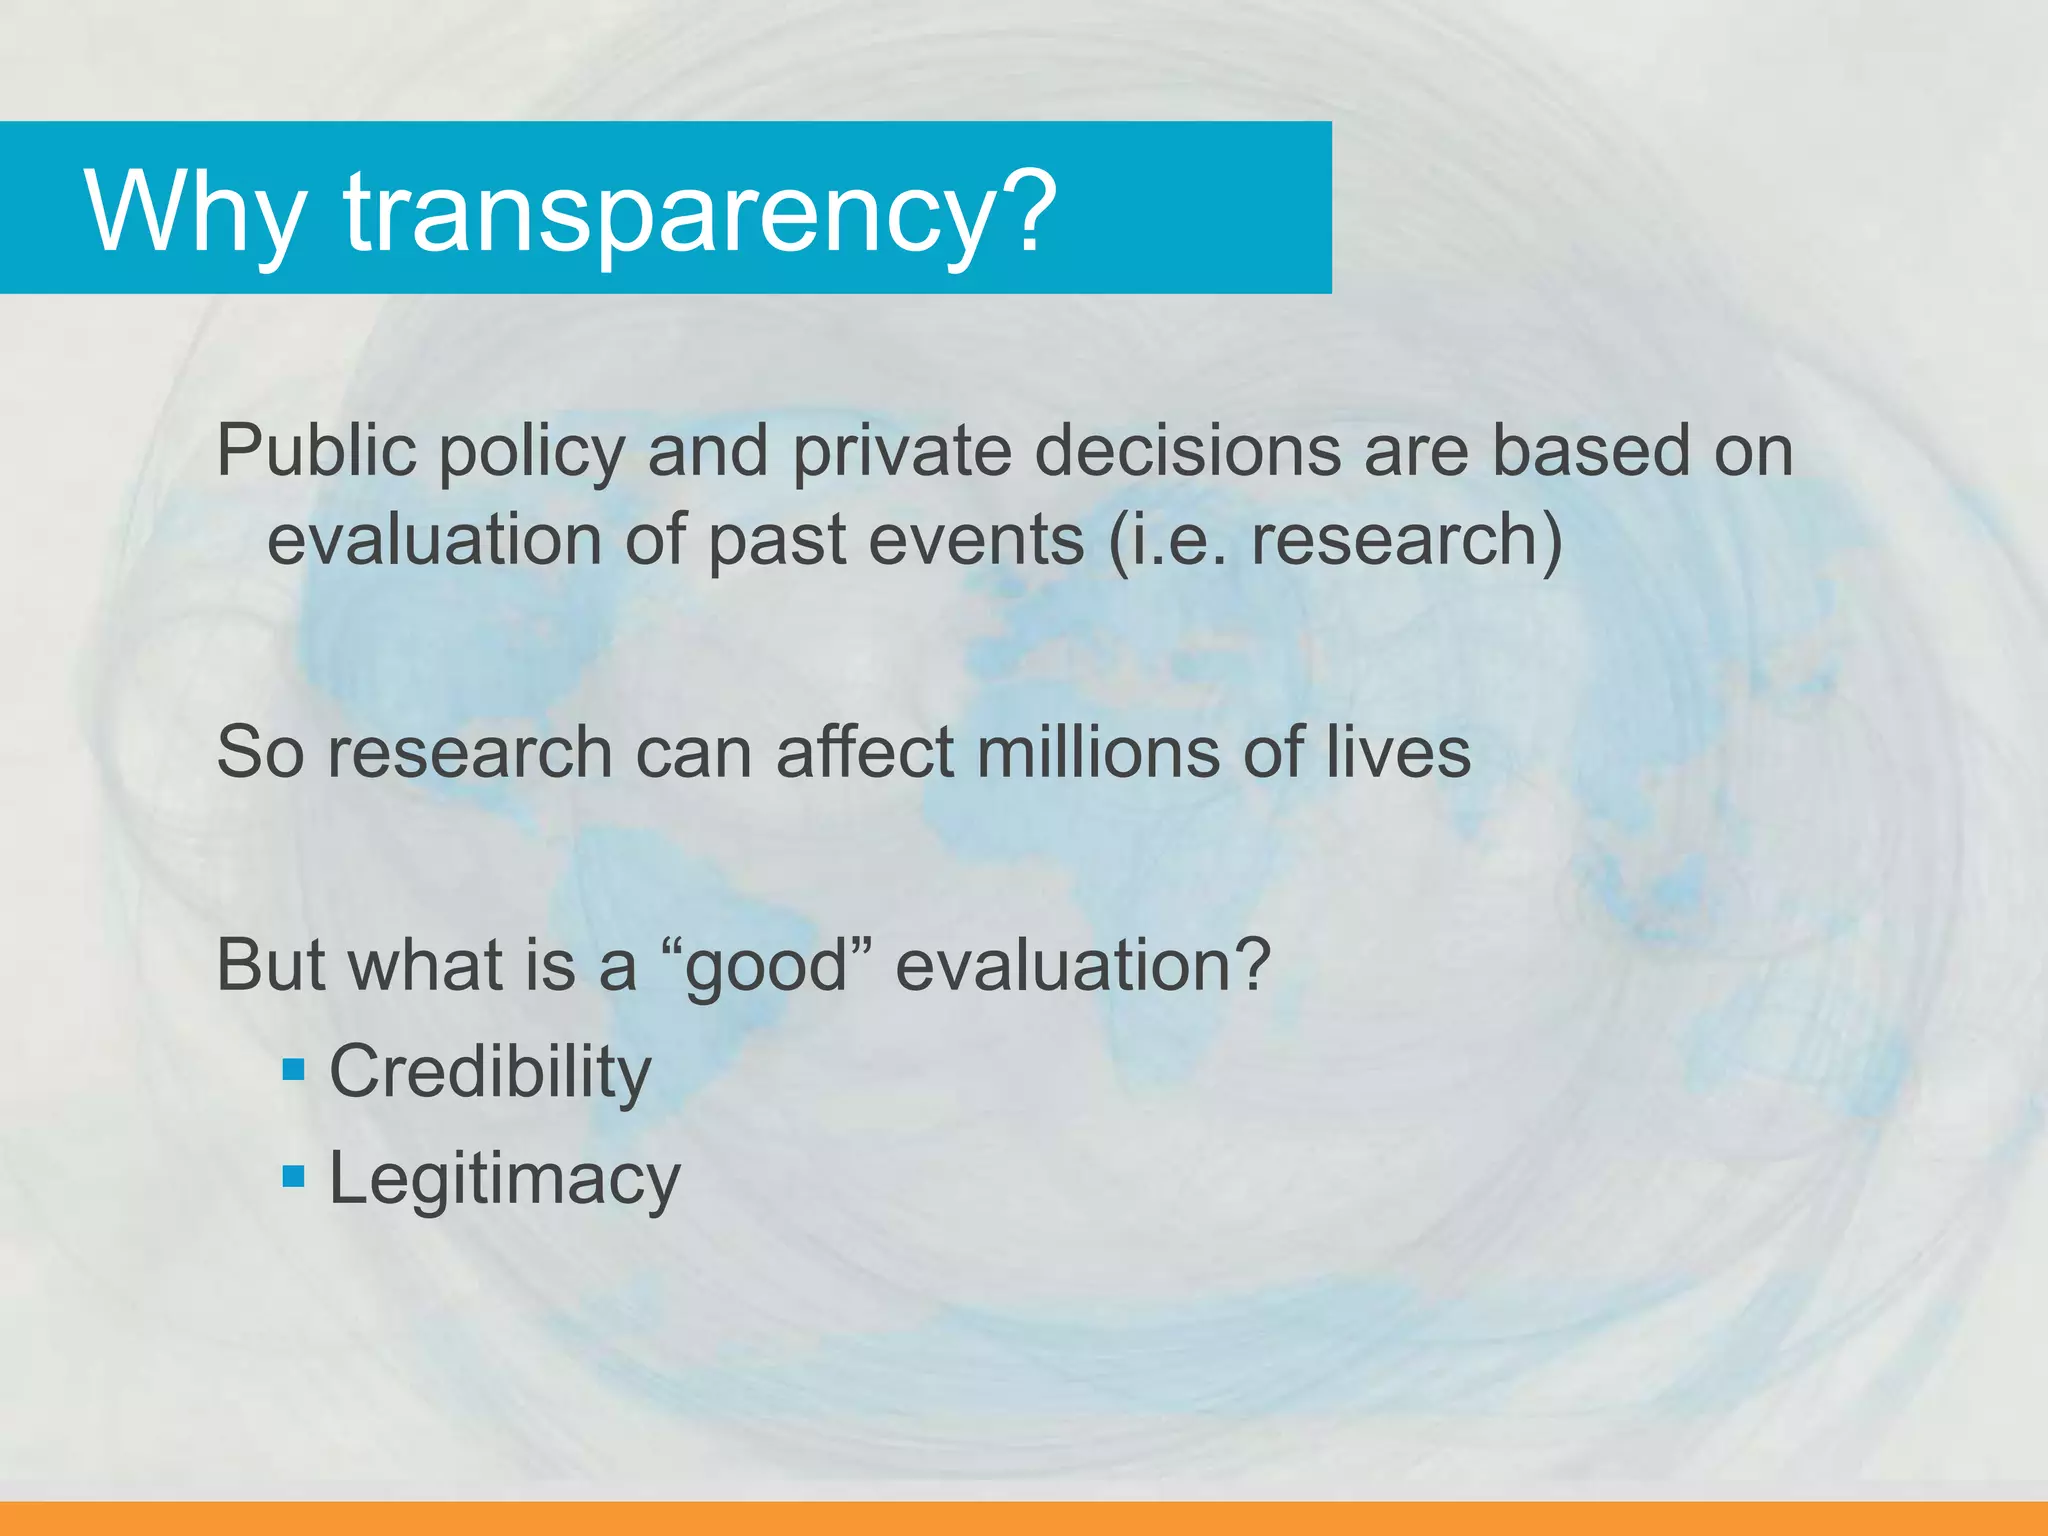
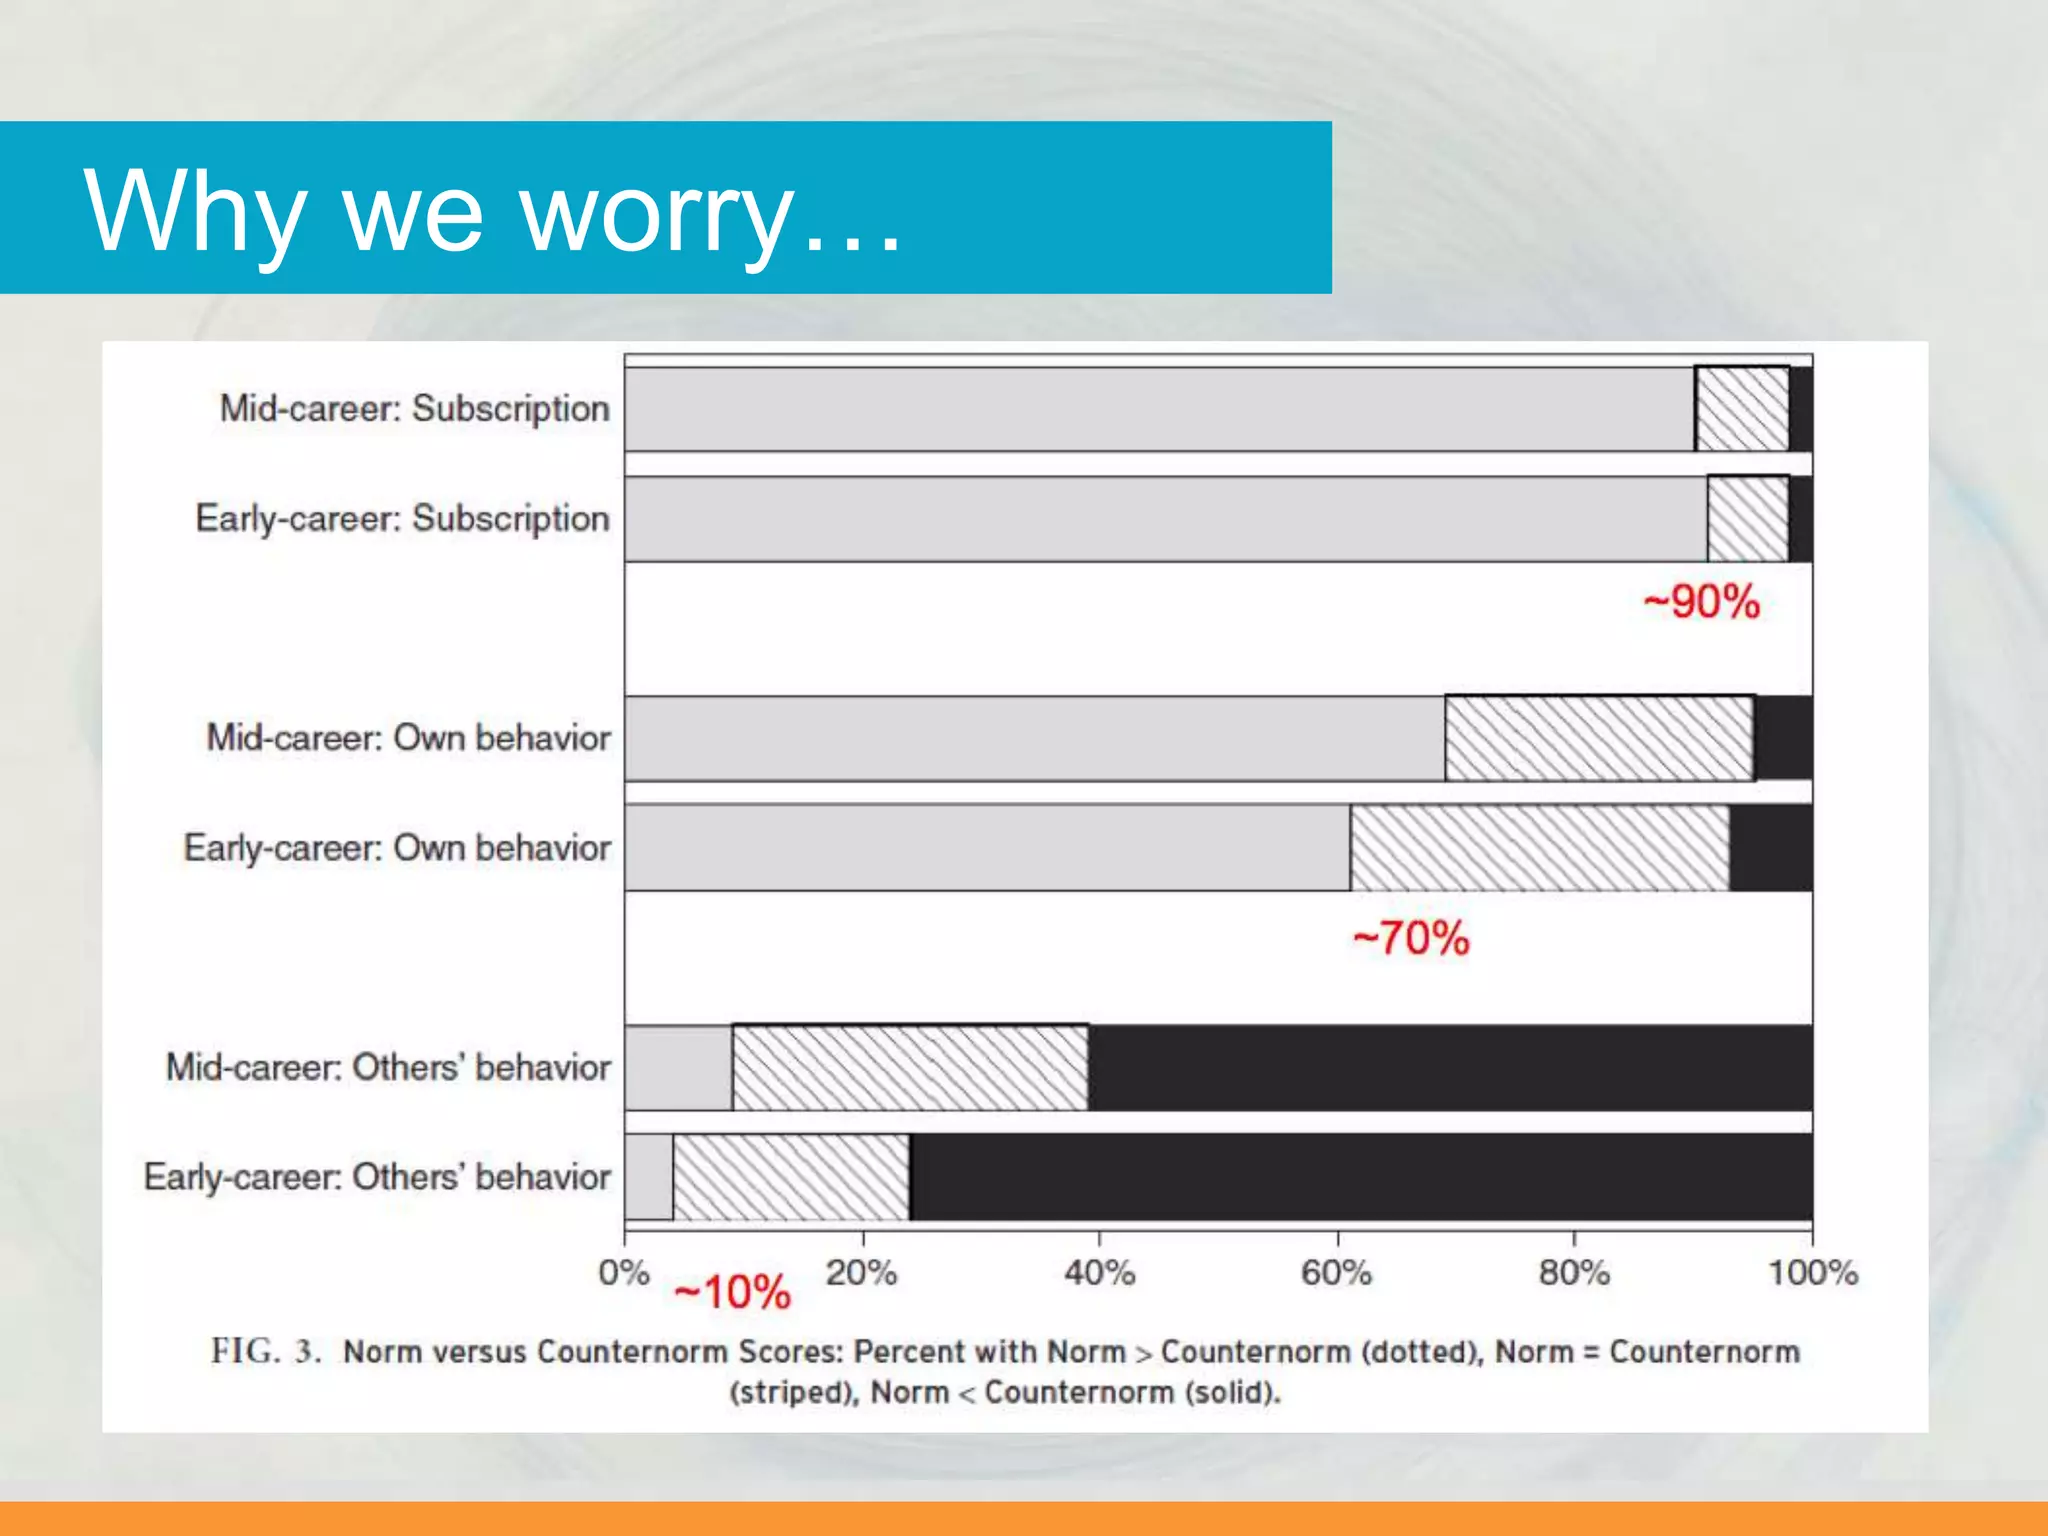
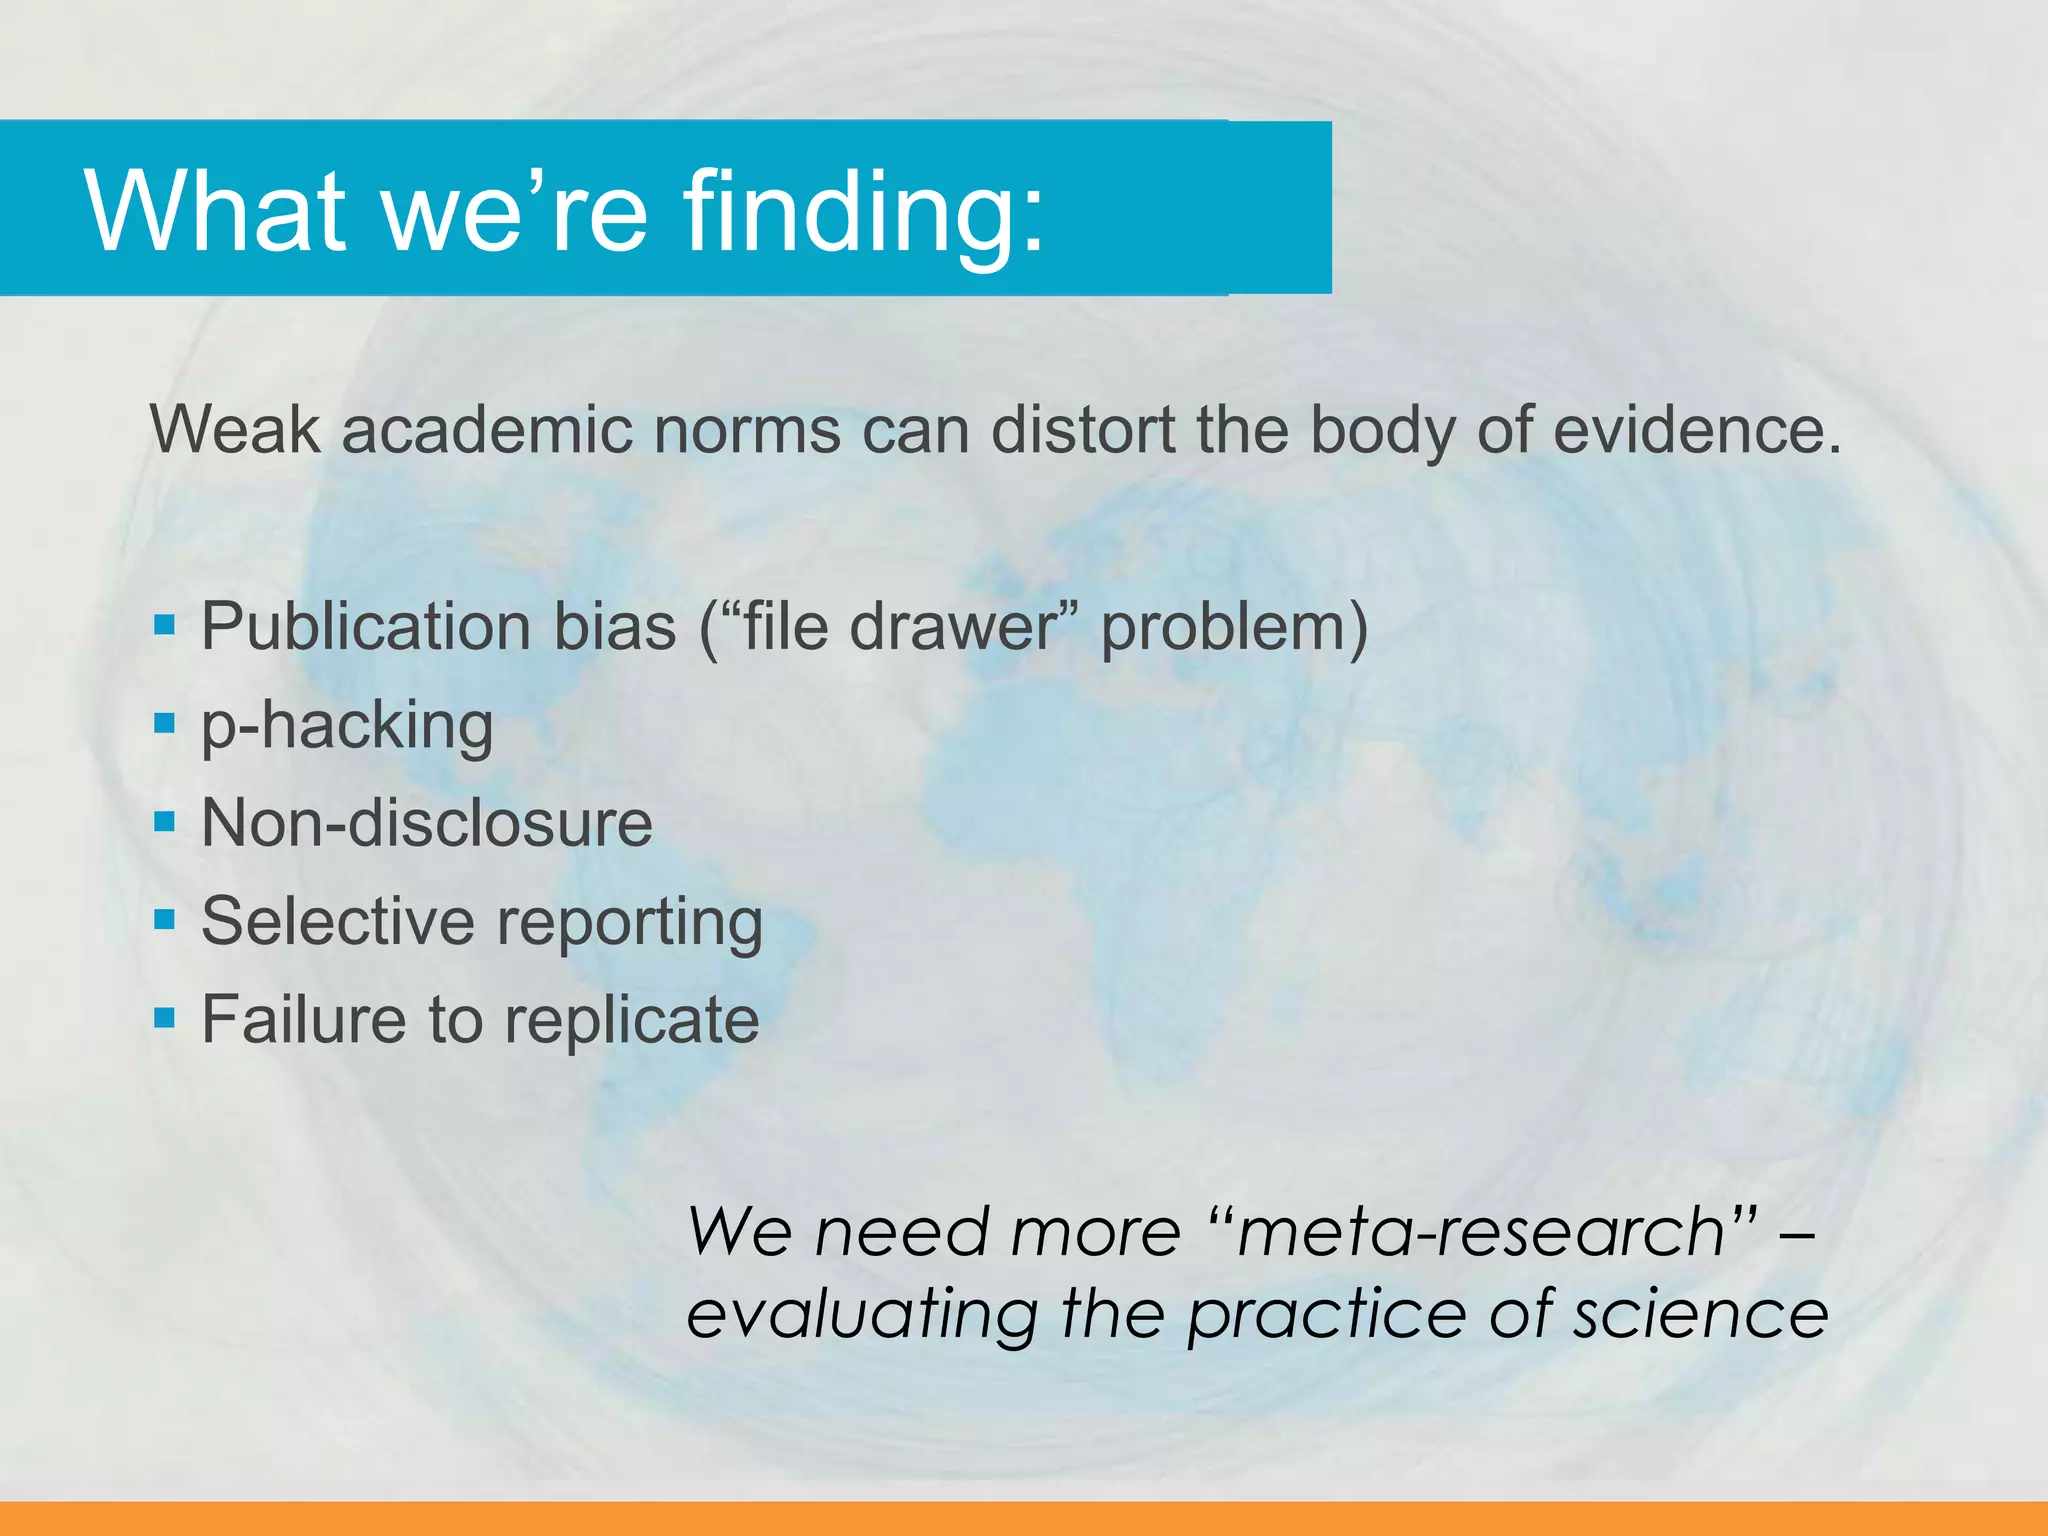
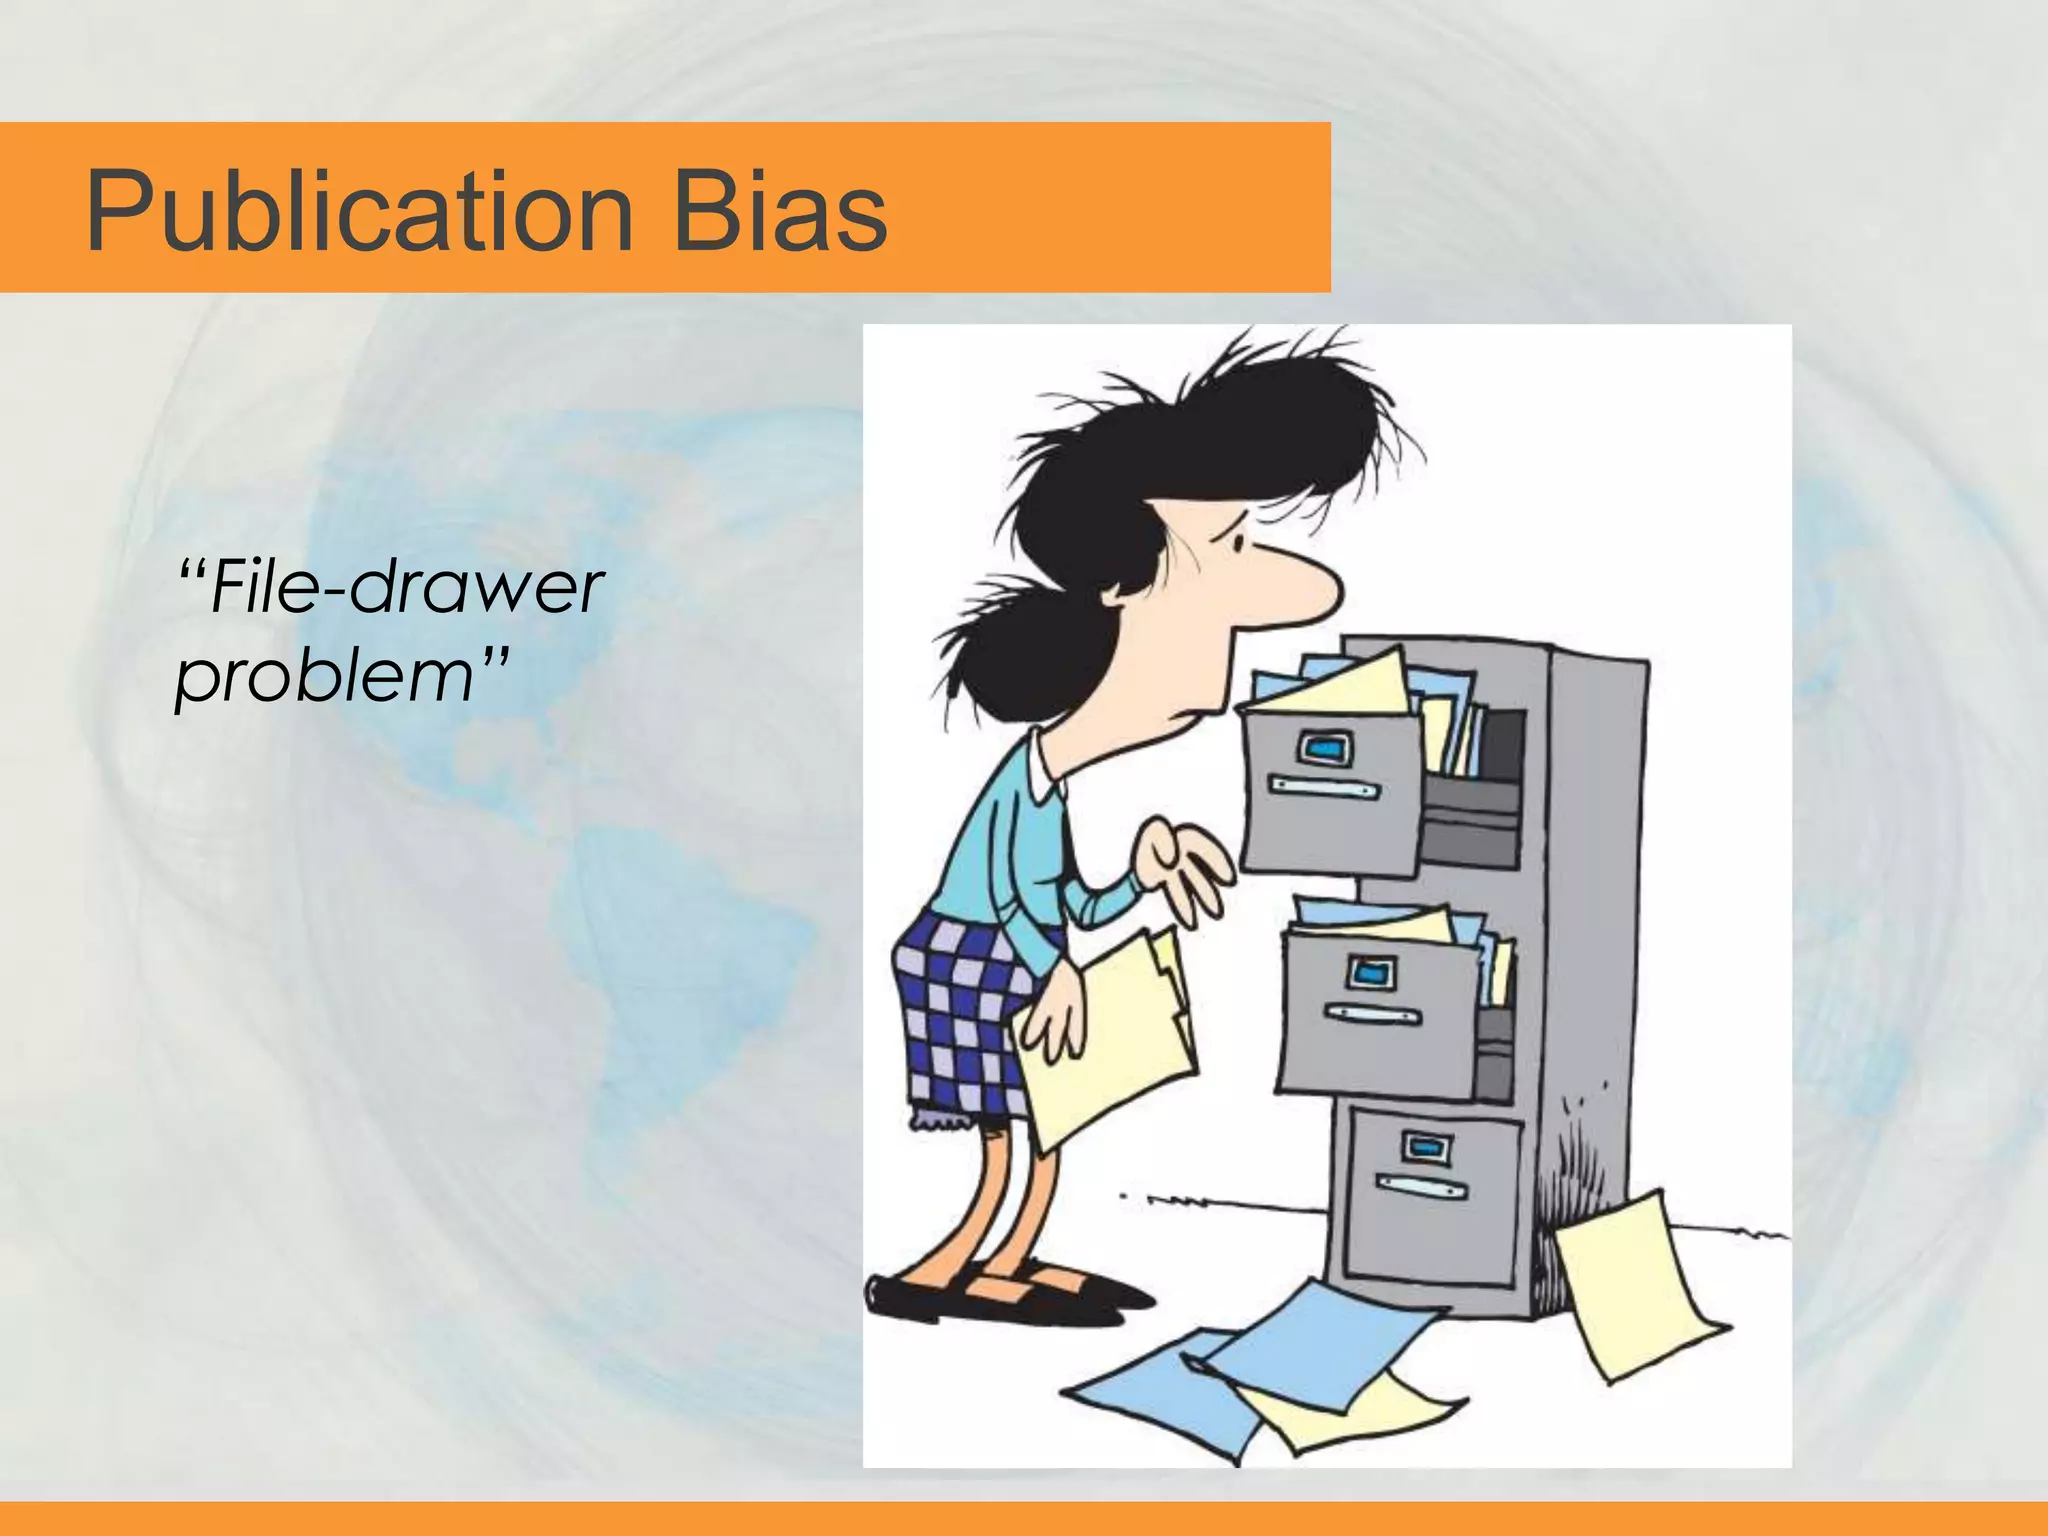
The document discusses issues with transparency and reproducibility in social science research. It notes that research influences policy and decisions that affect millions of lives. However, weak academic norms like publication bias, p-hacking, non-disclosure, and failure to replicate can distort the body of evidence. The document proposes solutions like pre-registering studies and pre-specifying analyses to address these issues. It also discusses resources and efforts like the Berkeley Initiative for Transparency in the Social Sciences to raise awareness, foster adoption of transparent practices, and identify strategies to improve reproducibility.