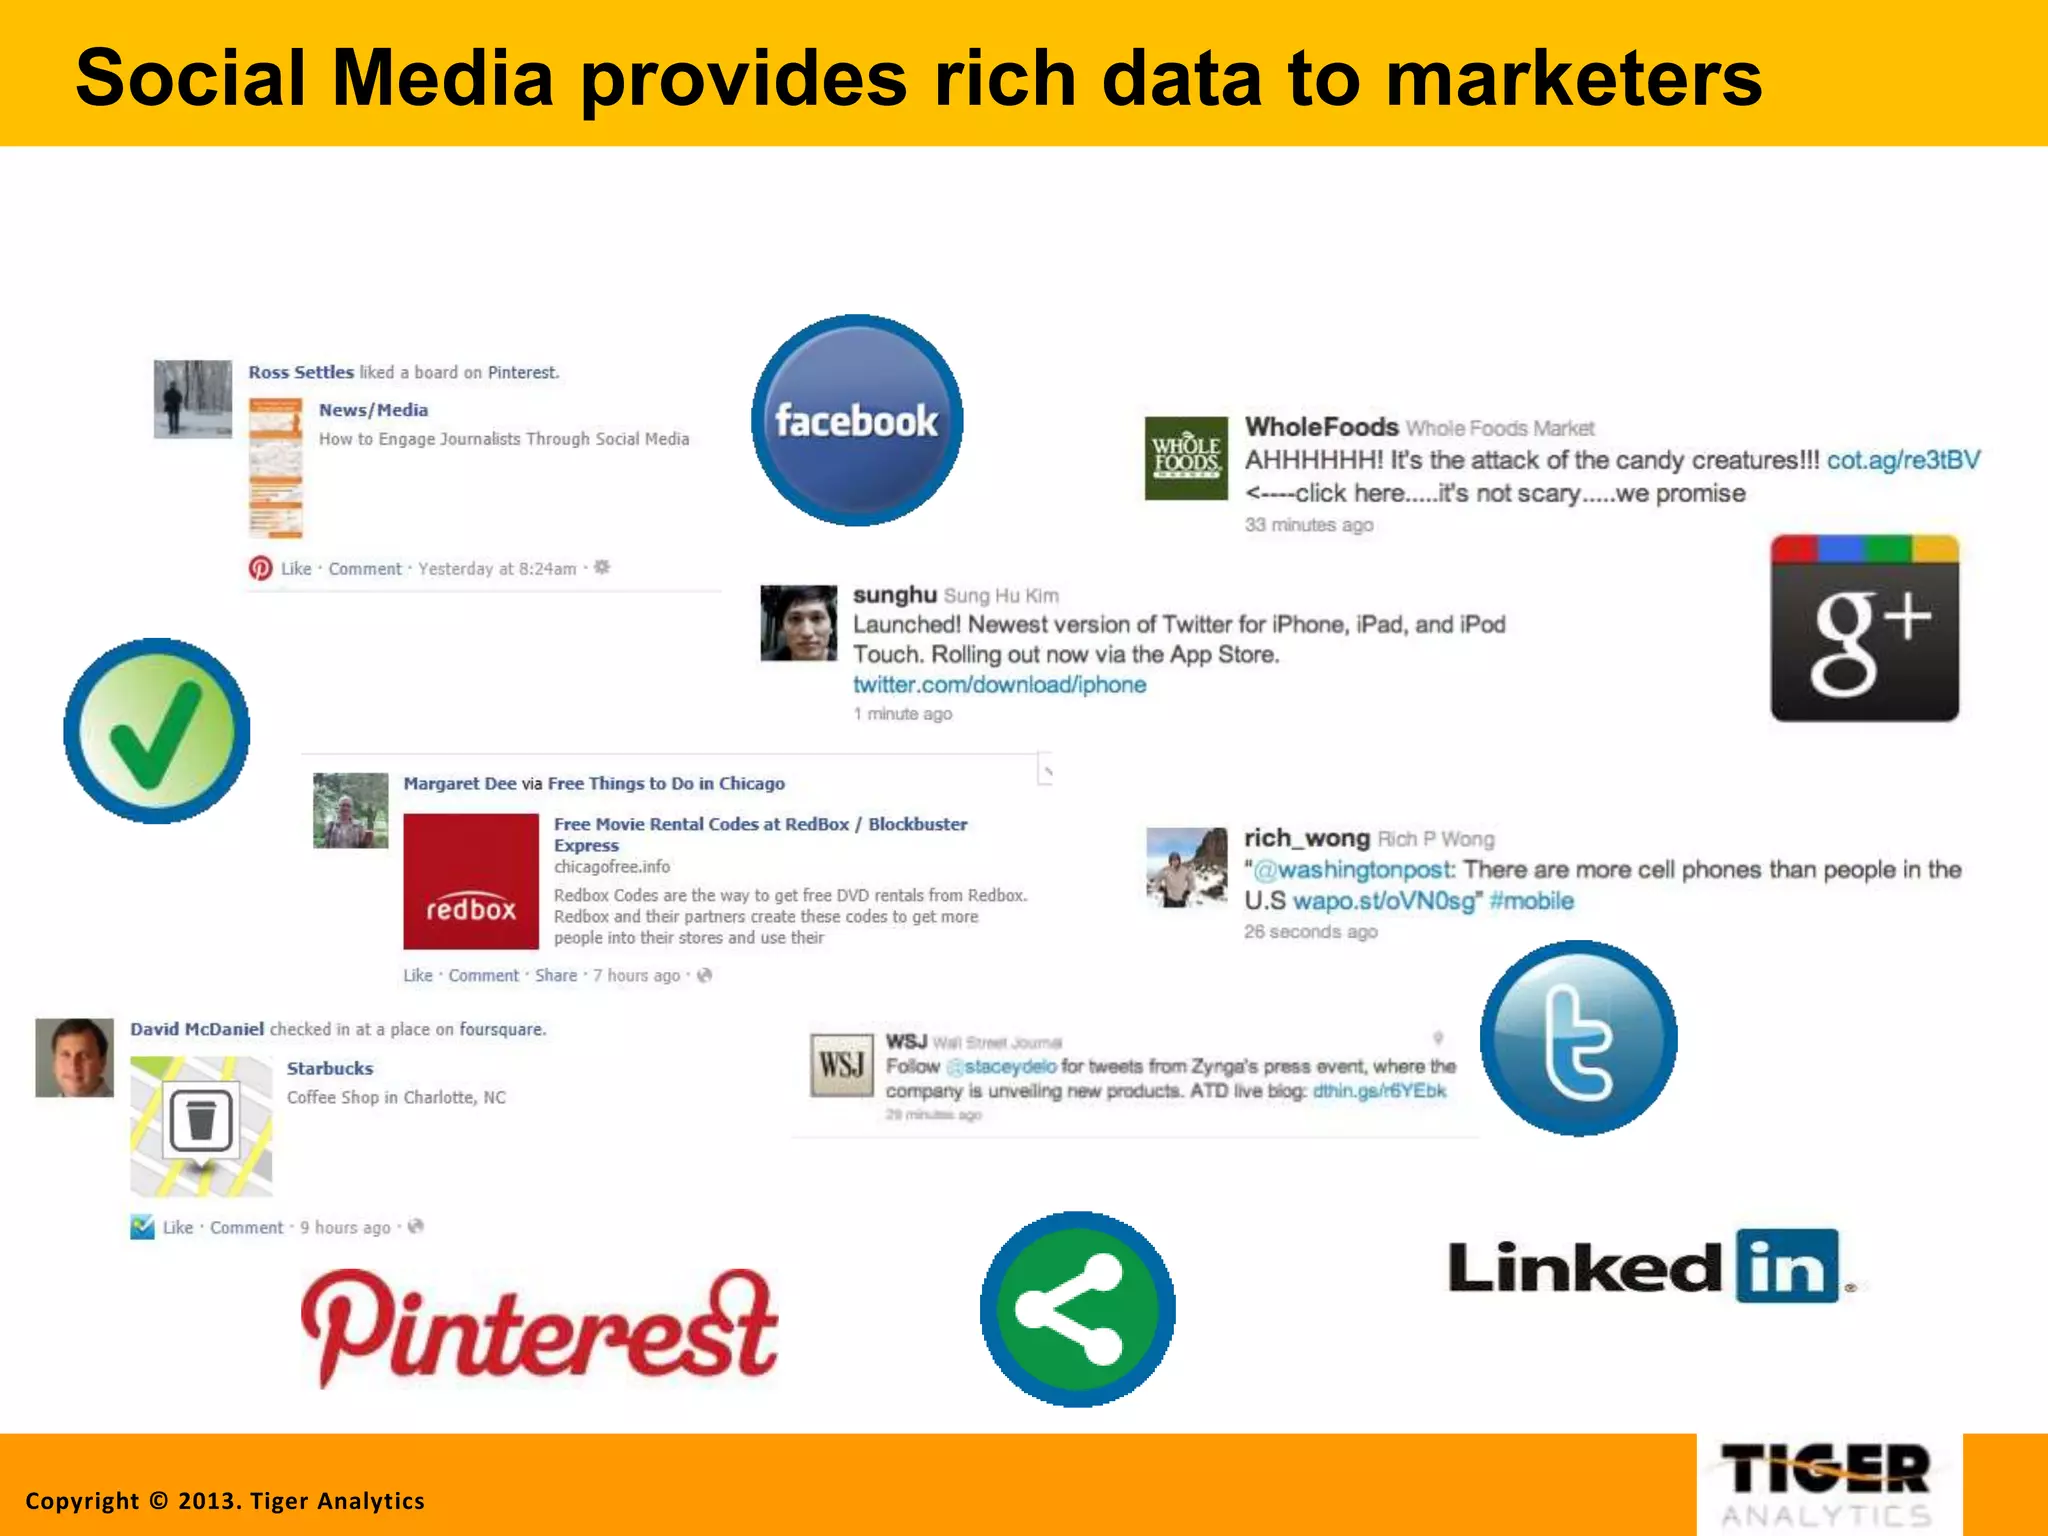
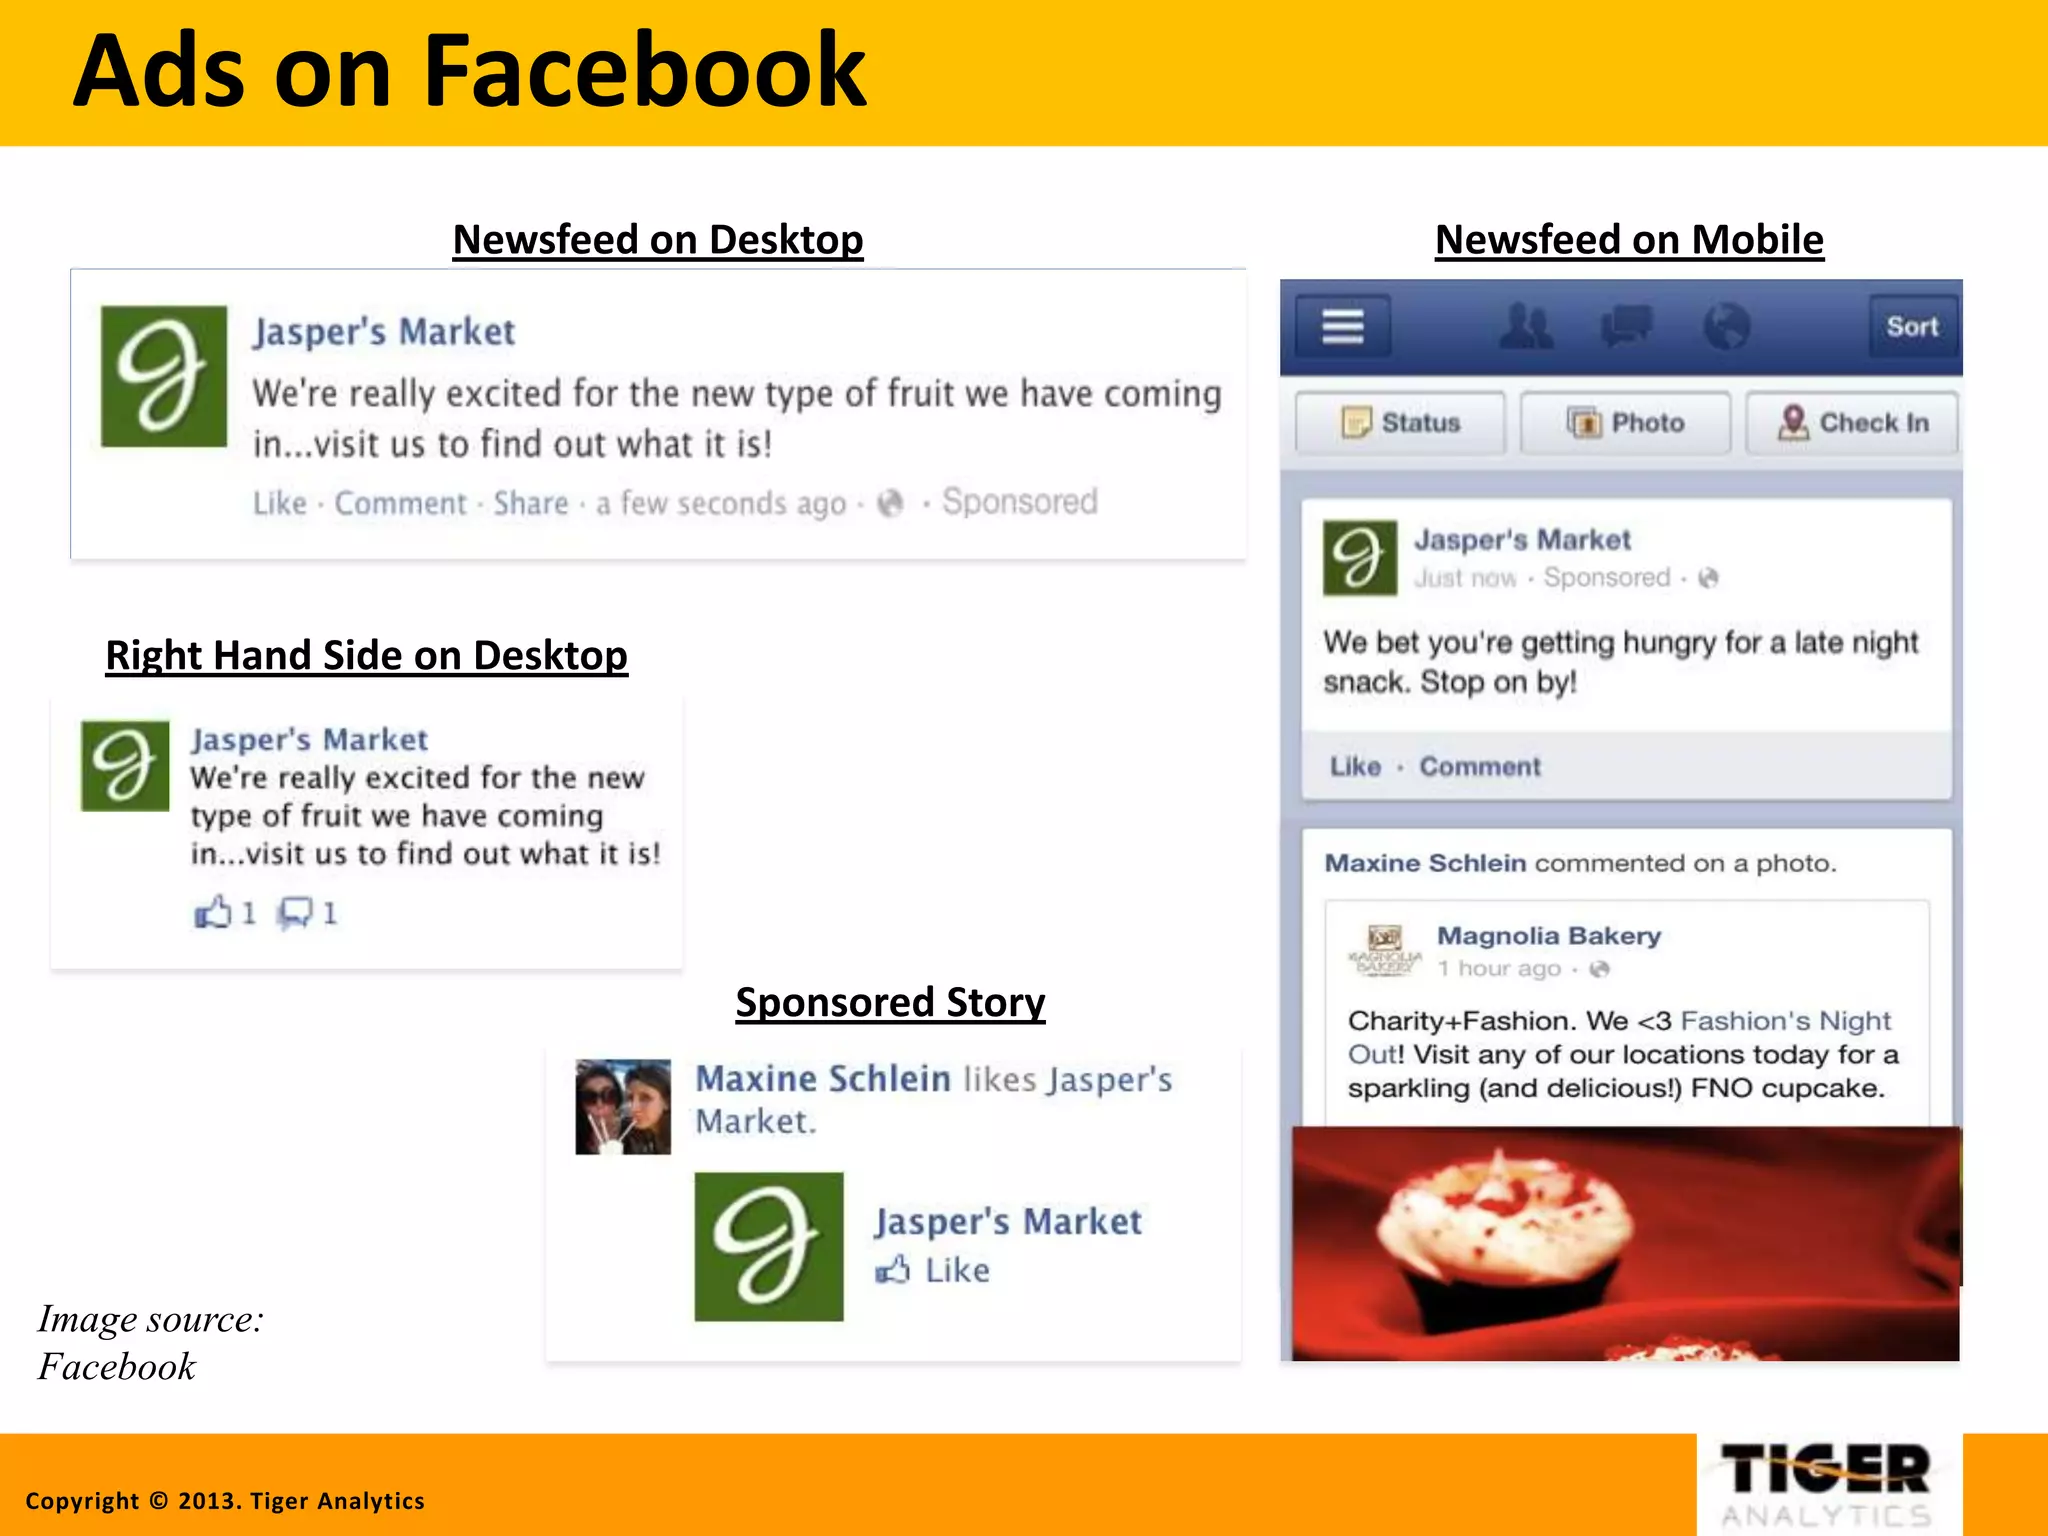
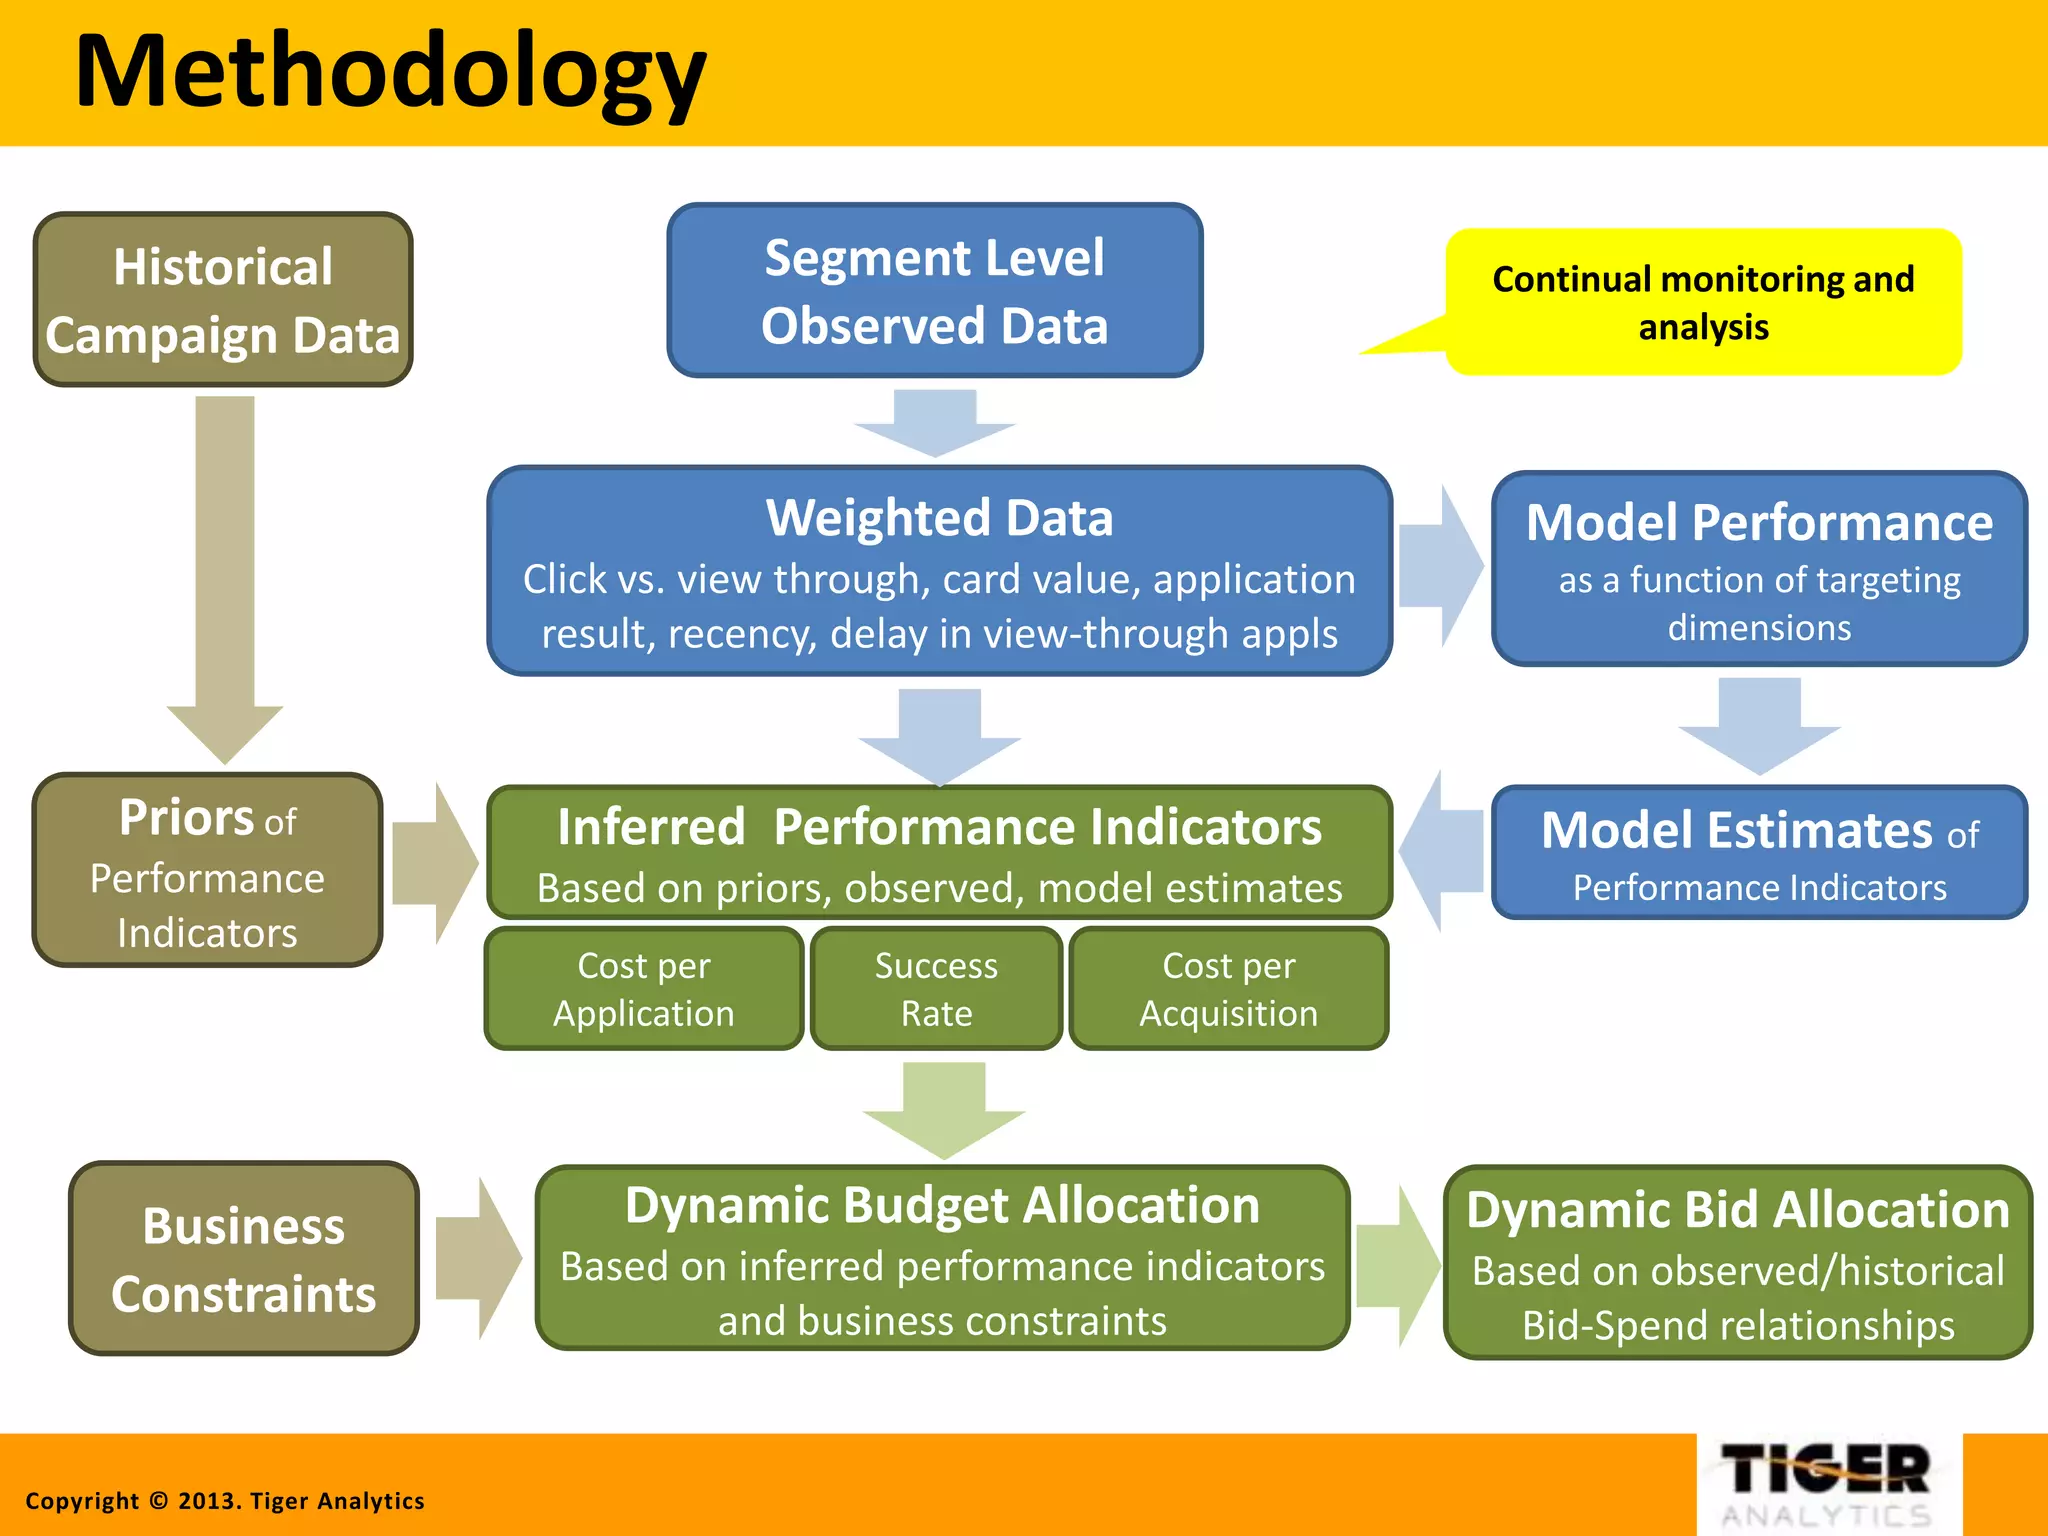
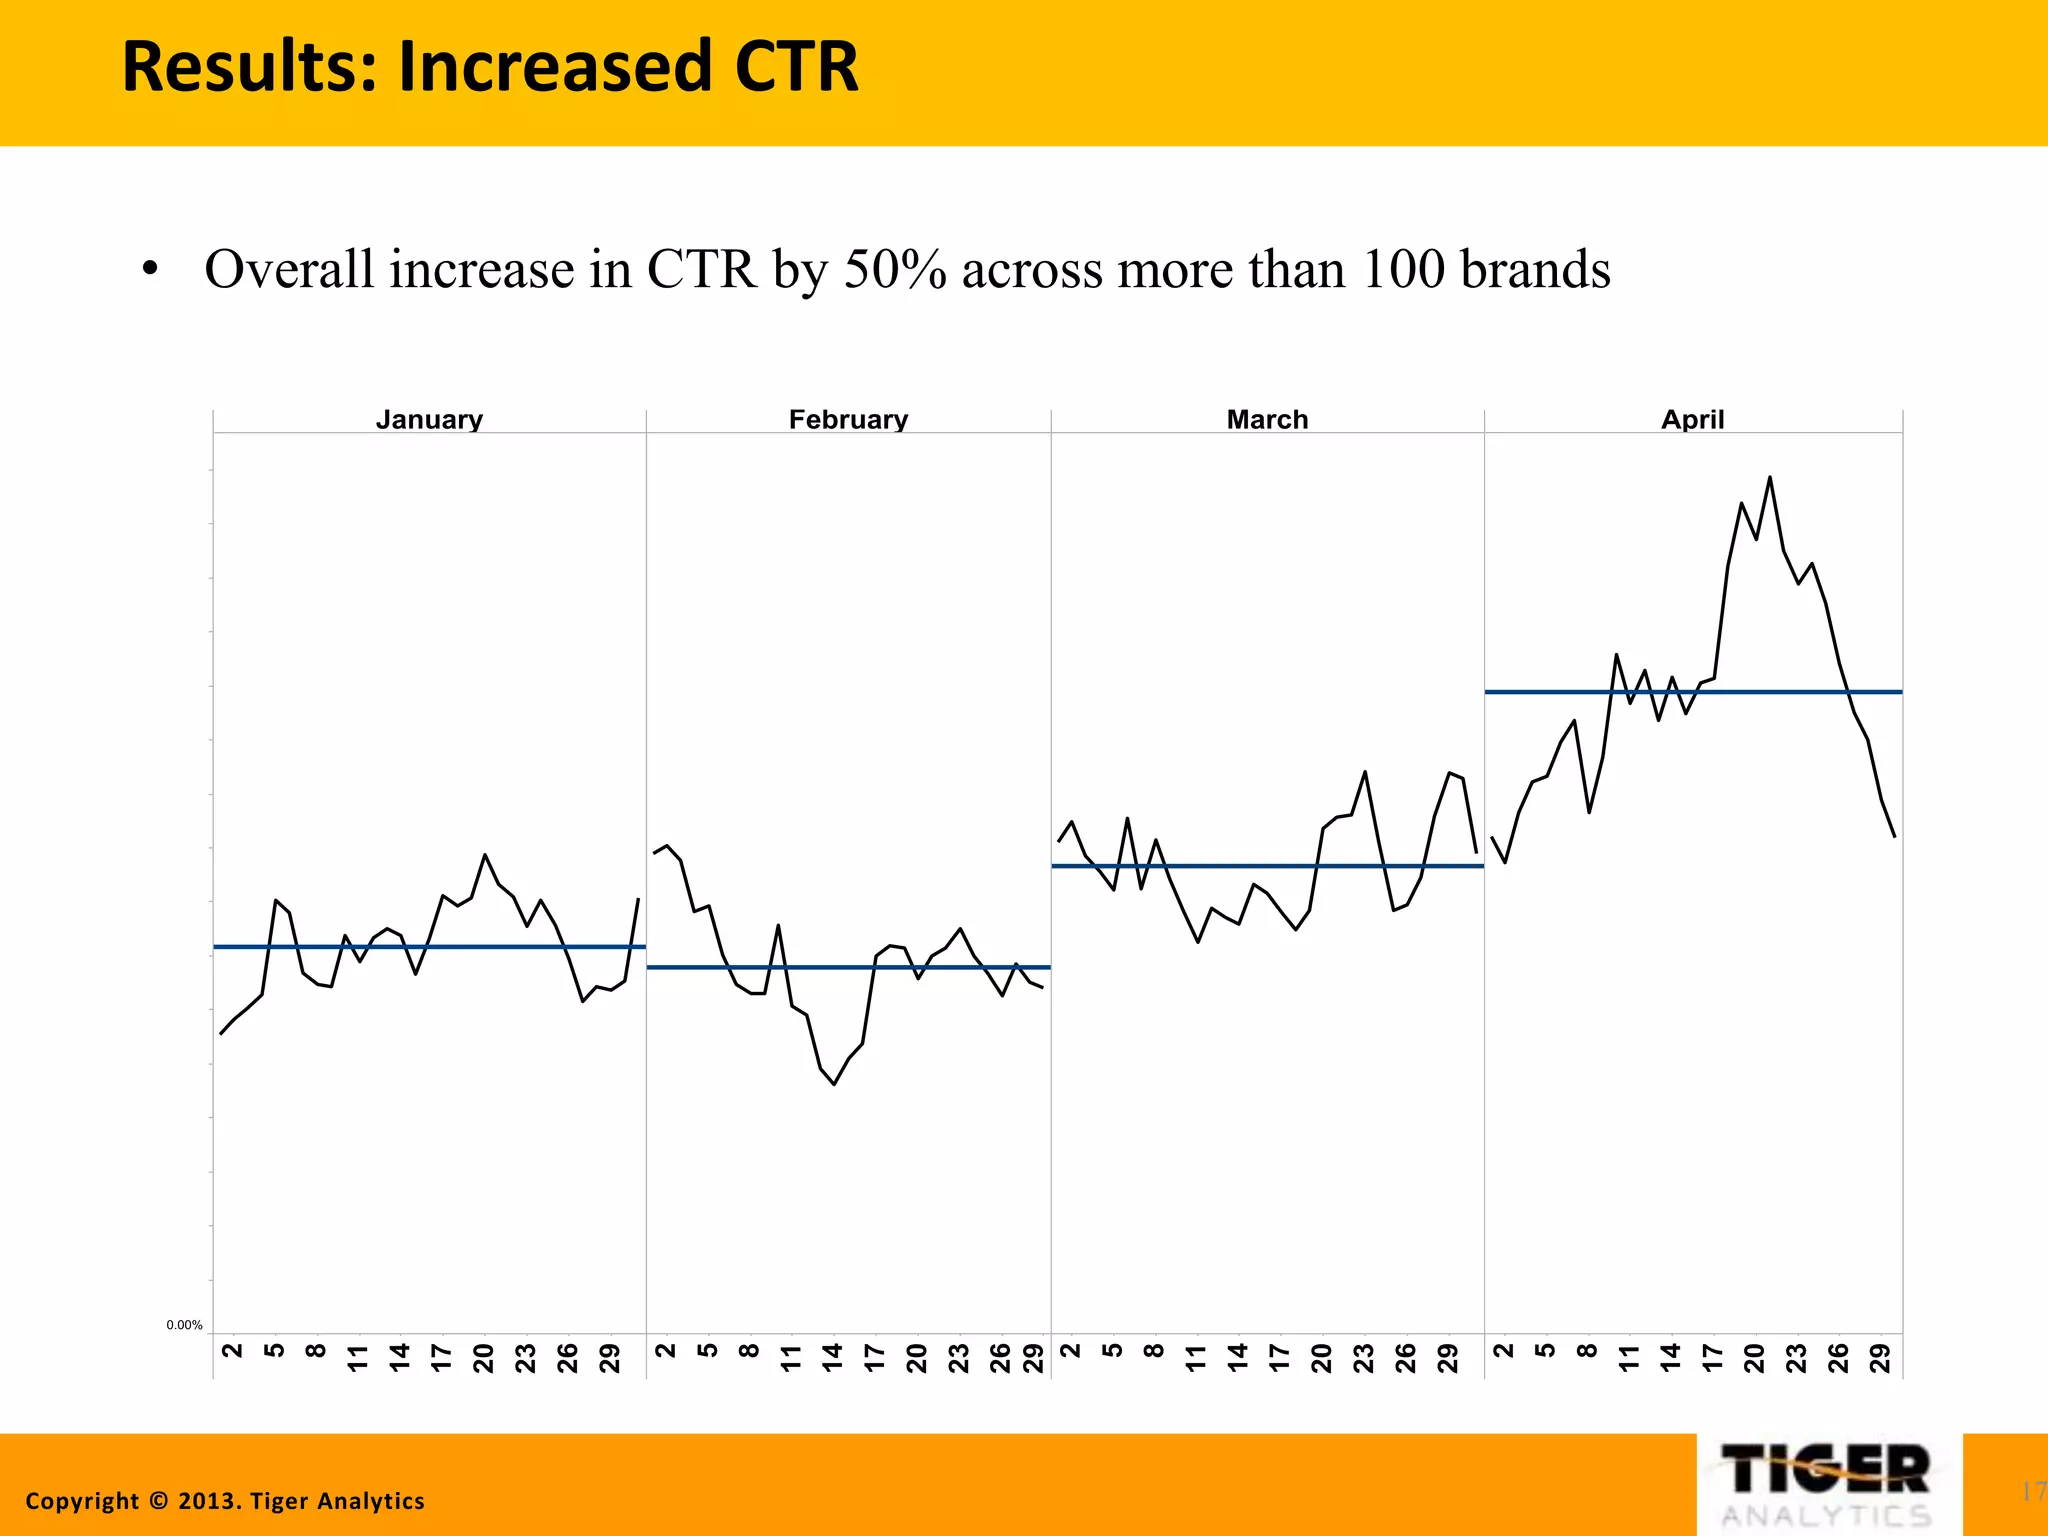
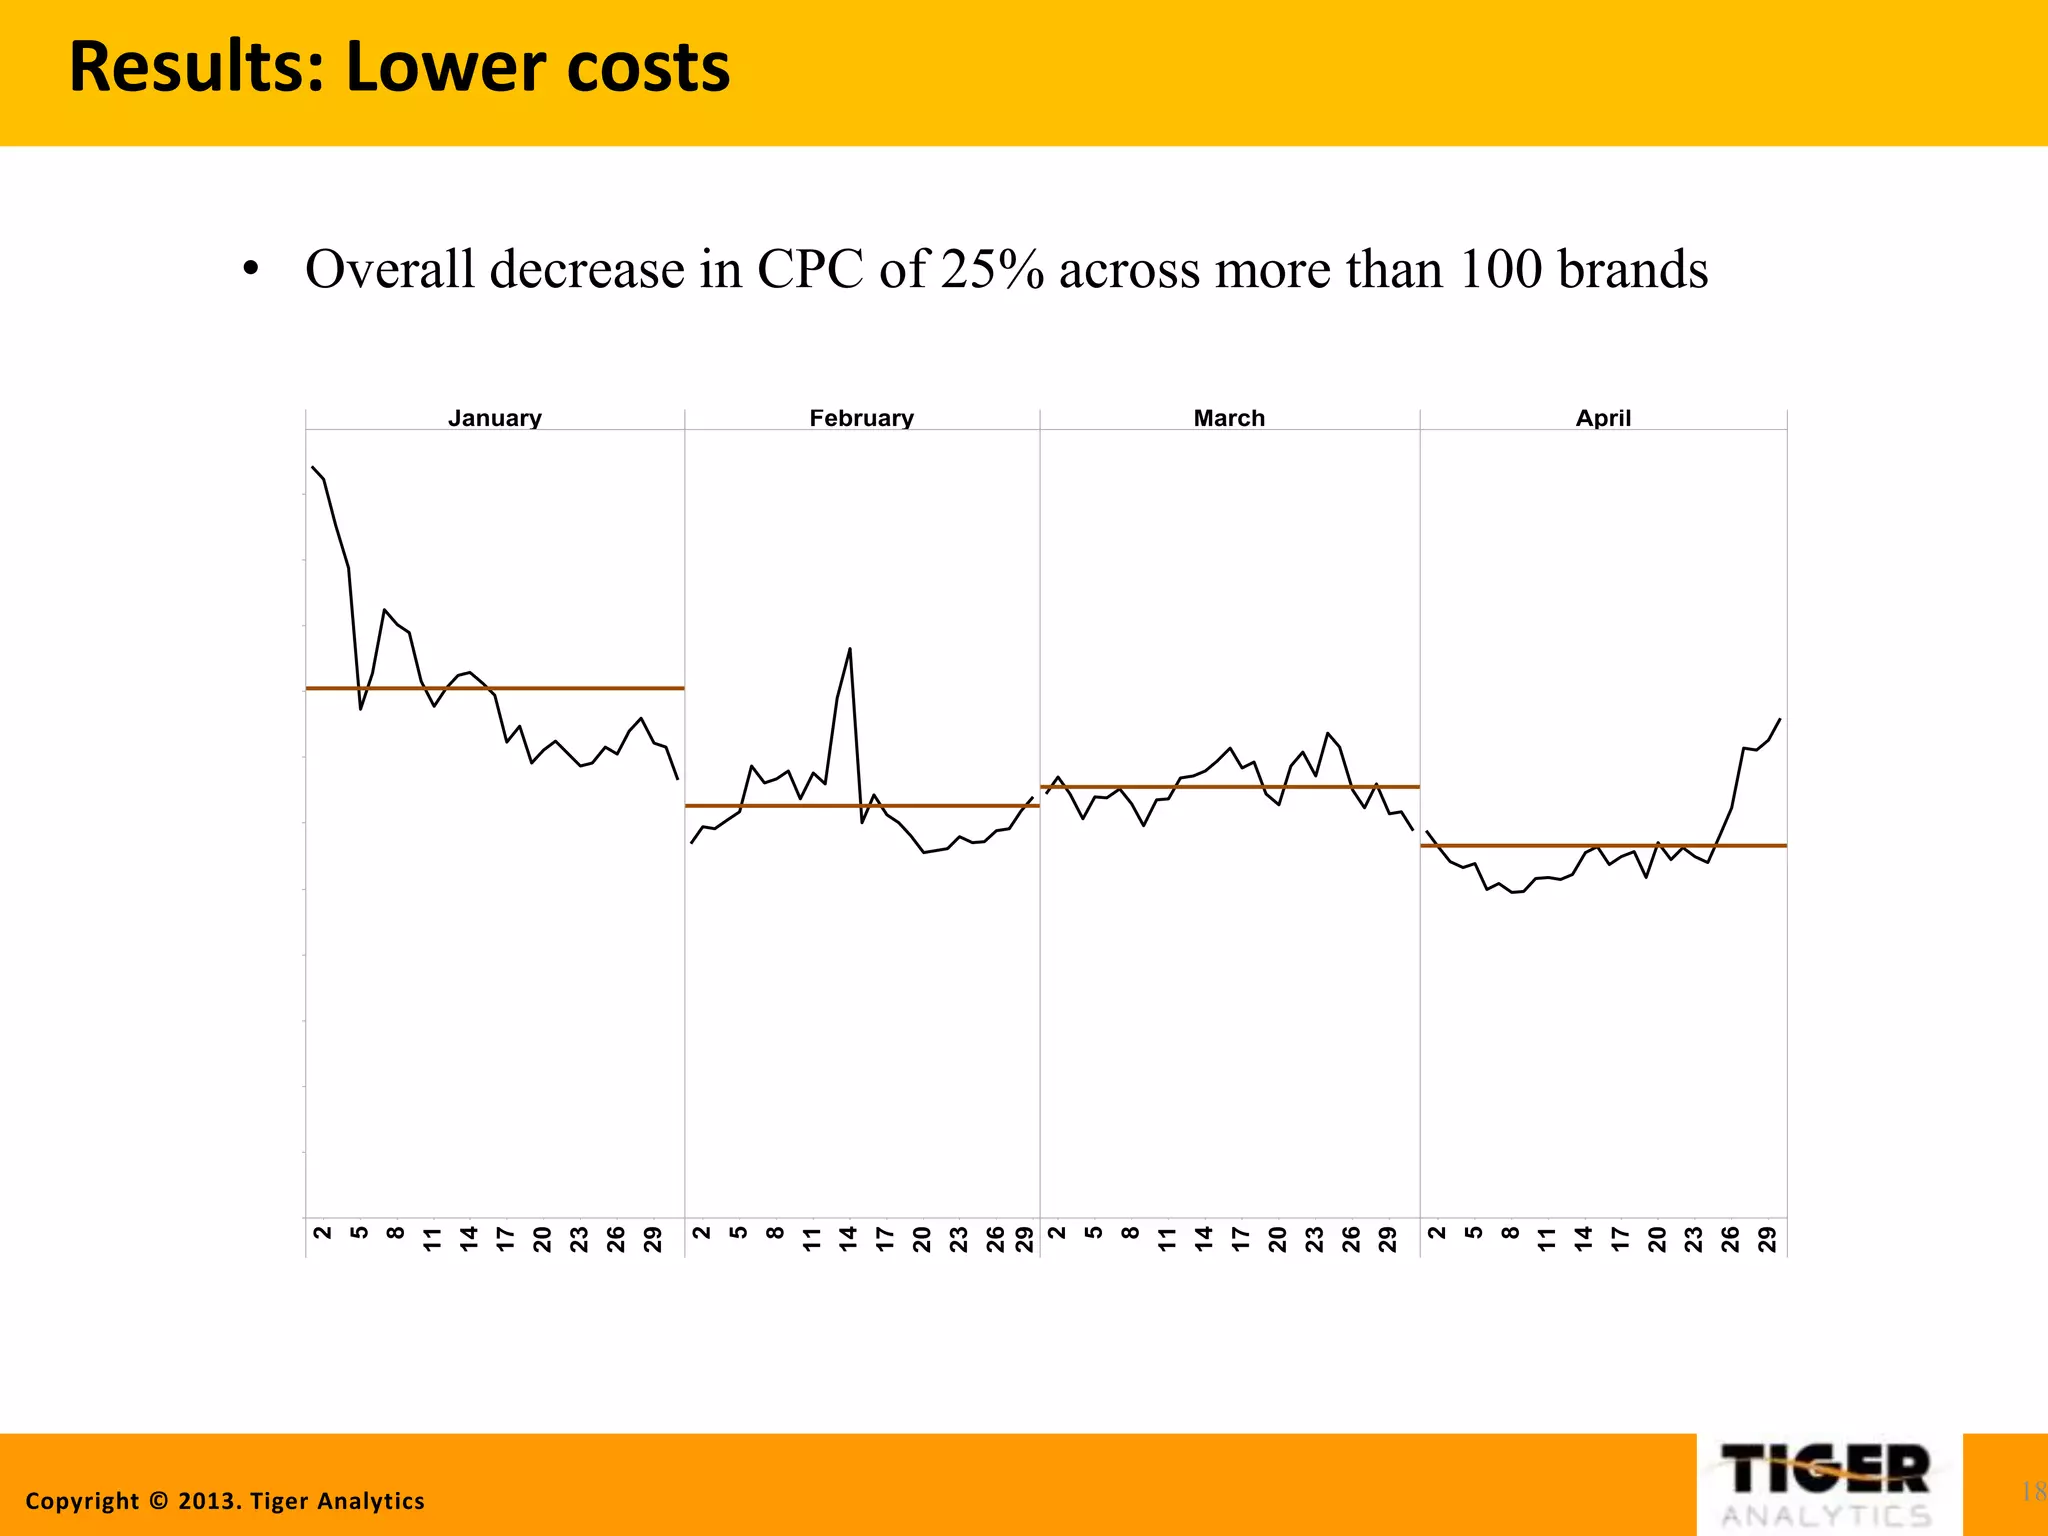
Copyright © 2013. Tiger Analytics
Predictive Analytics in Social Media
and Online Display Advertising
_________________________
Mahesh Kumar
CEO, Tiger Analytics
April 8th, 2013
_________________________
Co-authors: Pradeep Gulipalli, Satish Vutukuru
Copyright © 2013. Tiger Analytics
Tiger Analytics
• Boutique consulting firm solving business problems using
advanced data analytics
• Focus areas
– Digital advertising and Social Media marketing
– Retail merchandising
– Transportation
• Team of 20 people based in California, North Carolina, and
India
Copyright © 2013. Tiger Analytics
Social Media provides rich data to marketers
Copyright © 2013. Tiger Analytics
Ads on Facebook
Newsfeed on Desktop Newsfeed on Mobile
Right Hand Side on Desktop
Sponsored Story
Image source:
Facebook
Copyright © 2013. Tiger Analytics
Facebook Ad Platform -- targeting
5
Copyright © 2013. Tiger Analytics
CTR and the Size of Audience Vary Inversely
6
• Broadly defined interests result in low CTR.
• Narrowly defined precise targets can generate high CTRs.
Sports
Basketball
NBA
Lakers
Kobe Bryant
Kings
Football
NFL College High School
Low CTR
High CTR
Copyright © 2013. Tiger Analytics
Maximizing the CTR is Critical For Cost Optimization
7
High CTR is good for everyone: users, advertiser, and publisher
High
CTR
Relevant content
for Users
Revenue
maximization for
Publisher
Relevant
audience for
Advertiser
Copyright © 2013. Tiger Analytics
Case study: credit card marketing
Cash Back
1,000,000
Impressions
300
Clicks
3
Applications
1
Approval
Conversions are rare events when compared to clicks. The challenge is to be able to make
meaningful inferences based on very little data, especially early on in the campaign.
Click-through rate
0.03%
Conversion rate
1%
Approval rate
33%
Copyright © 2013. Tiger Analytics
Background
• Objective: Given a target budget, maximize the number of
approved customers
• Separate budget for 5 different credit cards in the US
• Each card has different value
• Account for cross-conversions
• Two bidding methods
– Cost per click (CPC)
– Cost per impression (CPM)
Copyright © 2013. Tiger Analytics
Cross-conversions
 Impression shown and application filled need not be for the
same card
Ad for Card 1
Ad for Card 2
Application for Card 1
Application for Card 2
Application for Card 3
Copyright © 2013. Tiger Analytics
Micro Segments
1 Segment 50 Segments
50 x 2 =
100 Segments
2 Genders 4 Age Groups
100 x 4 =
400 Segments
25 Interest Clusters
400 x 25 =
10,000 Segments
Copyright © 2013. Tiger Analytics
Methodology
• Identify high performance segments
– Statistically significant difference in ctr, cpc, cost per conversion, etc.
– Use ctr as a proxy for conversion rate
• Actions on high performance segments
– Allocate higher budget
– Increase bid price
12
Copyright © 2013. Tiger Analytics
Segment performance estimation
Model Estimates
Observed Performance
Prior Knowledge
Inferred Performance
Copyright © 2013. Tiger Analytics
Bidding
Brand A
Brand B
Other Competition for Ad Space
Bid: $1.60
Bids
WIN
Bids will differ by Ad and Micro
segment, and will change over
time
Copyright © 2013. Tiger Analytics
Budget Allocation
• Increase budget for high
performance segments and reduce
for low performance ones
– Business rules around minimum
and maximum limits
• Constrained Multi-Armed Bandit
Problem
Copyright © 2013. Tiger Analytics
Methodology
Segment Level
Observed Data
Inferred Performance Indicators
Based on priors, observed, model estimates
Cost per
Application
Success
Rate
Dynamic Budget Allocation
Based on inferred performance indicators
and business constraints
Historical
Campaign Data
Priorsof
Performance
Indicators
Weighted Data
Click vs. view through, card value, application
result, recency, delay in view-through appls
Cost per
Acquisition
Model Performance
as a function of targeting
dimensions
Model Estimates of
Performance Indicators
Dynamic Bid Allocation
Based on observed/historical
Bid-Spend relationships
Continual monitoring and
analysis
Business
Constraints
Copyright © 2013. Tiger Analytics
Results: Increased CTR
17
• Overall increase in CTR by 50% across more than 100 brands
Copyright © 2013. Tiger Analytics
Results: Lower costs
18
• Overall decrease in CPC of 25% across more than 100 brands
Copyright © 2013. Tiger Analytics
Concluding remarks
• Online and social advertising are fast growing areas with
– Plenty of data
– A large number of interesting problems
• Predictive analytics can add a lot value in this business
– Significant improvement in CTR means better targeted ads
– As much as 25% reduction in cost of media
• Our solutions are being used by several leading startups to
serve billions of ads for Fortune 500 companies
19
Copyright © 2013. Tiger Analytics
Questions / Comments ?
mahesh@tigeranalytics.com
www.tigeranalytics.com
20

Open analytics summit nyc

  • 1.
    Copyright © 2013.Tiger Analytics Predictive Analytics in Social Media and Online Display Advertising _________________________ Mahesh Kumar CEO, Tiger Analytics April 8th, 2013 _________________________ Co-authors: Pradeep Gulipalli, Satish Vutukuru
  • 2.
    Copyright © 2013.Tiger Analytics Tiger Analytics • Boutique consulting firm solving business problems using advanced data analytics • Focus areas – Digital advertising and Social Media marketing – Retail merchandising – Transportation • Team of 20 people based in California, North Carolina, and India
  • 3.
    Copyright © 2013.Tiger Analytics Social Media provides rich data to marketers
  • 4.
    Copyright © 2013.Tiger Analytics Ads on Facebook Newsfeed on Desktop Newsfeed on Mobile Right Hand Side on Desktop Sponsored Story Image source: Facebook
  • 5.
    Copyright © 2013.Tiger Analytics Facebook Ad Platform -- targeting 5
  • 6.
    Copyright © 2013.Tiger Analytics CTR and the Size of Audience Vary Inversely 6 • Broadly defined interests result in low CTR. • Narrowly defined precise targets can generate high CTRs. Sports Basketball NBA Lakers Kobe Bryant Kings Football NFL College High School Low CTR High CTR
  • 7.
    Copyright © 2013.Tiger Analytics Maximizing the CTR is Critical For Cost Optimization 7 High CTR is good for everyone: users, advertiser, and publisher High CTR Relevant content for Users Revenue maximization for Publisher Relevant audience for Advertiser
  • 8.
    Copyright © 2013.Tiger Analytics Case study: credit card marketing Cash Back 1,000,000 Impressions 300 Clicks 3 Applications 1 Approval Conversions are rare events when compared to clicks. The challenge is to be able to make meaningful inferences based on very little data, especially early on in the campaign. Click-through rate 0.03% Conversion rate 1% Approval rate 33%
  • 9.
    Copyright © 2013.Tiger Analytics Background • Objective: Given a target budget, maximize the number of approved customers • Separate budget for 5 different credit cards in the US • Each card has different value • Account for cross-conversions • Two bidding methods – Cost per click (CPC) – Cost per impression (CPM)
  • 10.
    Copyright © 2013.Tiger Analytics Cross-conversions  Impression shown and application filled need not be for the same card Ad for Card 1 Ad for Card 2 Application for Card 1 Application for Card 2 Application for Card 3
  • 11.
    Copyright © 2013.Tiger Analytics Micro Segments 1 Segment 50 Segments 50 x 2 = 100 Segments 2 Genders 4 Age Groups 100 x 4 = 400 Segments 25 Interest Clusters 400 x 25 = 10,000 Segments
  • 12.
    Copyright © 2013.Tiger Analytics Methodology • Identify high performance segments – Statistically significant difference in ctr, cpc, cost per conversion, etc. – Use ctr as a proxy for conversion rate • Actions on high performance segments – Allocate higher budget – Increase bid price 12
  • 13.
    Copyright © 2013.Tiger Analytics Segment performance estimation Model Estimates Observed Performance Prior Knowledge Inferred Performance
  • 14.
    Copyright © 2013.Tiger Analytics Bidding Brand A Brand B Other Competition for Ad Space Bid: $1.60 Bids WIN Bids will differ by Ad and Micro segment, and will change over time
  • 15.
    Copyright © 2013.Tiger Analytics Budget Allocation • Increase budget for high performance segments and reduce for low performance ones – Business rules around minimum and maximum limits • Constrained Multi-Armed Bandit Problem
  • 16.
    Copyright © 2013.Tiger Analytics Methodology Segment Level Observed Data Inferred Performance Indicators Based on priors, observed, model estimates Cost per Application Success Rate Dynamic Budget Allocation Based on inferred performance indicators and business constraints Historical Campaign Data Priorsof Performance Indicators Weighted Data Click vs. view through, card value, application result, recency, delay in view-through appls Cost per Acquisition Model Performance as a function of targeting dimensions Model Estimates of Performance Indicators Dynamic Bid Allocation Based on observed/historical Bid-Spend relationships Continual monitoring and analysis Business Constraints
  • 17.
    Copyright © 2013.Tiger Analytics Results: Increased CTR 17 • Overall increase in CTR by 50% across more than 100 brands
  • 18.
    Copyright © 2013.Tiger Analytics Results: Lower costs 18 • Overall decrease in CPC of 25% across more than 100 brands
  • 19.
    Copyright © 2013.Tiger Analytics Concluding remarks • Online and social advertising are fast growing areas with – Plenty of data – A large number of interesting problems • Predictive analytics can add a lot value in this business – Significant improvement in CTR means better targeted ads – As much as 25% reduction in cost of media • Our solutions are being used by several leading startups to serve billions of ads for Fortune 500 companies 19
  • 20.
    Copyright © 2013.Tiger Analytics Questions / Comments ? mahesh@tigeranalytics.com www.tigeranalytics.com 20

Editor's Notes

  • #4 Facebook alone has 845 Million users, very significant reach and comparable to TV, but it is coupled with interactivity. You can now have a dialogue with customers and build a story around your brand with social. Almost 4 billion pieces of content shared each week
  • #8 CTR is a Not a sole predictor of social media campaign, but from cost perspective, CTR optimizes. CTR best metric for optimization.