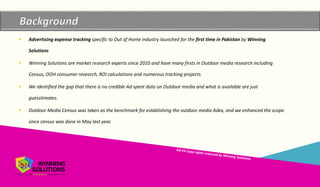
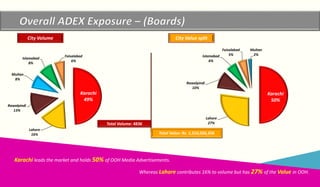
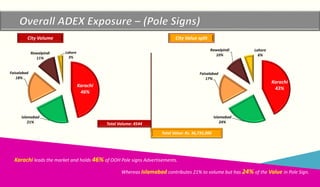
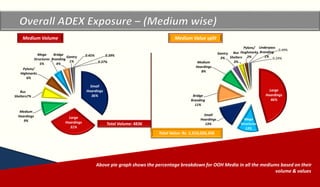
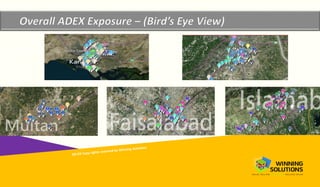
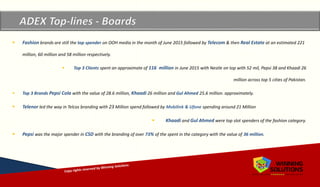
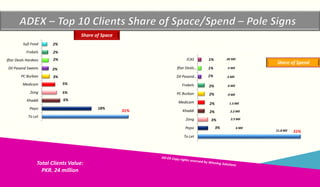
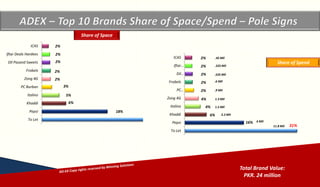
Karachi Lahore Islamabad/Rawalpindi Faisalabad Multan
Copyrights reserved by Winning Solutions 2015
Copyright Winning Solutions 2015
 Advertising expense tracking specific to Out of Home industry launched for the first time in Pakistan by Winning
Solutions
 Winning Solutions are market research experts since 2010 and have many firsts in Outdoor media research including
Census, OOH consumer research, ROI calculations and numerous tracking projects.
 We identified the gap that there is no credible Ad spent data on Outdoor media and what is available are just
guesstimates.
 Outdoor Media Census was taken as the benchmark for establishing the outdoor media Adex, and we enhanced the scope
since census was done in May last year.
Copyrights reserved by Winning Solutions 2015
Copyright Winning Solutions 2015
 We have covered over 5000 permanent sites covering almost 145 main arteries across top 5 cities of Pakistan.
 All the sites were covered twice in a month (once every fortnight) to ensure that we have covered the full month
display period twice.
 Data was collected only from Permanent OOH structures on the identified roads.
 Approximately 4000+ Pole signs data was also collected across Top-5 cities.
 Values are estimated with average market rates collected for different mediums across different roads and
locations from various OMAS. No discount factors are applied as they vary from agency to agency and client to
client.
Copyrights reserved by Winning Solutions 2015
Copyright Winning Solutions 2015
Total Volume: 4836
City Volume
Total Value: Rs. 1,510,026,356
City Value split
Karachi leads the market and holds 50% of OOH Media Advertisements.
Whereas Lahore contributes 16% to volume but has 27% of the Value in OOH.
Karachi
49%
Lahore
16%
Rawalpindi
13%
Multan
8%
Islamabad
8%
Faisalabad
6%
Karachi
50%
Lahore
27%
Rawalpindi
10%
Islamabad
6%
Faisalabad
5%
Multan
2%
Copyright Winning Solutions 2015
Total Volume: 4544
City Volume
Total Value: Rs. 36,735,000
City Value split
Karachi leads the market and holds 46% of OOH Pole signs Advertisements.
Whereas Islamabad contributes 21% to volume but has 24% of the Value in Pole Sign.
Karachi
46%
Islamabad
21%
Faisalabad
18%
Rawalpindi
11%
Lahore
3%
Karachi
43%
Islamabad
24%
Faisalabad
17%
Rawalpindi
10%
Lahore
6%
Copyrights reserved by Winning Solutions 2015
Copyright Winning Solutions 2015
Total Volume: 4836
Medium Volume
Total Value: Rs. 1,510,026,356
Medium Value split
Above pie graph shows the percentage breakdown for OOH Media in all the mediums based on their
volume & values
Small
Hoardings
36%
Large
Hoardings
31%
Medium
Hoardings
9%
Bus
Shelters7%
Pylons/
Highmarks
6%
Mega
Structures
5%
Bridge
Branding
4%
Gantry
1%
0.45% 0.39%
0.37%
Large
Hoardings
46%
Mega
Structures
13%
Small
Hoardings
13%
Bridge
Branding
11%
Medium
Hoardings
8%
Gantry
3%
Bus
Shelters
3%
Pylons/
Hughmarks
2%
Underpass
Branding
1%
0.49%
0.24%
Copyrights reserved by Winning Solutions 2015
Copyright Winning Solutions 2015
Copyrights reserved by Winning Solutions 2015
Copyright Winning Solutions 2015
 Fashion brands are still the top spender on OOH media in the month of June 2015 followed by Telecom & then Real Estate at an estimated 221
million, 60 million and 58 million respectively.
 Top 3 Clients spent an approximate of 116 million in June 2015 with Nestle on top with 52 mil, Pepsi 38 and Khaadi 26
million across top 5 cities of Pakistan.
 Top 3 Brands Pepsi Cola with the value of 28.6 million, Khaadi 26 million and Gul Ahmed 25.6 million. approximately.
 Telenor led the way in Telcos branding with 23 Million spend followed by Mobilink & Ufone spending around 21 Million
 Khaadi and Gul Ahmed were top slot spenders of the fashion category.
 Pepsi was the major spender in CSD with the branding of over 73% of the spent in the category with the value of 36 million.
Copyrights reserved by Winning Solutions 2015
Copyright Winning Solutions 2015
30%
15%
4%
4%
3%
3%
3%
2%
2%
2%
TO LET
Fashion
Telecom
Real…
CSD
Juices & Beverages
Fast Food/…
Mobile Phones
Home Appliances…
Frozen Food
30%
12%
6%
5%
4%
3%
3%
3%
2%
2%
TO LET
Fashion
Education
Real…
Tea & Coffee
Fast Food/…
Juices &…
Telecom
Ghee & Cooking…
Home…
Share of Space
Share of Spend
Total Category Value:
PKR. 1 billion
221 Mil
59.9 Mil
57.9 Mil
49.5 Mil
46.6 Mil
45.6 Mil
34.5 Mil
33.8 Mil
29.9 Mil
Copyrights reserved by Winning Solutions 2015
Copyright Winning Solutions 2015
30%
3%
3%
2%
2%
2%
2%
1%
1%
1%
To Let
Nestle
Pepsi Co Pakistan
Khaadi
Gul Ahmed…
Telenor
Unilever…
Mondelez
Junaid Jamshed…
Lu-Continental…
30%
2%
1%
1%
1%
1%
1%
1%
1%
1%
To Let
Pepsi Co Pakistan
Nestle
Mohammad Hashim Tajir Surma
Eastern Productions
Tapal Tea Pvt Ltd
Gul Ahmed Textile Mills Ltd
Khaadi
Unilever Pakistan Ltd
Junaid Jamshed Pvt Ltd
Share of Space
Share of Spend
Total Clients Value:
PKR. 1 billion
51.8 Mil
38 Mil
26 Mil
25.6 Mil
22.6 Mil
22.6 Mil
21.9 Mil
20.5 Mil
20.2 Mil
Copyrights reserved by Winning Solutions 2015
Copyright Winning Solutions 2015
Total Brand Value:
PKR. 1 billion
30%
2%
2%
2%
1%
1%
1%
1%
1%
1%
To Let
Pepsi Cola
Khaadi
Gul Ahmed
Tang
Nan Khatai
Nestle Pure Life
Pizza Hutt
J.J Summer…
Maggi Noodles
1%
1%
1%
1%
1%
1%
1%
1%
1%
To Let
Vital Tea
Gul Ahmed
Khaadi
Tapal Family Mixture
Pepsi Cola
Fruitien Juice
Bareeze
Hashmi Ispaghol
Ncr-Cet College
Share of Space
Share of Spend
28.6 Mil
26.2 Mil
25.6 Mil
21.9 Mil
17.9 Mil
15.4 Mil
14.9 Mil
13.7 Mil
13.5 Mil
Copyrights reserved by Winning Solutions 2015
Copyright Winning Solutions 2015
 CSD brands and Fashion brands were the top spenders on Pole signs in the month of June 2015 followed by Telecom at an estimated 5.9 million,
3 million and 2.8 million respectively.
 Top 3 Clients spent an approximate of 10.8 million in June 2015 with Pepsi on top with 6 mil, Zong 2.5 and Khaddi 2.1
million across top 5 cities of Pakistan.
 Top 3 Brands Pepsi Cola with the value of 6 million, Khaadi 2.1 million and Zong4G 13.8 million.
 Khaadi and Gul Ahmed were top slot spenders of the fashion category.
 Pepsi was the major spender in CSD with the branding of over 90% of the spent in the category with the value of 6 million approximately.
Copyrights reserved by Winning Solutions 2015
Copyright Winning Solutions 2015
16%
8%
8%
6%
4%
4%
3%
3%
3%
To Let
CSD
Fashion
Telecom
Educational
Hair care
Frozen Food
Fast Food/Resturant
Hotel
Real estate
31%
18%
9%
6%
6%
5%
4%
3%
3%
3%
To Let
CSD
Fashion
Telecom
Educational
Hair care
Frozen Food
Fast…
Hotel
Real estate
Share of Space
Share of Spend
Total Category Value:
PKR. 24 million
5.9 Mil
3 Mil
2.8 Mil
2 Mil
1.5 Mil
1.3 Mil
1.1 Mil
1 Mil
1 Mil
11.8 Mil
Copyrights reserved by Winning Solutions 2015
Copyright Winning Solutions 2015
31%
3%
3%
2%
2%
2%
2%
1%
1%
1%
To Let
Pepsi
Zong
Khaddi
Medicam
PC Burban
Frobels
Dil Pasand…
Iftar Deals…
ICAS
31%
18%
6%
5%
5%
3%
2%
2%
2%
2%
To Let
Pepsi
Khaddi
Zong
Medicam
PC Burban
Dil Pasand Sweets
Iftar Deals Hardees
Frobels
Sufi Food
Share of Space
Share of Spend
Total Clients Value:
PKR. 24 million
6 Mil
2.5 Mil
2.2 Mil
1.5 Mil
.9 Mil
.6 Mil
.5 Mil
.5 Mil
.45 Mil
11.8 Mil
Copyrights reserved by Winning Solutions 2015
Copyright Winning Solutions 2015
Total Brand Value:
PKR. 24 million
31%
16%
6%
4%
4%
2%
2%
2%
2%
2%
To Let
Pepsi
Khaddi
Italino
Zong 4G
PC…
Frobels
Dil…
Iftar…
ICAS
18%
6%
5%
3%
2%
2%
2%
2%
2%
To Let
Pepsi
Khaddi
Italino
PC Burban
Zong 4G
Frobels
Dil Pasand Sweets
Iftar Deals Hardees
ICAS
Share of Space
Share of Spend
6 Mil
2.2 Mil
1.5 Mil
1.3 Mil
.9 Mil
.6 Mil
.525 Mil
.525 Mil
.45 Mil
11.8 Mil
Copyrights reserved by Winning Solutions 2015
Copyright Winning Solutions 2015
For Details or Subscription Contact:
Syed Ali Moazzam ali.moazzam@winningsolutions.com.pk
CEO 0345-8591450
Farnaz Ghufran farnaz.ghufran@winningsolutions.com.pk
Resident Head Karachi 0345-8591465
M. Tanveer Ahmed tanveer.ahmed@winningsolutions.com.pk
Senior Research Executive 0345-8591454

OOH Media AdEx Report June 2015

  • 1.
  • 2.
    Copyrights reserved byWinning Solutions 2015 Copyright Winning Solutions 2015  Advertising expense tracking specific to Out of Home industry launched for the first time in Pakistan by Winning Solutions  Winning Solutions are market research experts since 2010 and have many firsts in Outdoor media research including Census, OOH consumer research, ROI calculations and numerous tracking projects.  We identified the gap that there is no credible Ad spent data on Outdoor media and what is available are just guesstimates.  Outdoor Media Census was taken as the benchmark for establishing the outdoor media Adex, and we enhanced the scope since census was done in May last year.
  • 3.
    Copyrights reserved byWinning Solutions 2015 Copyright Winning Solutions 2015  We have covered over 5000 permanent sites covering almost 145 main arteries across top 5 cities of Pakistan.  All the sites were covered twice in a month (once every fortnight) to ensure that we have covered the full month display period twice.  Data was collected only from Permanent OOH structures on the identified roads.  Approximately 4000+ Pole signs data was also collected across Top-5 cities.  Values are estimated with average market rates collected for different mediums across different roads and locations from various OMAS. No discount factors are applied as they vary from agency to agency and client to client.
  • 4.
    Copyrights reserved byWinning Solutions 2015 Copyright Winning Solutions 2015
  • 5.
    Copyright Winning Solutions2015 Total Volume: 4836 City Volume Total Value: Rs. 1,510,026,356 City Value split Karachi leads the market and holds 50% of OOH Media Advertisements. Whereas Lahore contributes 16% to volume but has 27% of the Value in OOH. Karachi 49% Lahore 16% Rawalpindi 13% Multan 8% Islamabad 8% Faisalabad 6% Karachi 50% Lahore 27% Rawalpindi 10% Islamabad 6% Faisalabad 5% Multan 2%
  • 6.
    Copyright Winning Solutions2015 Total Volume: 4544 City Volume Total Value: Rs. 36,735,000 City Value split Karachi leads the market and holds 46% of OOH Pole signs Advertisements. Whereas Islamabad contributes 21% to volume but has 24% of the Value in Pole Sign. Karachi 46% Islamabad 21% Faisalabad 18% Rawalpindi 11% Lahore 3% Karachi 43% Islamabad 24% Faisalabad 17% Rawalpindi 10% Lahore 6%
  • 7.
    Copyrights reserved byWinning Solutions 2015 Copyright Winning Solutions 2015 Total Volume: 4836 Medium Volume Total Value: Rs. 1,510,026,356 Medium Value split Above pie graph shows the percentage breakdown for OOH Media in all the mediums based on their volume & values Small Hoardings 36% Large Hoardings 31% Medium Hoardings 9% Bus Shelters7% Pylons/ Highmarks 6% Mega Structures 5% Bridge Branding 4% Gantry 1% 0.45% 0.39% 0.37% Large Hoardings 46% Mega Structures 13% Small Hoardings 13% Bridge Branding 11% Medium Hoardings 8% Gantry 3% Bus Shelters 3% Pylons/ Hughmarks 2% Underpass Branding 1% 0.49% 0.24%
  • 8.
    Copyrights reserved byWinning Solutions 2015 Copyright Winning Solutions 2015
  • 9.
    Copyrights reserved byWinning Solutions 2015 Copyright Winning Solutions 2015
  • 10.
    Copyright Winning Solutions2015  Fashion brands are still the top spender on OOH media in the month of June 2015 followed by Telecom & then Real Estate at an estimated 221 million, 60 million and 58 million respectively.  Top 3 Clients spent an approximate of 116 million in June 2015 with Nestle on top with 52 mil, Pepsi 38 and Khaadi 26 million across top 5 cities of Pakistan.  Top 3 Brands Pepsi Cola with the value of 28.6 million, Khaadi 26 million and Gul Ahmed 25.6 million. approximately.  Telenor led the way in Telcos branding with 23 Million spend followed by Mobilink & Ufone spending around 21 Million  Khaadi and Gul Ahmed were top slot spenders of the fashion category.  Pepsi was the major spender in CSD with the branding of over 73% of the spent in the category with the value of 36 million.
  • 11.
    Copyrights reserved byWinning Solutions 2015 Copyright Winning Solutions 2015 30% 15% 4% 4% 3% 3% 3% 2% 2% 2% TO LET Fashion Telecom Real… CSD Juices & Beverages Fast Food/… Mobile Phones Home Appliances… Frozen Food 30% 12% 6% 5% 4% 3% 3% 3% 2% 2% TO LET Fashion Education Real… Tea & Coffee Fast Food/… Juices &… Telecom Ghee & Cooking… Home… Share of Space Share of Spend Total Category Value: PKR. 1 billion 221 Mil 59.9 Mil 57.9 Mil 49.5 Mil 46.6 Mil 45.6 Mil 34.5 Mil 33.8 Mil 29.9 Mil
  • 12.
    Copyrights reserved byWinning Solutions 2015 Copyright Winning Solutions 2015 30% 3% 3% 2% 2% 2% 2% 1% 1% 1% To Let Nestle Pepsi Co Pakistan Khaadi Gul Ahmed… Telenor Unilever… Mondelez Junaid Jamshed… Lu-Continental… 30% 2% 1% 1% 1% 1% 1% 1% 1% 1% To Let Pepsi Co Pakistan Nestle Mohammad Hashim Tajir Surma Eastern Productions Tapal Tea Pvt Ltd Gul Ahmed Textile Mills Ltd Khaadi Unilever Pakistan Ltd Junaid Jamshed Pvt Ltd Share of Space Share of Spend Total Clients Value: PKR. 1 billion 51.8 Mil 38 Mil 26 Mil 25.6 Mil 22.6 Mil 22.6 Mil 21.9 Mil 20.5 Mil 20.2 Mil
  • 13.
    Copyrights reserved byWinning Solutions 2015 Copyright Winning Solutions 2015 Total Brand Value: PKR. 1 billion 30% 2% 2% 2% 1% 1% 1% 1% 1% 1% To Let Pepsi Cola Khaadi Gul Ahmed Tang Nan Khatai Nestle Pure Life Pizza Hutt J.J Summer… Maggi Noodles 1% 1% 1% 1% 1% 1% 1% 1% 1% To Let Vital Tea Gul Ahmed Khaadi Tapal Family Mixture Pepsi Cola Fruitien Juice Bareeze Hashmi Ispaghol Ncr-Cet College Share of Space Share of Spend 28.6 Mil 26.2 Mil 25.6 Mil 21.9 Mil 17.9 Mil 15.4 Mil 14.9 Mil 13.7 Mil 13.5 Mil
  • 14.
    Copyrights reserved byWinning Solutions 2015 Copyright Winning Solutions 2015
  • 15.
    Copyright Winning Solutions2015  CSD brands and Fashion brands were the top spenders on Pole signs in the month of June 2015 followed by Telecom at an estimated 5.9 million, 3 million and 2.8 million respectively.  Top 3 Clients spent an approximate of 10.8 million in June 2015 with Pepsi on top with 6 mil, Zong 2.5 and Khaddi 2.1 million across top 5 cities of Pakistan.  Top 3 Brands Pepsi Cola with the value of 6 million, Khaadi 2.1 million and Zong4G 13.8 million.  Khaadi and Gul Ahmed were top slot spenders of the fashion category.  Pepsi was the major spender in CSD with the branding of over 90% of the spent in the category with the value of 6 million approximately.
  • 16.
    Copyrights reserved byWinning Solutions 2015 Copyright Winning Solutions 2015 16% 8% 8% 6% 4% 4% 3% 3% 3% To Let CSD Fashion Telecom Educational Hair care Frozen Food Fast Food/Resturant Hotel Real estate 31% 18% 9% 6% 6% 5% 4% 3% 3% 3% To Let CSD Fashion Telecom Educational Hair care Frozen Food Fast… Hotel Real estate Share of Space Share of Spend Total Category Value: PKR. 24 million 5.9 Mil 3 Mil 2.8 Mil 2 Mil 1.5 Mil 1.3 Mil 1.1 Mil 1 Mil 1 Mil 11.8 Mil
  • 17.
    Copyrights reserved byWinning Solutions 2015 Copyright Winning Solutions 2015 31% 3% 3% 2% 2% 2% 2% 1% 1% 1% To Let Pepsi Zong Khaddi Medicam PC Burban Frobels Dil Pasand… Iftar Deals… ICAS 31% 18% 6% 5% 5% 3% 2% 2% 2% 2% To Let Pepsi Khaddi Zong Medicam PC Burban Dil Pasand Sweets Iftar Deals Hardees Frobels Sufi Food Share of Space Share of Spend Total Clients Value: PKR. 24 million 6 Mil 2.5 Mil 2.2 Mil 1.5 Mil .9 Mil .6 Mil .5 Mil .5 Mil .45 Mil 11.8 Mil
  • 18.
    Copyrights reserved byWinning Solutions 2015 Copyright Winning Solutions 2015 Total Brand Value: PKR. 24 million 31% 16% 6% 4% 4% 2% 2% 2% 2% 2% To Let Pepsi Khaddi Italino Zong 4G PC… Frobels Dil… Iftar… ICAS 18% 6% 5% 3% 2% 2% 2% 2% 2% To Let Pepsi Khaddi Italino PC Burban Zong 4G Frobels Dil Pasand Sweets Iftar Deals Hardees ICAS Share of Space Share of Spend 6 Mil 2.2 Mil 1.5 Mil 1.3 Mil .9 Mil .6 Mil .525 Mil .525 Mil .45 Mil 11.8 Mil
  • 19.
    Copyrights reserved byWinning Solutions 2015 Copyright Winning Solutions 2015 For Details or Subscription Contact: Syed Ali Moazzam ali.moazzam@winningsolutions.com.pk CEO 0345-8591450 Farnaz Ghufran farnaz.ghufran@winningsolutions.com.pk Resident Head Karachi 0345-8591465 M. Tanveer Ahmed tanveer.ahmed@winningsolutions.com.pk Senior Research Executive 0345-8591454