6
Option A OptionB
2.
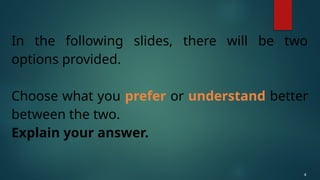
An average person’s balanced diet
should have portions
of go, glow, and grow foods per
plate. Go includes foods
like bread, noodles, and rice. Glow
foods include fruits
and veggies like watermelon,
broccoli, and carrots.
Lastly, grow foods are high in
protein such as fish, eggs, and
7.
7
Option A OptionB
3.
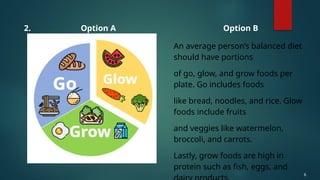
Bob Ong’s novels include
ABNKKBSNPLAko?!, Stainless
Longganisa, Macarthur, and Ang
mga Kaibigan ni Mama Susan.
These are just a few of his works
that portray Filipino culture,
traditions, and comedy.
8.
8
Option A OptionB
4.
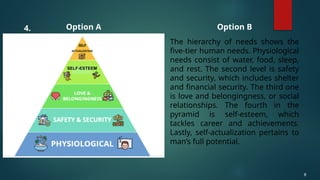
The hierarchy of needs shows the
five-tier human needs. Physiological
needs consist of water, food, sleep,
and rest. The second level is safety
and security, which includes shelter
and financial security. The third one
is love and belongingness, or social
relationships. The fourth in the
pyramid is self-esteem, which
tackles career and achievements.
Lastly, self-actualization pertains to
man’s full potential.
9.
With the givenexercise,
which were you able to
understand better: the
descriptive text, or the
visuals?
9
10.
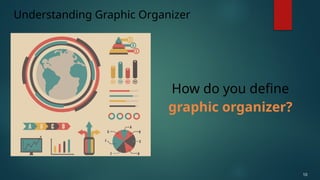
How do youdefine
graphic organizer?
Understanding Graphic Organizer
10
11.
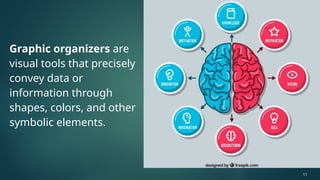
Graphic organizers are
visualtools that precisely
convey data or
information through
shapes, colors, and other
symbolic elements.
11
Graphic organizers varydepending on their
use or purpose. Understanding concepts and
breaking these down into keypoints is
important before converting them into
graphics.
Types of Graphic Organizers
13
14.
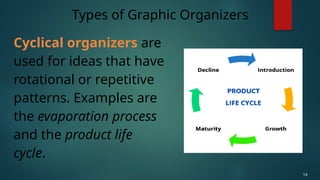
Cyclical organizers are
usedfor ideas that have
rotational or repetitive
patterns. Examples are
the evaporation process
and the product life
cycle.
Types of Graphic Organizers
14
15.
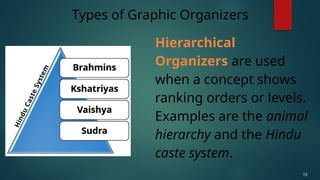
Hierarchical
Organizers are used
whena concept shows
ranking orders or levels.
Examples are the animal
hierarchy and the Hindu
caste system.
Types of Graphic Organizers
15
16.
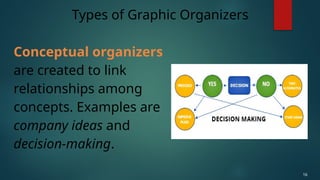
Conceptual organizers
are createdto link
relationships among
concepts. Examples are
company ideas and
decision-making.
Types of Graphic Organizers
16
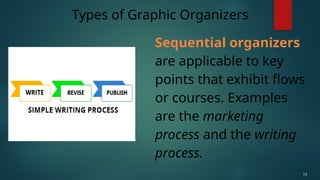
17.
Sequential organizers
are applicableto key
points that exhibit flows
or courses. Examples
are the marketing
process and the writing
process.
Types of Graphic Organizers
17
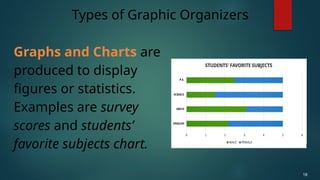
18.
Graphs and Chartsare
produced to display
figures or statistics.
Examples are survey
scores and students’
favorite subjects chart.
Types of Graphic Organizers
18
19.
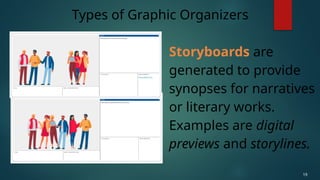
Storyboards are
generated toprovide
synopses for narratives
or literary works.
Examples are digital
previews and storylines.
Types of Graphic Organizers
19
20.
20
There are anumber of graphic
organizers available online.
You can also create your own layout
and design for as long as
it can effectively deliver your message.
21.
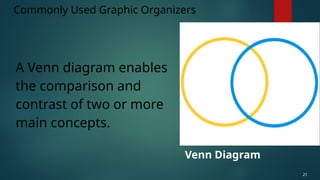
A Venn diagramenables
the comparison and
contrast of two or more
main concepts.
Commonly Used Graphic Organizers
21
Venn Diagram
22.
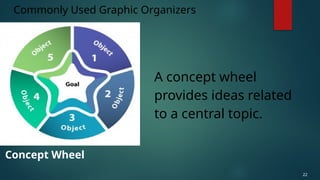
A concept wheel
providesideas related
to a central topic.
Commonly Used Graphic Organizers
22
Concept Wheel
23.
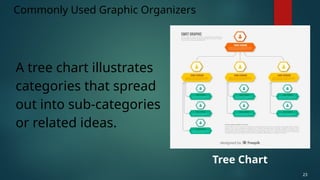
A tree chartillustrates
categories that spread
out into sub-categories
or related ideas.
Commonly Used Graphic Organizers
23
Tree Chart
24.
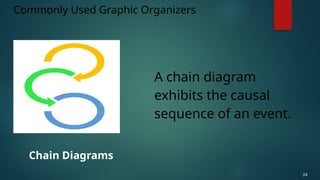
A chain diagram
exhibitsthe causal
sequence of an event.
Commonly Used Graphic Organizers
24
Chain Diagrams
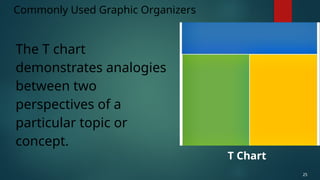
25.
The T chart
demonstratesanalogies
between two
perspectives of a
particular topic or
concept.
Commonly Used Graphic Organizers
25
T Chart
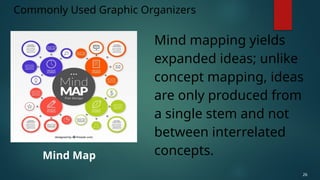
26.
Mind mapping yields
expandedideas; unlike
concept mapping, ideas
are only produced from
a single stem and not
between interrelated
concepts.
Commonly Used Graphic Organizers
26
Mind Map
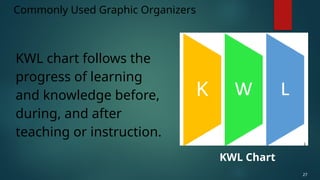
27.
KWL chart followsthe
progress of learning
and knowledge before,
during, and after
teaching or instruction.
Commonly Used Graphic Organizers
27
KWL Chart
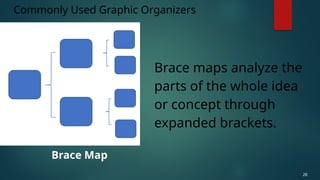
28.
Brace maps analyzethe
parts of the whole idea
or concept through
expanded brackets.
Commonly Used Graphic Organizers
28
Brace Map
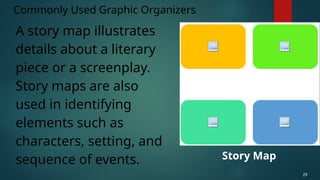
29.
A story mapillustrates
details about a literary
piece or a screenplay.
Story maps are also
used in identifying
elements such as
characters, setting, and
sequence of events.
Commonly Used Graphic Organizers
29
Story Map
43
Cognitive theorists believethat people
learn in an organized and predictable
manner; thus, graphic organizers help
improve retention and retrieval of
information.
44.
Choose among thegiven sets of data in
Option A. Afterwards, select a graphic
organizer among the choices indicated in
Option B and create an example using the
online tools for visualization.
Exercise 1
44
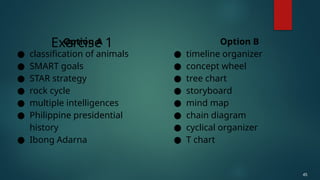
45.
Option A
● classificationof animals
● SMART goals
● STAR strategy
● rock cycle
● multiple intelligences
● Philippine presidential
history
● Ibong Adarna
Exercise 1 Option B
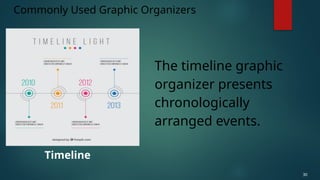
● timeline organizer
● concept wheel
● tree chart
● storyboard
● mind map
● chain diagram
● cyclical organizer
● T chart
45
46.
Exercise 2:
Look fora finished
graphic organizer online.
Improve it by creating
your own version and
then compare the two.
46
Aside from school,
whereelse can you use
graphic organizers, and
for what purpose?
Think Out Loud
49
50.
50
Graphic Organizers
are visualsthat deliver simplified
information.
Basic types of graphic organizers:
Cyclical, Hierarchical, Conceptual,
Sequential, Graphs and Charts, and
Storyboard.
51.
51
Examples of commonlyused graphic
organizers: Venn diagram, Concept Wheel,
Tree Chart, Chain Diagram, T Chart, Mind
Mapping
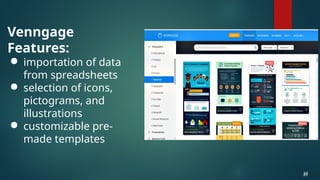
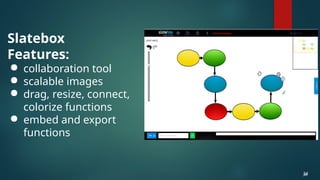
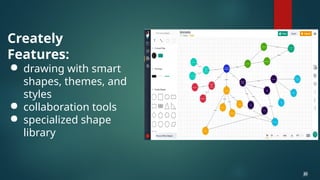
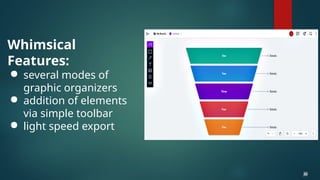
Examples of online platforms with
visualization tools: Venngage, Slatebox,
Creately, Whimsical, Canva
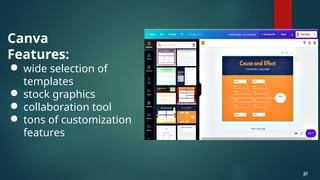
Editor's Notes
#46 Let the students search for a graphic organizer online.
Let them download it for their reference later on.
The students should think of a way in order to improve the graphic organizer either by improving the details or the visuality.
The finished product will be then compared to the searched graphic organizer and the students should be able to pinpoint how it could be more effective.