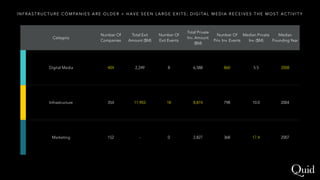
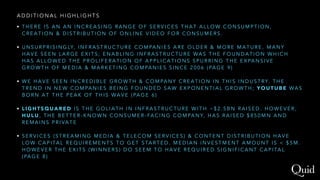
Contact
cconnors@quid.com
+1 503.460.7106
quid.com
@quid
What is Quid? Quid expands your ability to comprehend massive
amounts of information on any given topic. Through interactive visual
maps, we make it easy to navigate your own way through the world’s
collective intelligence and see relationships previously hidden. We
enable you to realize ideas and decisions based on the best information
available, not just what time allows for.
Let’s see how Quid segments the online video
market. We’ll look to find high growth sectors
and whitespace opportunities in this space to
identify signals to give you a competitive edge.
H O W T O : N E T W O R K V I S U A L I Z AT I O N S
Quid reads large volumes of text information and then creates a visual, interactive map which can be used to interpret
hidden relationships and ideas
Each node represents a company;
nodes sized by degree represent the
number of connections that node has
with other nodes (i.e., similarity)
Connections represent similar
language/technology used
across nodes (companies)
A node bridging two clusters can indicate a
company that synthesizes disparate
technologies
Dense clusters contain
highly similar companies
Less distance between clusters
indicates a high number of inter-
related companies/technology
Greater distance between clusters
indicates a low number of inter-
related stories
Centrally located companies are core
to the conversation, indicating core
technology or bridging innovation
Peripheral clusters are
less central to the
conversation but are
more unique
Spread out clusters contain highly
differentiated technology
Similar nodes typically cluster together and
clusters are grouped by color
O N L I N E V I D E O C O M PA N Y L A N D S C A P E
1. Includes companies that were private at any time between January 2010 and May 2015
2. Includes publicly disclosed private investments and market exits between January 2010 and May 2015
Q U I D I D E N T I F I E D R E L AT I O N S H I P S B E T W E E N T H E ~ 9 0 0 C O M PA N I E S B Y
C R E AT I N G A M A P O F R E C E N T O N L I N E V I D E O I N N O VAT I O N
9 1 0 1
C O M PA N I E S W I T H
$ 1 8 B 2
T O TA L I N V E S T M E N T
O N L I N E V I D E O L A N D S C A P E
Q U I D T H E N C R E A T E D A N O N T O L O G Y O F T H E O N L I N E V I D E O S PA C E
(A) Digital Media (44%)
(B) Infrastructure (38%)
(C) Marketing (16%)
A
B
C A T E G O R I E S : H I G H - L E V E L C L A S S I F I C A T I O N
C
D I G I TA L M E D I A ( 4 0 4 )
1. C O N T E N T C R E AT I O N & D I S T R I B U T I O N ( 1 4 4 )
2. S T R E A M I N G M E D I A P L AT F O R M S & S E R V I C E S ( 9 8 )
3. G A M I N G ( 7 0 )
4. C O N T E N T C U R AT I O N & R E C O M M E N D AT I O N ( 6 8 )
5. R I C H M E D I A C O N T E N T & D E L I V E RY ( 2 4 )
I N F R A S T R U C T U R E ( 3 5 4 )
6. S O C I A L V I E W I N G & S H A R I N G ( 9 7 )
7. W I R E L E S S N E T W O R K S & T E L E C O M S E R V I C E S ( 9 4 )
8. E N T E RTA I N M E N T D E V I C E S & O N L I N E V I D E O S E R V I C E S ( 7 0 )
9. C O N T E N T D E L I V E RY ( 4 9 )
10. V I D E O I N F R A S T R U C T U R E & W I R E L E S S S E R V I C E S ( 4 4 )
M A R K E T I N G ( 1 5 2 )
11. V I D E O A D V E RT I S I N G ( 9 2 )
12. M E D I A A N A LY T I C S ( 6 0 )
1
C O M M U N I T I E S : L O W E R - L E V E L C L A S S I F I C A T I O N
O N L I N E V I D E O , G R O U P E D B Y C O M M U N I T Y, S I Z E D B Y
N U M B E R O F C O M PA N I E S , C O L O R E D B Y C A T E G O RY
2
3
4
5
6
7
8
1 0
9
1 1
1 2
3 C A T E G O R I E S W I T H 1 2 G R A N U L A R C O M M U N I T I E S E M E R G E
F O U N D I N G Y E A R D I S T R I B U T I O N Post
20141980
Y O U T U B E ’ S A R R I VA L C A M E A T T H E P E A K O F V I D E O G R O W T H
1990 2000
Pre-
2005Founding Year
Category
Number Of
Companies
Total Exit
Amount ($M)
Number Of
Exit Events
Total Private
Inv. Amount
($M)
Number Of
Priv. Inv. Events
Median Private
Inv. ($M)
Median
Founding Year
Digital Media 404 2,249 8 6,588 860 5.5 2008
Infrastructure 354 11,903 18 8,874 798 10.0 2004
Marketing 152 - 0 2,827 368 17.4 2007
I N F R A S T R U C T U R E C O M PA N I E S A R E O L D E R + H A V E S E E N L A R G E E X I T S ; D I G I TA L M E D I A R E C E I V E S T H E M O S T A C T I V I T Y
Community
Number Of
Companies
Total Exit
Amount ($M)
Number Of Exit
Events
Total Private Inv.
Amount ($M)
Number Of Priv.
Inv. Events
Median Private
Inv. ($M)
Median
Founding Year
Content Creation & Distribution 144 1,318 2 2,953 294 4.7 2008
Streaming Media Platforms & Services 68 - - 878 139 3.1 2008
Gaming 49 - - 911 120 12.7 2005.5
Content Curation & Recommendation 70 - - 871 136 5.2 2007
Rich Media Content & Delivery 70 930 6 1,075 138 8.0 2006
Social Viewing & Sharing 60 - - 960 125 16.5 2006
Wireless Networks & Telecom Services 24 - - 272 55 4.1 2006
Entertainment Devices & Online Video
Services
97 5,577 6 1,614 226 9.3 2004
Content Delivery 98 - - 1,411 234 7.4 2009
Video Infrastructure & Wireless Services 92 - - 1,867 243 18.2 2007
Video Advertising 44 4,078 8 1,022 141 24.5 2001
Media Analytics 94 2,248 4 4,455 175 17.0 2002
S T R E A M I N G M E D I A P L A T F O R M S H A V E L O W E S T E N T RY C A P I TA L C O S T S ; M E D I A A N A LY T I C S S E E S T H E M O S T I N V E S T M E N T
I N F R A S T R U C T U R E WA S A P R E - C U R S O R A N D R E Q U I R E D S U B S TA N T I A L C A P I TA L
I N F R A S T R U C T U R E C O M PA N I E S W E R E T H E F O U N D A T I O N F O R N E W A P P L I C A T I O N S & R E Q U I R E D S U B S TA N T I A L
I N V E S T M E N T E A R LY O N ; S P U R R I N G T H E E X PA N S I V E G R O W T H O F M E D I A & M A R K E T I N G C O M PA N I E S S I N C E 2 0 0 6
A G E V S . I N V E S T M E N T R E C E I V E D
G O O G L E & C O M C A S T, T W O O F T H E M O S T A C T I V E I N V E S T O R S , E X H I B I T O P P O S I T E S T R A T E G I E S
C O M C A S T F O C U S E S O N I N F R A S T R U C T U R E W H I L E G O O G L E P L A Y S I N M A R K E T I N G & D I G I TA L M E D I A
D I F F E R E N T I N V E S T M E N T S T R A T E G I E S H I G H L I G H T E D B Y I N V E S T O R S
T O P I N V E S T O R S : M O S T P R O L I F I C
Redpoint Ventures
Intel Capital
New Enterprise Associates
500 Startups
Avalon Ventures, LLC
Accel Partners
Greycroft Partners LLC
Draper Fisher Jurvetson
Lerer Hippeau Ventures
Time Warner Investments 11
12
13
14
14
15
16
17
23
23
# of Investments
Charter Communications
Scientific-Atlanta
BC Partners
Oracle Corporation
Asia Pacific Telecom
MegaFon
Walt Disney
Advent International
CSC Holdings
Bain Capital $1,252
$1,365
$1,692
$1,700
$1,746
$1,977
$2,045
$2,659
$5,063
$13,058
Total Invesment ($M)
T O P I N V E S T O R S : L A R G E S T I N V E S T O R S
A D D I T I O N A L H I G H L I G H T S
• T H E R E I S A N A N I N C R E A S I N G R A N G E O F S E R V I C E S T H A T A L L O W C O N S U M P T I O N ,
C R E A T I O N & D I S T R I B U T I O N O F O N L I N E V I D E O F O R C O N S U M E R S .
• U N S U R P R I S I N G LY, I N F R A S T R U C T U R E C O M PA N I E S A R E O L D E R & M O R E M A T U R E , M A N Y
H A V E S E E N L A R G E E X I T S ; E N A B L I N G I N F R A S T R U C T U R E WA S T H E F O U N D A T I O N W H I C H
H A S A L L O W E D T H E P R O L I F E R A T I O N O F A P P L I C A T I O N S S P U R R I N G T H E E X PA N S I V E
G R O W T H O F M E D I A & M A R K E T I N G C O M PA N I E S S I N C E 2 0 0 6 ( PA G E 9 )
• W E H A V E S E E N I N C R E D I B L E G R O W T H & C O M PA N Y C R E A T I O N I N T H I S I N D U S T RY. T H E
T R E N D I N N E W C O M PA N I E S B E I N G F O U N D E D S A W E X P O N E N T I A L G R O W T H ; Y O U T U B E WA S
B O R N A T T H E P E A K O F T H I S WA V E ( PA G E 6 )
• L I G H T S Q U A R E D I S T H E G O L I A T H I N I N F R A S T R U C T U R E W I T H ~ $ 2 . 5 B N R A I S E D . H O W E V E R ,
H U L U , T H E B E T T E R - K N O W N C O N S U M E R - FA C I N G C O M PA N Y, H A S R A I S E D $ 8 5 0 M N A N D
R E M A I N S P R I VA T E
• S E R V I C E S ( S T R E A M I N G M E D I A & T E L E C O M S E R V I C E S ) & C O N T E N T D I S T R I B U T I O N H A V E
L O W C A P I TA L R E Q U I R E M E N T S T O G E T S TA R T E D . M E D I A N I N V E S T M E N T A M O U N T I S < $ 5 M .
H O W E V E R T H E E X I T S ( W I N N E R S ) D O S E E M T O H A V E R E Q U I R E D S I G N I F I C A N T C A P I TA L
( PA G E 8 )
H U M A N I N T U I T I O N AT
S U P E R H U M A N S C A L E
Contact
cconnors@quid.com
+1 503.460.7106
quid.com
@quid

Online video Landscape

  • 1.
    Contact cconnors@quid.com +1 503.460.7106 quid.com @quid What isQuid? Quid expands your ability to comprehend massive amounts of information on any given topic. Through interactive visual maps, we make it easy to navigate your own way through the world’s collective intelligence and see relationships previously hidden. We enable you to realize ideas and decisions based on the best information available, not just what time allows for. Let’s see how Quid segments the online video market. We’ll look to find high growth sectors and whitespace opportunities in this space to identify signals to give you a competitive edge.
  • 2.
    H O WT O : N E T W O R K V I S U A L I Z AT I O N S Quid reads large volumes of text information and then creates a visual, interactive map which can be used to interpret hidden relationships and ideas Each node represents a company; nodes sized by degree represent the number of connections that node has with other nodes (i.e., similarity) Connections represent similar language/technology used across nodes (companies) A node bridging two clusters can indicate a company that synthesizes disparate technologies Dense clusters contain highly similar companies Less distance between clusters indicates a high number of inter- related companies/technology Greater distance between clusters indicates a low number of inter- related stories Centrally located companies are core to the conversation, indicating core technology or bridging innovation Peripheral clusters are less central to the conversation but are more unique Spread out clusters contain highly differentiated technology Similar nodes typically cluster together and clusters are grouped by color
  • 3.
    O N LI N E V I D E O C O M PA N Y L A N D S C A P E
  • 4.
    1. Includes companiesthat were private at any time between January 2010 and May 2015 2. Includes publicly disclosed private investments and market exits between January 2010 and May 2015 Q U I D I D E N T I F I E D R E L AT I O N S H I P S B E T W E E N T H E ~ 9 0 0 C O M PA N I E S B Y C R E AT I N G A M A P O F R E C E N T O N L I N E V I D E O I N N O VAT I O N 9 1 0 1 C O M PA N I E S W I T H $ 1 8 B 2 T O TA L I N V E S T M E N T O N L I N E V I D E O L A N D S C A P E
  • 5.
    Q U ID T H E N C R E A T E D A N O N T O L O G Y O F T H E O N L I N E V I D E O S PA C E (A) Digital Media (44%) (B) Infrastructure (38%) (C) Marketing (16%) A B C A T E G O R I E S : H I G H - L E V E L C L A S S I F I C A T I O N C
  • 6.
    D I GI TA L M E D I A ( 4 0 4 ) 1. C O N T E N T C R E AT I O N & D I S T R I B U T I O N ( 1 4 4 ) 2. S T R E A M I N G M E D I A P L AT F O R M S & S E R V I C E S ( 9 8 ) 3. G A M I N G ( 7 0 ) 4. C O N T E N T C U R AT I O N & R E C O M M E N D AT I O N ( 6 8 ) 5. R I C H M E D I A C O N T E N T & D E L I V E RY ( 2 4 ) I N F R A S T R U C T U R E ( 3 5 4 ) 6. S O C I A L V I E W I N G & S H A R I N G ( 9 7 ) 7. W I R E L E S S N E T W O R K S & T E L E C O M S E R V I C E S ( 9 4 ) 8. E N T E RTA I N M E N T D E V I C E S & O N L I N E V I D E O S E R V I C E S ( 7 0 ) 9. C O N T E N T D E L I V E RY ( 4 9 ) 10. V I D E O I N F R A S T R U C T U R E & W I R E L E S S S E R V I C E S ( 4 4 ) M A R K E T I N G ( 1 5 2 ) 11. V I D E O A D V E RT I S I N G ( 9 2 ) 12. M E D I A A N A LY T I C S ( 6 0 ) 1 C O M M U N I T I E S : L O W E R - L E V E L C L A S S I F I C A T I O N O N L I N E V I D E O , G R O U P E D B Y C O M M U N I T Y, S I Z E D B Y N U M B E R O F C O M PA N I E S , C O L O R E D B Y C A T E G O RY 2 3 4 5 6 7 8 1 0 9 1 1 1 2 3 C A T E G O R I E S W I T H 1 2 G R A N U L A R C O M M U N I T I E S E M E R G E
  • 7.
    F O UN D I N G Y E A R D I S T R I B U T I O N Post 20141980 Y O U T U B E ’ S A R R I VA L C A M E A T T H E P E A K O F V I D E O G R O W T H 1990 2000 Pre- 2005Founding Year
  • 8.
    Category Number Of Companies Total Exit Amount($M) Number Of Exit Events Total Private Inv. Amount ($M) Number Of Priv. Inv. Events Median Private Inv. ($M) Median Founding Year Digital Media 404 2,249 8 6,588 860 5.5 2008 Infrastructure 354 11,903 18 8,874 798 10.0 2004 Marketing 152 - 0 2,827 368 17.4 2007 I N F R A S T R U C T U R E C O M PA N I E S A R E O L D E R + H A V E S E E N L A R G E E X I T S ; D I G I TA L M E D I A R E C E I V E S T H E M O S T A C T I V I T Y
  • 9.
    Community Number Of Companies Total Exit Amount($M) Number Of Exit Events Total Private Inv. Amount ($M) Number Of Priv. Inv. Events Median Private Inv. ($M) Median Founding Year Content Creation & Distribution 144 1,318 2 2,953 294 4.7 2008 Streaming Media Platforms & Services 68 - - 878 139 3.1 2008 Gaming 49 - - 911 120 12.7 2005.5 Content Curation & Recommendation 70 - - 871 136 5.2 2007 Rich Media Content & Delivery 70 930 6 1,075 138 8.0 2006 Social Viewing & Sharing 60 - - 960 125 16.5 2006 Wireless Networks & Telecom Services 24 - - 272 55 4.1 2006 Entertainment Devices & Online Video Services 97 5,577 6 1,614 226 9.3 2004 Content Delivery 98 - - 1,411 234 7.4 2009 Video Infrastructure & Wireless Services 92 - - 1,867 243 18.2 2007 Video Advertising 44 4,078 8 1,022 141 24.5 2001 Media Analytics 94 2,248 4 4,455 175 17.0 2002 S T R E A M I N G M E D I A P L A T F O R M S H A V E L O W E S T E N T RY C A P I TA L C O S T S ; M E D I A A N A LY T I C S S E E S T H E M O S T I N V E S T M E N T
  • 10.
    I N FR A S T R U C T U R E WA S A P R E - C U R S O R A N D R E Q U I R E D S U B S TA N T I A L C A P I TA L I N F R A S T R U C T U R E C O M PA N I E S W E R E T H E F O U N D A T I O N F O R N E W A P P L I C A T I O N S & R E Q U I R E D S U B S TA N T I A L I N V E S T M E N T E A R LY O N ; S P U R R I N G T H E E X PA N S I V E G R O W T H O F M E D I A & M A R K E T I N G C O M PA N I E S S I N C E 2 0 0 6 A G E V S . I N V E S T M E N T R E C E I V E D
  • 11.
    G O OG L E & C O M C A S T, T W O O F T H E M O S T A C T I V E I N V E S T O R S , E X H I B I T O P P O S I T E S T R A T E G I E S C O M C A S T F O C U S E S O N I N F R A S T R U C T U R E W H I L E G O O G L E P L A Y S I N M A R K E T I N G & D I G I TA L M E D I A D I F F E R E N T I N V E S T M E N T S T R A T E G I E S H I G H L I G H T E D B Y I N V E S T O R S
  • 12.
    T O PI N V E S T O R S : M O S T P R O L I F I C Redpoint Ventures Intel Capital New Enterprise Associates 500 Startups Avalon Ventures, LLC Accel Partners Greycroft Partners LLC Draper Fisher Jurvetson Lerer Hippeau Ventures Time Warner Investments 11 12 13 14 14 15 16 17 23 23 # of Investments
  • 13.
    Charter Communications Scientific-Atlanta BC Partners OracleCorporation Asia Pacific Telecom MegaFon Walt Disney Advent International CSC Holdings Bain Capital $1,252 $1,365 $1,692 $1,700 $1,746 $1,977 $2,045 $2,659 $5,063 $13,058 Total Invesment ($M) T O P I N V E S T O R S : L A R G E S T I N V E S T O R S
  • 14.
    A D DI T I O N A L H I G H L I G H T S • T H E R E I S A N A N I N C R E A S I N G R A N G E O F S E R V I C E S T H A T A L L O W C O N S U M P T I O N , C R E A T I O N & D I S T R I B U T I O N O F O N L I N E V I D E O F O R C O N S U M E R S . • U N S U R P R I S I N G LY, I N F R A S T R U C T U R E C O M PA N I E S A R E O L D E R & M O R E M A T U R E , M A N Y H A V E S E E N L A R G E E X I T S ; E N A B L I N G I N F R A S T R U C T U R E WA S T H E F O U N D A T I O N W H I C H H A S A L L O W E D T H E P R O L I F E R A T I O N O F A P P L I C A T I O N S S P U R R I N G T H E E X PA N S I V E G R O W T H O F M E D I A & M A R K E T I N G C O M PA N I E S S I N C E 2 0 0 6 ( PA G E 9 ) • W E H A V E S E E N I N C R E D I B L E G R O W T H & C O M PA N Y C R E A T I O N I N T H I S I N D U S T RY. T H E T R E N D I N N E W C O M PA N I E S B E I N G F O U N D E D S A W E X P O N E N T I A L G R O W T H ; Y O U T U B E WA S B O R N A T T H E P E A K O F T H I S WA V E ( PA G E 6 ) • L I G H T S Q U A R E D I S T H E G O L I A T H I N I N F R A S T R U C T U R E W I T H ~ $ 2 . 5 B N R A I S E D . H O W E V E R , H U L U , T H E B E T T E R - K N O W N C O N S U M E R - FA C I N G C O M PA N Y, H A S R A I S E D $ 8 5 0 M N A N D R E M A I N S P R I VA T E • S E R V I C E S ( S T R E A M I N G M E D I A & T E L E C O M S E R V I C E S ) & C O N T E N T D I S T R I B U T I O N H A V E L O W C A P I TA L R E Q U I R E M E N T S T O G E T S TA R T E D . M E D I A N I N V E S T M E N T A M O U N T I S < $ 5 M . H O W E V E R T H E E X I T S ( W I N N E R S ) D O S E E M T O H A V E R E Q U I R E D S I G N I F I C A N T C A P I TA L ( PA G E 8 )
  • 15.
    H U MA N I N T U I T I O N AT S U P E R H U M A N S C A L E Contact cconnors@quid.com +1 503.460.7106 quid.com @quid