Learning to see: how machines learn to understand images?Muhammad Asad
Recent years have seen significant advancements in Computer Vision algorithms, where computers can look at image and video data to understand a given scene. Be it face recognition or smart cars in real-world scenarios, computers are beginning to excel and, in some cases, surpass their human counterparts. This talk introduces the audience to the concept of machine learning, which enables computers to learn from known examples of a given task and apply their learned knowledge to a new, but similar, scenario.
Using the Quid Intelligence Platform, we ran a network of all Apple Inc.’s patent filings related to the new Apple Watch. What we found were 170 unique inventions that went in to this product, and 11 distinct clusters of innovation.
Apple launched with many key patents yet to be granted, especially ones in the display and media area. As of October 2014, 48% of patents have yet to be granted, and 52% of patents are in the application process.
Speculation about the Apple Car has kicked into high gear. The amount of news chatter, hiring trends, and investments would take someone years to read. To sift through the noise we used Quid to identify what patterns are important. Read our analysis and then make your way over to MacWorld for further coverage.
2015 FOSS4G Track: Spatiotemporal Interface Development: Using Web Technologi...GIS in the Rockies
Communicating patterns in large spatiotemporal datasets can be a challenging and complicated task. While a variety of tools are available to visualize these data on the desktop, web technologies offer a unique opportunity to create interfaces that allow users to interactively explore complex multivariate datasets. In this presentation we outline a process for building spatiotemporal visualizations on the web. From data processing through architecture and development we describe technologies and languages you should know to get off the ground and walk through other important considerations in developing intuitive data exploration interfaces.
It was a cool experience, spending time with programmer and some computer engineers. In this codecamp, I talked about the science behind Complex networks, and how to program for complex network analysis. I also had a brief introduction towards graph databases.
Infographics: E-volving Instruction for Visual Literacy
Melanie Parlette-Stewart, Lindsey Robinson - University of Guelph, Guelph, Ontario
WILU 2014 - London, ON
Infographics involve the bringing together of information, data, and design. There is increasing need to be visually literate, as is highlighted in the ACRL Visual Literacy Competency Standards for Higher Education. This session presents the ACRL Visual Literacy Competency Standards and the application of these to an introductory infographics instruction session. This session will highlight the active learning approach used to allow students to engage with and create infographics at an introductory level.
Data Centers - Striving Within A Narrow Range - Research Report - MCG - May 2...pchutichetpong
M Capital Group (“MCG”) expects to see demand and the changing evolution of supply, facilitated through institutional investment rotation out of offices and into work from home (“WFH”), while the ever-expanding need for data storage as global internet usage expands, with experts predicting 5.3 billion users by 2023. These market factors will be underpinned by technological changes, such as progressing cloud services and edge sites, allowing the industry to see strong expected annual growth of 13% over the next 4 years.
Whilst competitive headwinds remain, represented through the recent second bankruptcy filing of Sungard, which blames “COVID-19 and other macroeconomic trends including delayed customer spending decisions, insourcing and reductions in IT spending, energy inflation and reduction in demand for certain services”, the industry has seen key adjustments, where MCG believes that engineering cost management and technological innovation will be paramount to success.
MCG reports that the more favorable market conditions expected over the next few years, helped by the winding down of pandemic restrictions and a hybrid working environment will be driving market momentum forward. The continuous injection of capital by alternative investment firms, as well as the growing infrastructural investment from cloud service providers and social media companies, whose revenues are expected to grow over 3.6x larger by value in 2026, will likely help propel center provision and innovation. These factors paint a promising picture for the industry players that offset rising input costs and adapt to new technologies.
According to M Capital Group: “Specifically, the long-term cost-saving opportunities available from the rise of remote managing will likely aid value growth for the industry. Through margin optimization and further availability of capital for reinvestment, strong players will maintain their competitive foothold, while weaker players exit the market to balance supply and demand.”
Adjusting primitives for graph : SHORT REPORT / NOTESSubhajit Sahu
Graph algorithms, like PageRank Compressed Sparse Row (CSR) is an adjacency-list based graph representation that is
Multiply with different modes (map)
1. Performance of sequential execution based vs OpenMP based vector multiply.
2. Comparing various launch configs for CUDA based vector multiply.
Sum with different storage types (reduce)
1. Performance of vector element sum using float vs bfloat16 as the storage type.
Sum with different modes (reduce)
1. Performance of sequential execution based vs OpenMP based vector element sum.
2. Performance of memcpy vs in-place based CUDA based vector element sum.
3. Comparing various launch configs for CUDA based vector element sum (memcpy).
4. Comparing various launch configs for CUDA based vector element sum (in-place).
Sum with in-place strategies of CUDA mode (reduce)
1. Comparing various launch configs for CUDA based vector element sum (in-place).
Techniques to optimize the pagerank algorithm usually fall in two categories. One is to try reducing the work per iteration, and the other is to try reducing the number of iterations. These goals are often at odds with one another. Skipping computation on vertices which have already converged has the potential to save iteration time. Skipping in-identical vertices, with the same in-links, helps reduce duplicate computations and thus could help reduce iteration time. Road networks often have chains which can be short-circuited before pagerank computation to improve performance. Final ranks of chain nodes can be easily calculated. This could reduce both the iteration time, and the number of iterations. If a graph has no dangling nodes, pagerank of each strongly connected component can be computed in topological order. This could help reduce the iteration time, no. of iterations, and also enable multi-iteration concurrency in pagerank computation. The combination of all of the above methods is the STICD algorithm. [sticd] For dynamic graphs, unchanged components whose ranks are unaffected can be skipped altogether.
As Europe's leading economic powerhouse and the fourth-largest hashtag#economy globally, Germany stands at the forefront of innovation and industrial might. Renowned for its precision engineering and high-tech sectors, Germany's economic structure is heavily supported by a robust service industry, accounting for approximately 68% of its GDP. This economic clout and strategic geopolitical stance position Germany as a focal point in the global cyber threat landscape.
In the face of escalating global tensions, particularly those emanating from geopolitical disputes with nations like hashtag#Russia and hashtag#China, hashtag#Germany has witnessed a significant uptick in targeted cyber operations. Our analysis indicates a marked increase in hashtag#cyberattack sophistication aimed at critical infrastructure and key industrial sectors. These attacks range from ransomware campaigns to hashtag#AdvancedPersistentThreats (hashtag#APTs), threatening national security and business integrity.
🔑 Key findings include:
🔍 Increased frequency and complexity of cyber threats.
🔍 Escalation of state-sponsored and criminally motivated cyber operations.
🔍 Active dark web exchanges of malicious tools and tactics.
Our comprehensive report delves into these challenges, using a blend of open-source and proprietary data collection techniques. By monitoring activity on critical networks and analyzing attack patterns, our team provides a detailed overview of the threats facing German entities.
This report aims to equip stakeholders across public and private sectors with the knowledge to enhance their defensive strategies, reduce exposure to cyber risks, and reinforce Germany's resilience against cyber threats.
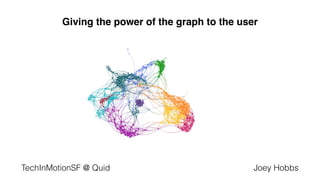
10. • Graphs are often used, but not often exposed
!
• The graph structure itself contains a lot of information
11. • We allow the user to define a set of things!
!
• We compute links between these things by analyzing text!
!
• The user then explores the graph directly
Quid’s Technology
12. Demo: what does the data visualization technology landscape look like?