Group Members:
Amol Sagar
Mahendra Vishwakarma
Jaswanth Ravilla
Rakesh Verma
Dharmika Jain
Sumedh Rewatkar
About OLA
• Founded on 3 December 2010 by Bhavish Aggarwal (currently CEO)
and Ankit Bhati.
• By 2014, the company has expanded to a network of more than
200,000 cars across 85 cities.
• In November 2014, Ola expanded to incorporate autos on-trial basis
in Bengaluru. Post the trial phase, Ola Auto expanded to other cities
like Delhi, Pune and Chennai starting December 2014.
• Value of ola as on September 2015 is $5 billion
SWOT Analysis
Strength Weakness
1. First mover advantage as a taxi aggregator in India
2. Acquisition of Taxi For Sure made it No. 1 in India
3. Top of the mind service
4. High awareness due to aggressive TV, online and
print media marketing
5.Huge customer base & due to network effect it is
increasing
6. Rapid expansion and online application
7. Multiple rounds of VC investments have made the
brand financially strong
1. Drivers are the face of the company and hence their
misbehavior directly affects the brand image
2. While the demand is huge, amount of cash burning
is huge and monetization is very difficult
Opportunities Threats
1. Unorganized market is huge (~90%) and hence
potential is high
2.Increasing internet penetration & smart phone users
3. Rising disposable income
4. Shifting of consumers towards convenience creates
huge demand
5. Acquisition of smaller players
1. Rising competition
2. Uber has deep pocket and hence can burn cash
heavily
3. Presence of many national players
4. Absence of clear government regulations in
developing countries
5. Future is unclear due to lack of regulations and
Customer loyalty is less in this industry
Internal Factor Evaluation
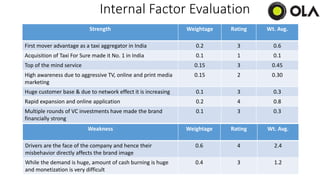
Strength Weightage Rating Wt. Avg.
First mover advantage as a taxi aggregator in India 0.2 3 0.6
Acquisition of Taxi For Sure made it No. 1 in India 0.1 1 0.1
Top of the mind service 0.15 3 0.45
High awareness due to aggressive TV, online and print media
marketing
0.15 2 0.30
Huge customer base & due to network effect it is increasing 0.1 3 0.3
Rapid expansion and online application 0.2 4 0.8
Multiple rounds of VC investments have made the brand
financially strong
0.1 3 0.3
Weakness Weightage Rating Wt. Avg.
Drivers are the face of the company and hence their
misbehavior directly affects the brand image
0.6 4 2.4
While the demand is huge, amount of cash burning is huge
and monetization is very difficult
0.4 3 1.2
External Factor Evaluation
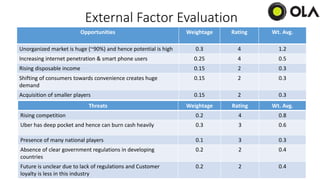
Threats Weightage Rating Wt. Avg.
Rising competition 0.2 4 0.8
Uber has deep pocket and hence can burn cash heavily 0.3 3 0.6
Presence of many national players 0.1 3 0.3
Absence of clear government regulations in developing
countries
0.2 2 0.4
Future is unclear due to lack of regulations and Customer
loyalty is less in this industry
0.2 2 0.4
Opportunities Weightage Rating Wt. Avg.
Unorganized market is huge (~90%) and hence potential is high 0.3 4 1.2
Increasing internet penetration & smart phone users 0.25 4 0.5
Rising disposable income 0.15 2 0.3
Shifting of consumers towards convenience creates huge
demand
0.15 2 0.3
Acquisition of smaller players 0.15 2 0.3
Porter’s Five Force Model
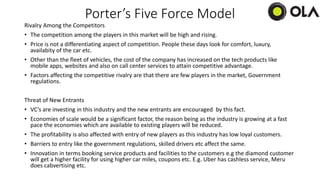
Rivalry Among the Competitors
• The competition among the players in this market will be high and rising.
• Price is not a differentiating aspect of competition. People these days look for comfort, luxury,
availabity of the car etc.
• Other than the fleet of vehicles, the cost of the company has increased on the tech products like
mobile apps, websites and also on call center services to attain competitive advantage.
• Factors affecting the competitive rivalry are that there are few players in the market, Government
regulations.
Threat of New Entrants
• VC’s are investing in this industry and the new entrants are encouraged by this fact.
• Economies of scale would be a significant factor, the reason being as the industry is growing at a fast
pace the economies which are available to existing players will be reduced.
• The profitability is also affected with entry of new players as this industry has low loyal customers.
• Barriers to entry like the government regulations, skilled drivers etc affect the same.
• Innovation in terms booking service products and facilities to the customers e.g the diamond customer
will get a higher facility for using higher car miles, coupons etc. E.g. Uber has cashless service, Meru
does cabvertising etc.
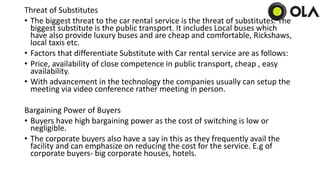
Threat of Substitutes
• The biggest threat to the car rental service is the threat of substitutes. The
biggest substitute is the public transport. It includes Local buses which
have also provide luxury buses and are cheap and comfortable, Rickshaws,
local taxis etc.
• Factors that differentiate Substitute with Car rental service are as follows:
• Price, availability of close competence in public transport, cheap , easy
availability.
• With advancement in the technology the companies usually can setup the
meeting via video conference rather meeting in person.
Bargaining Power of Buyers
• Buyers have high bargaining power as the cost of switching is low or
negligible.
• The corporate buyers also have a say in this as they frequently avail the
facility and can emphasize on reducing the cost for the service. E.g of
corporate buyers- big corporate houses, hotels.
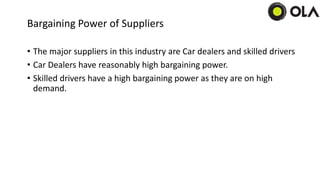
Bargaining Power of Suppliers
• The major suppliers in this industry are Car dealers and skilled drivers
• Car Dealers have reasonably high bargaining power.
• Skilled drivers have a high bargaining power as they are on high
demand.
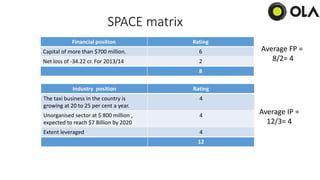
Industry position Rating
The taxi business in the country is
growing at 20 to 25 per cent a year.
4
Unorganised sector at $ 800 million ,
expected to reach $7 Billion by 2020
4
Extent leveraged 4
12
Financial position Rating
Capital of more than $700 million. 6
Net loss of -34.22 cr. For 2013/14 2
8
Average FP =
8/2= 4
Average IP =
12/3= 4
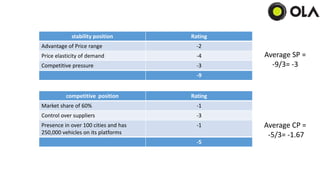
SPACE matrix
stability position Rating
Advantage of Price range -2
Price elasticity of demand -4
Competitive pressure -3
-9
competitive position Rating
Market share of 60% -1
Control over suppliers -3
Presence in over 100 cities and has
250,000 vehicles on its platforms
-1
-5
Average SP =
-9/3= -3
Average CP =
-5/3= -1.67
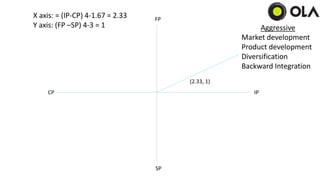
X axis: = (IP-CP) 4-1.67 = 2.33
Y axis: (FP –SP) 4-3 = 1
(2.33, 1)
Aggressive
Market development
Product development
Diversification
Backward Integration
FP
SP
CP IP
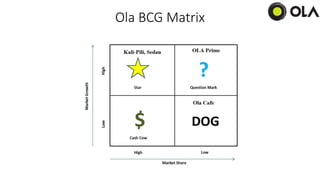
Ola BCG Matrix
Ola cabs