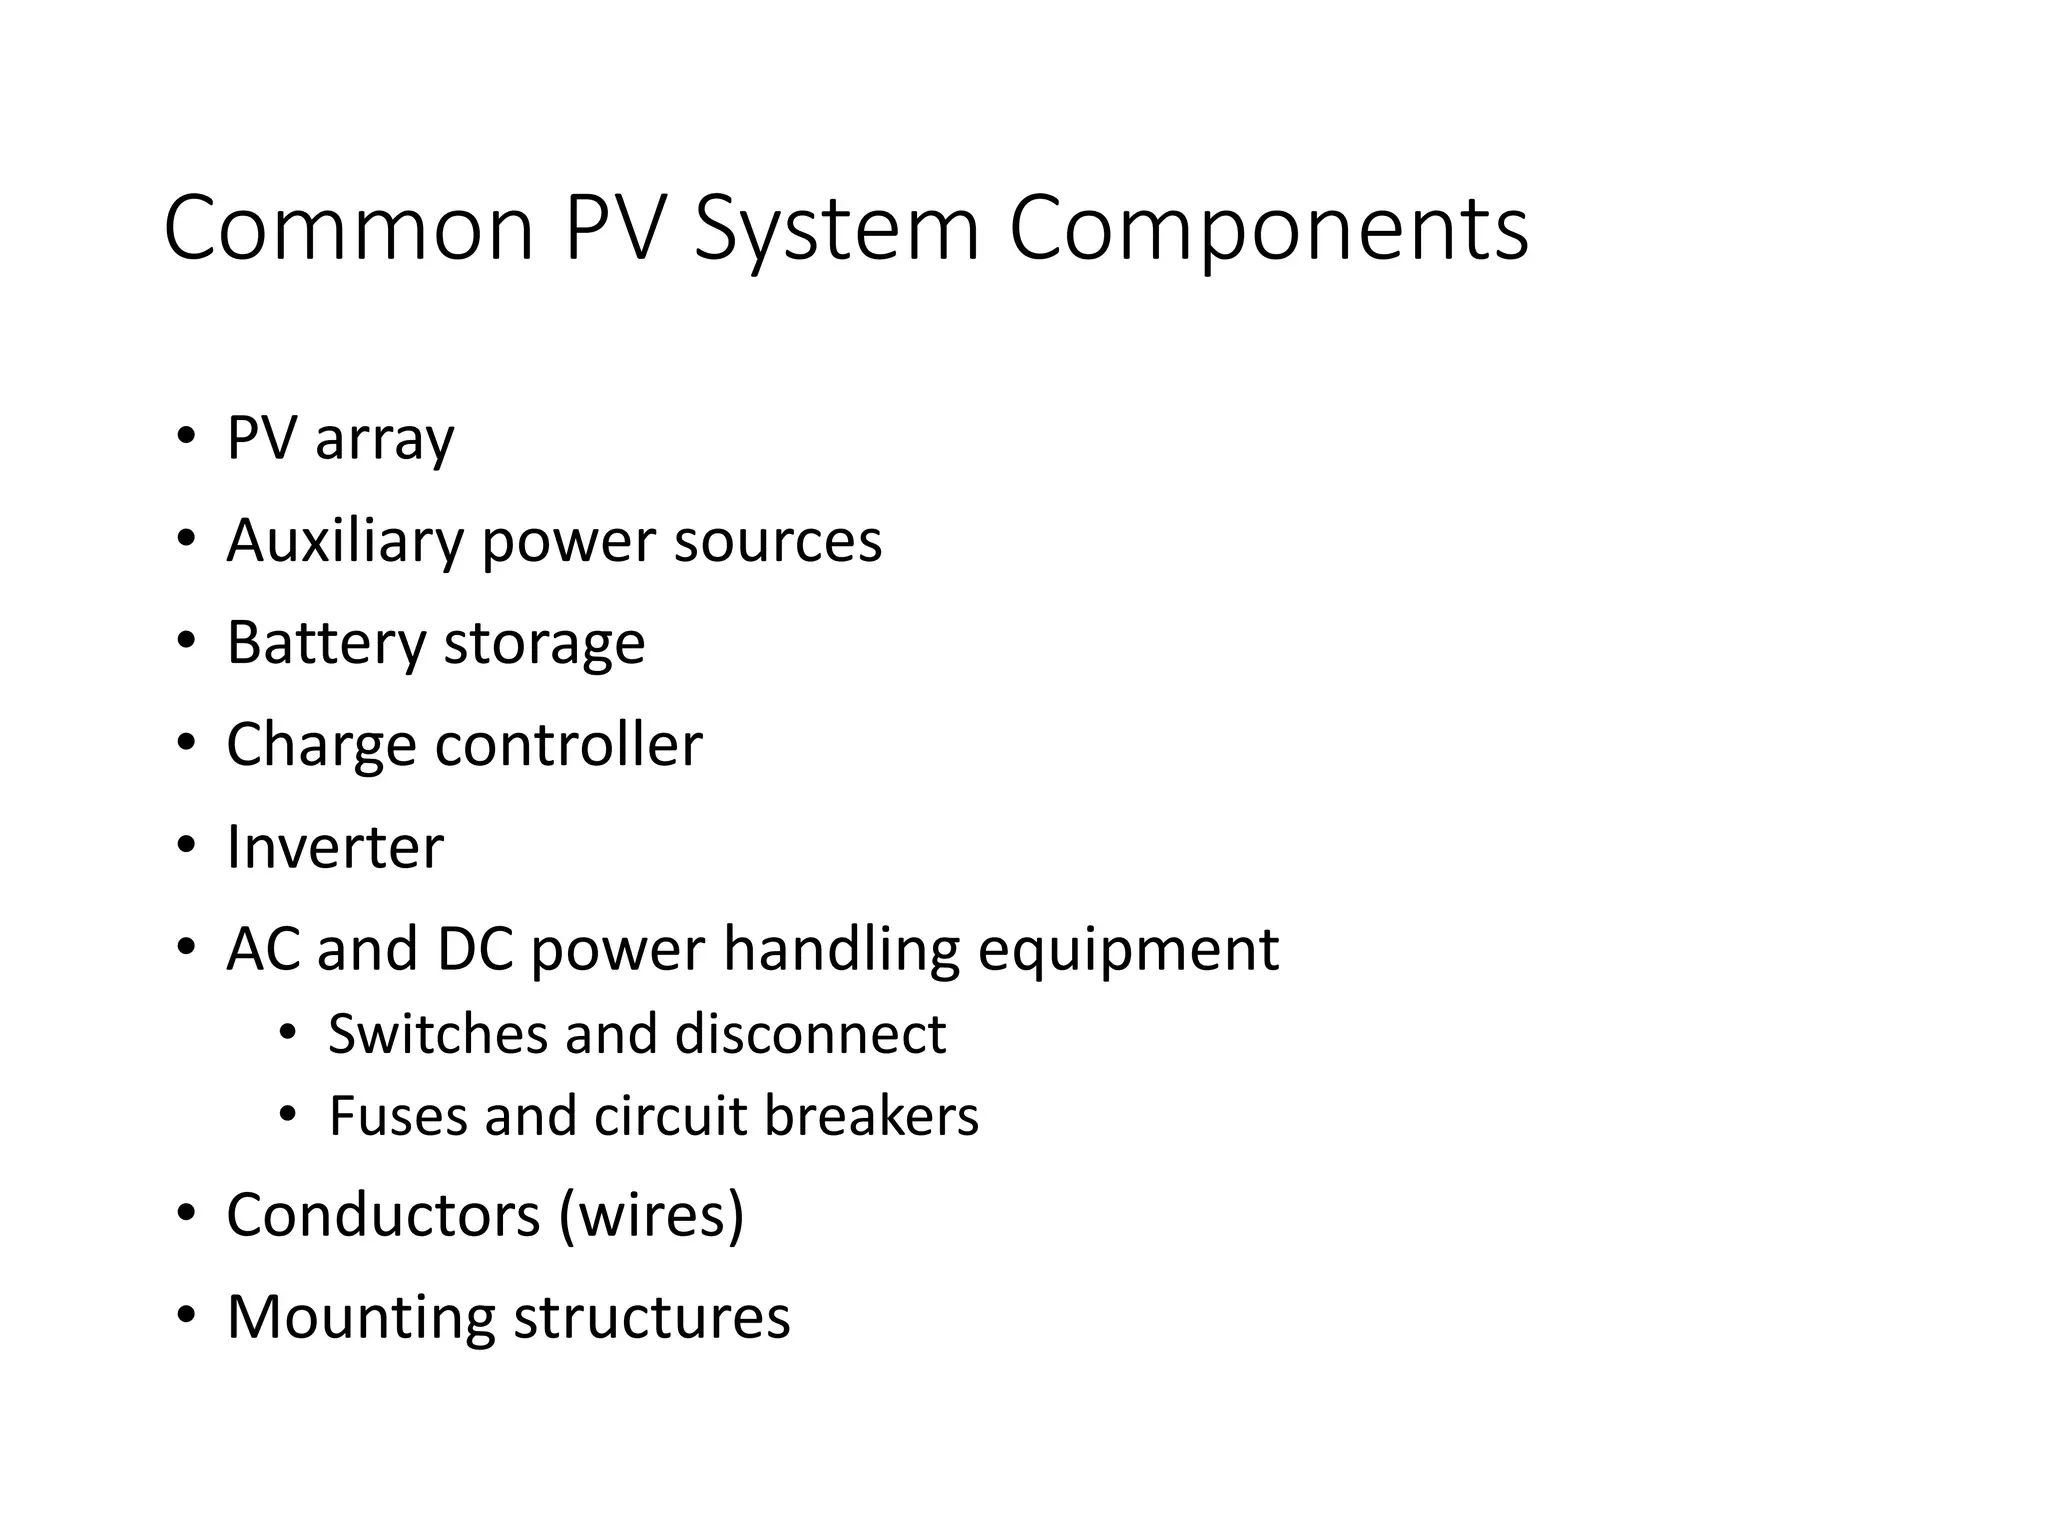
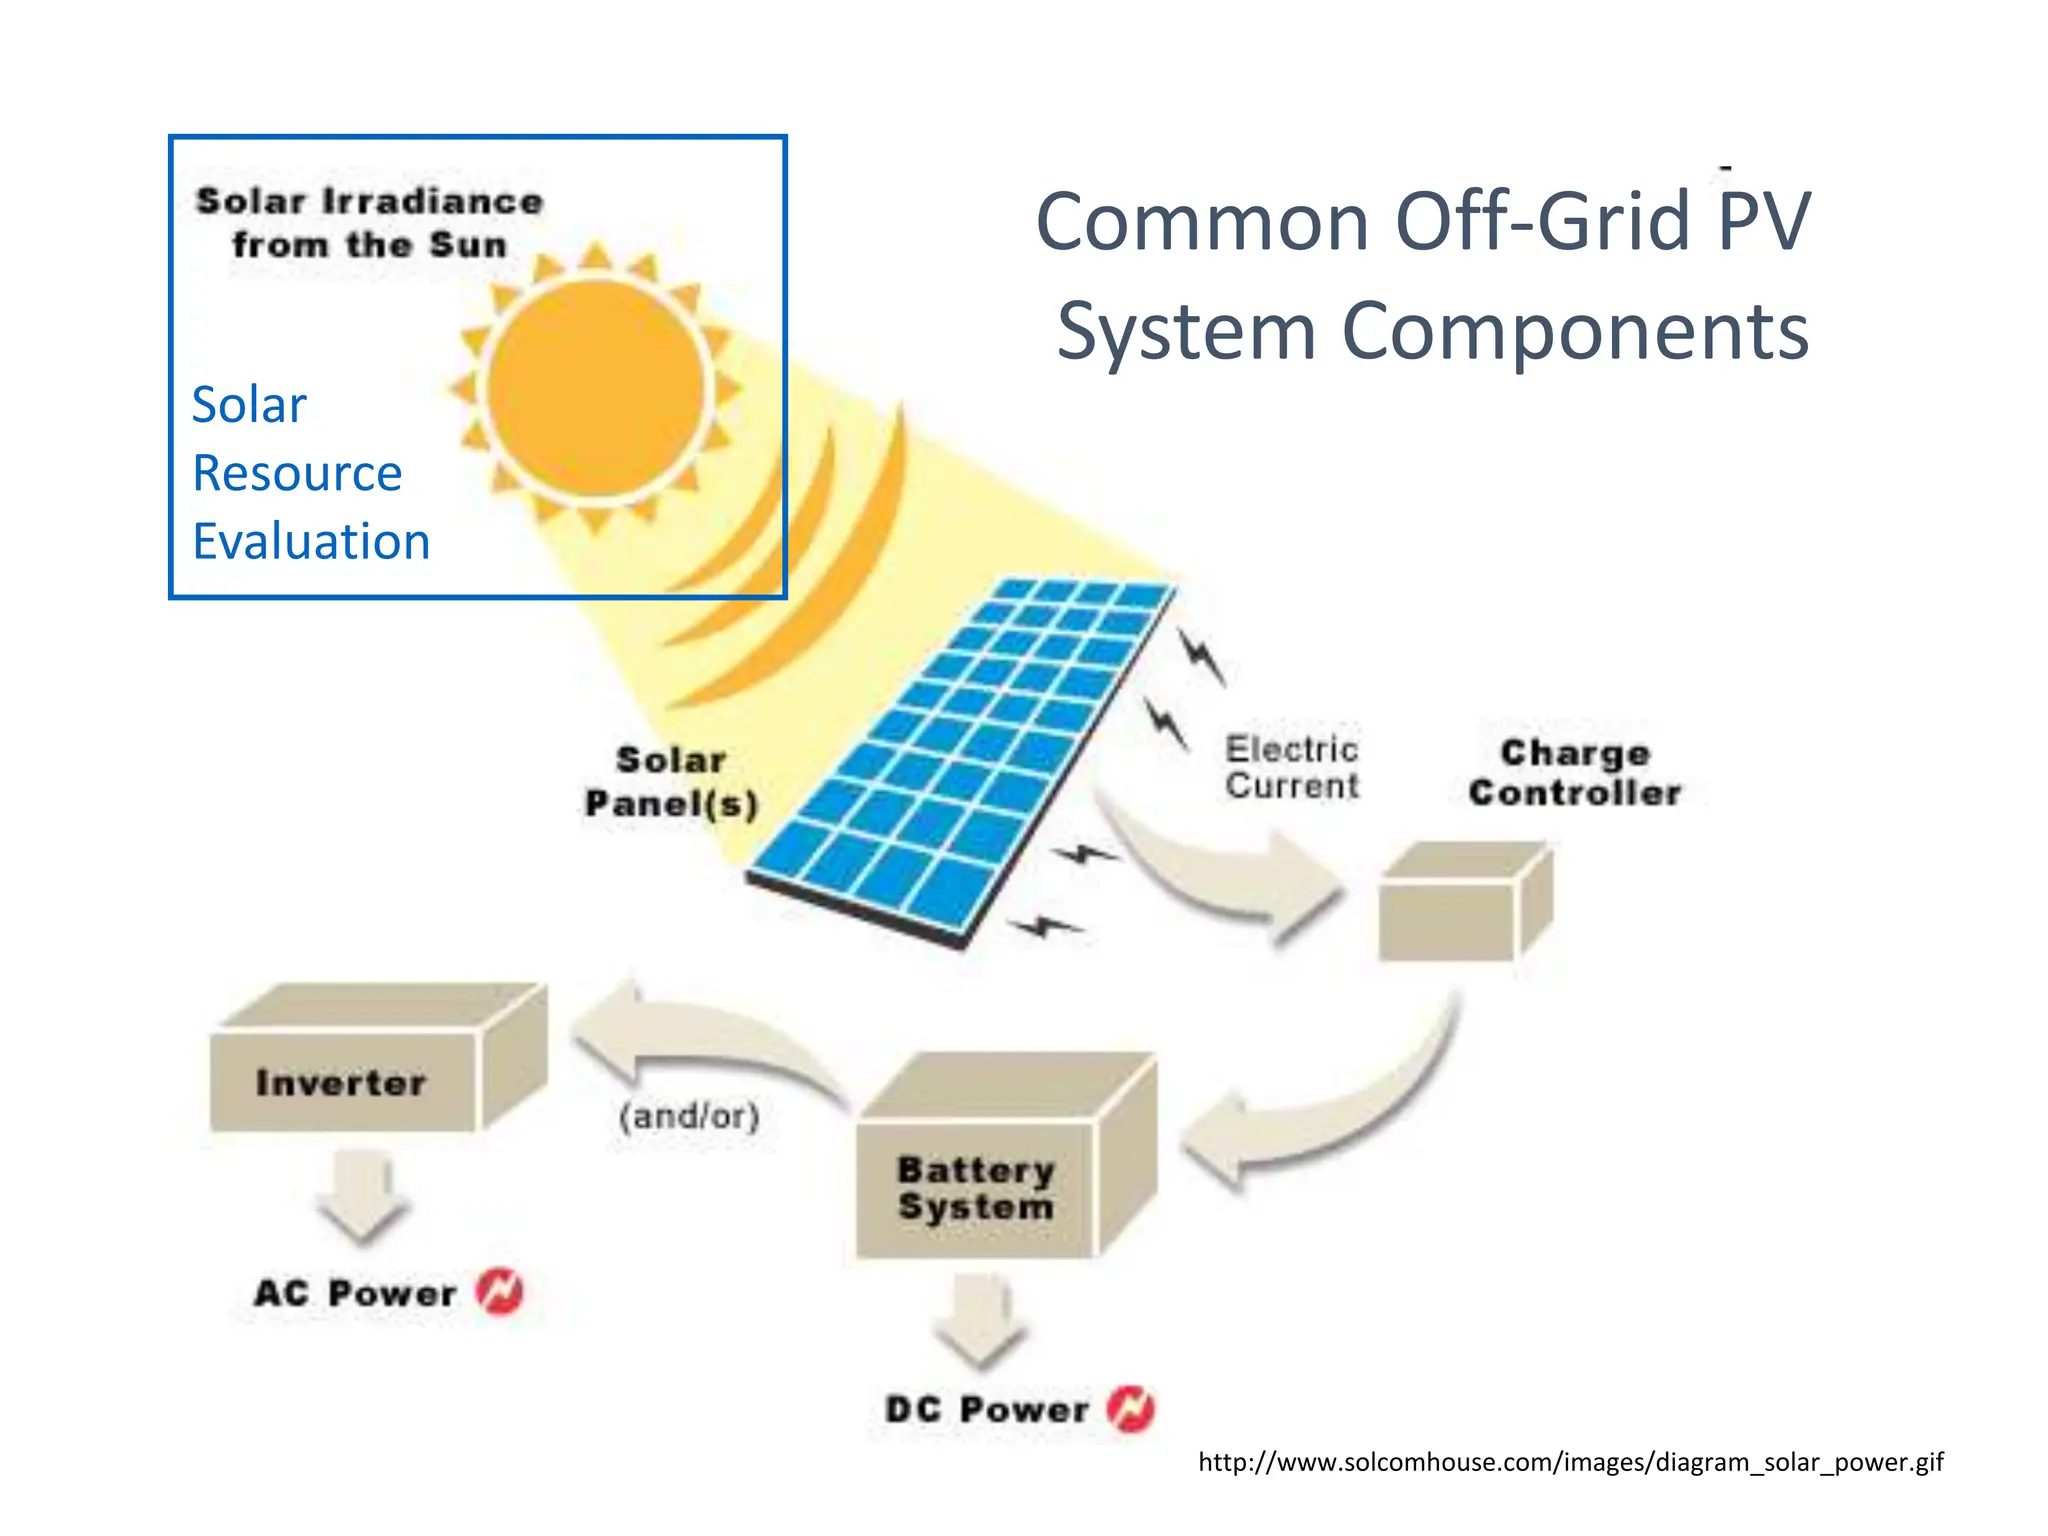
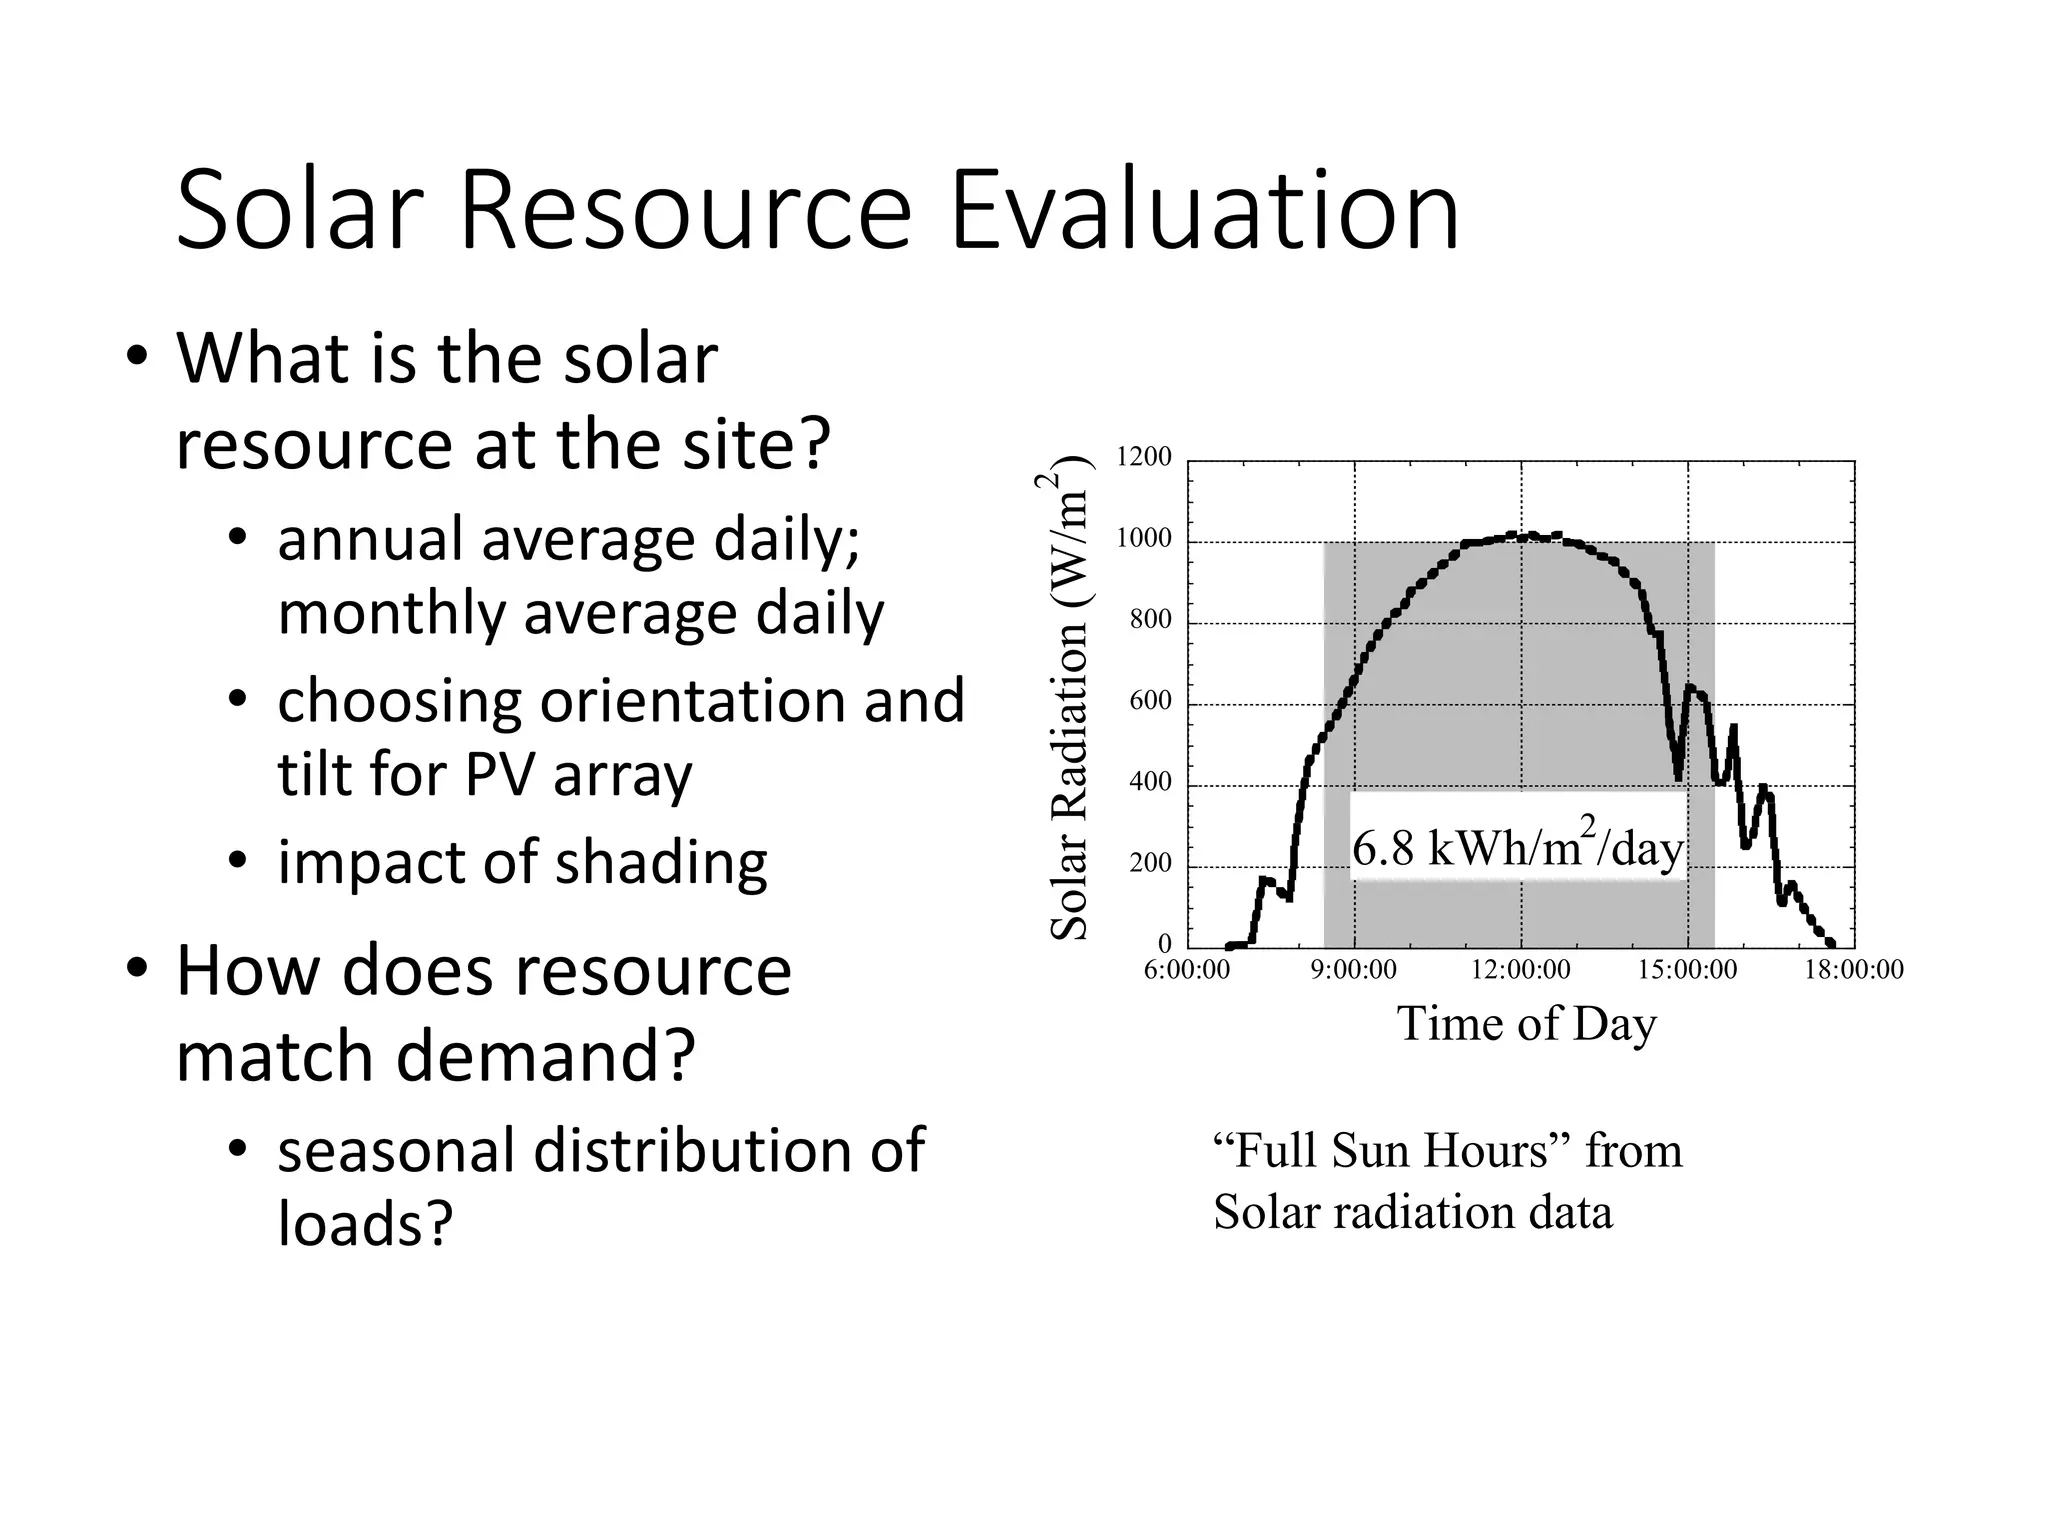
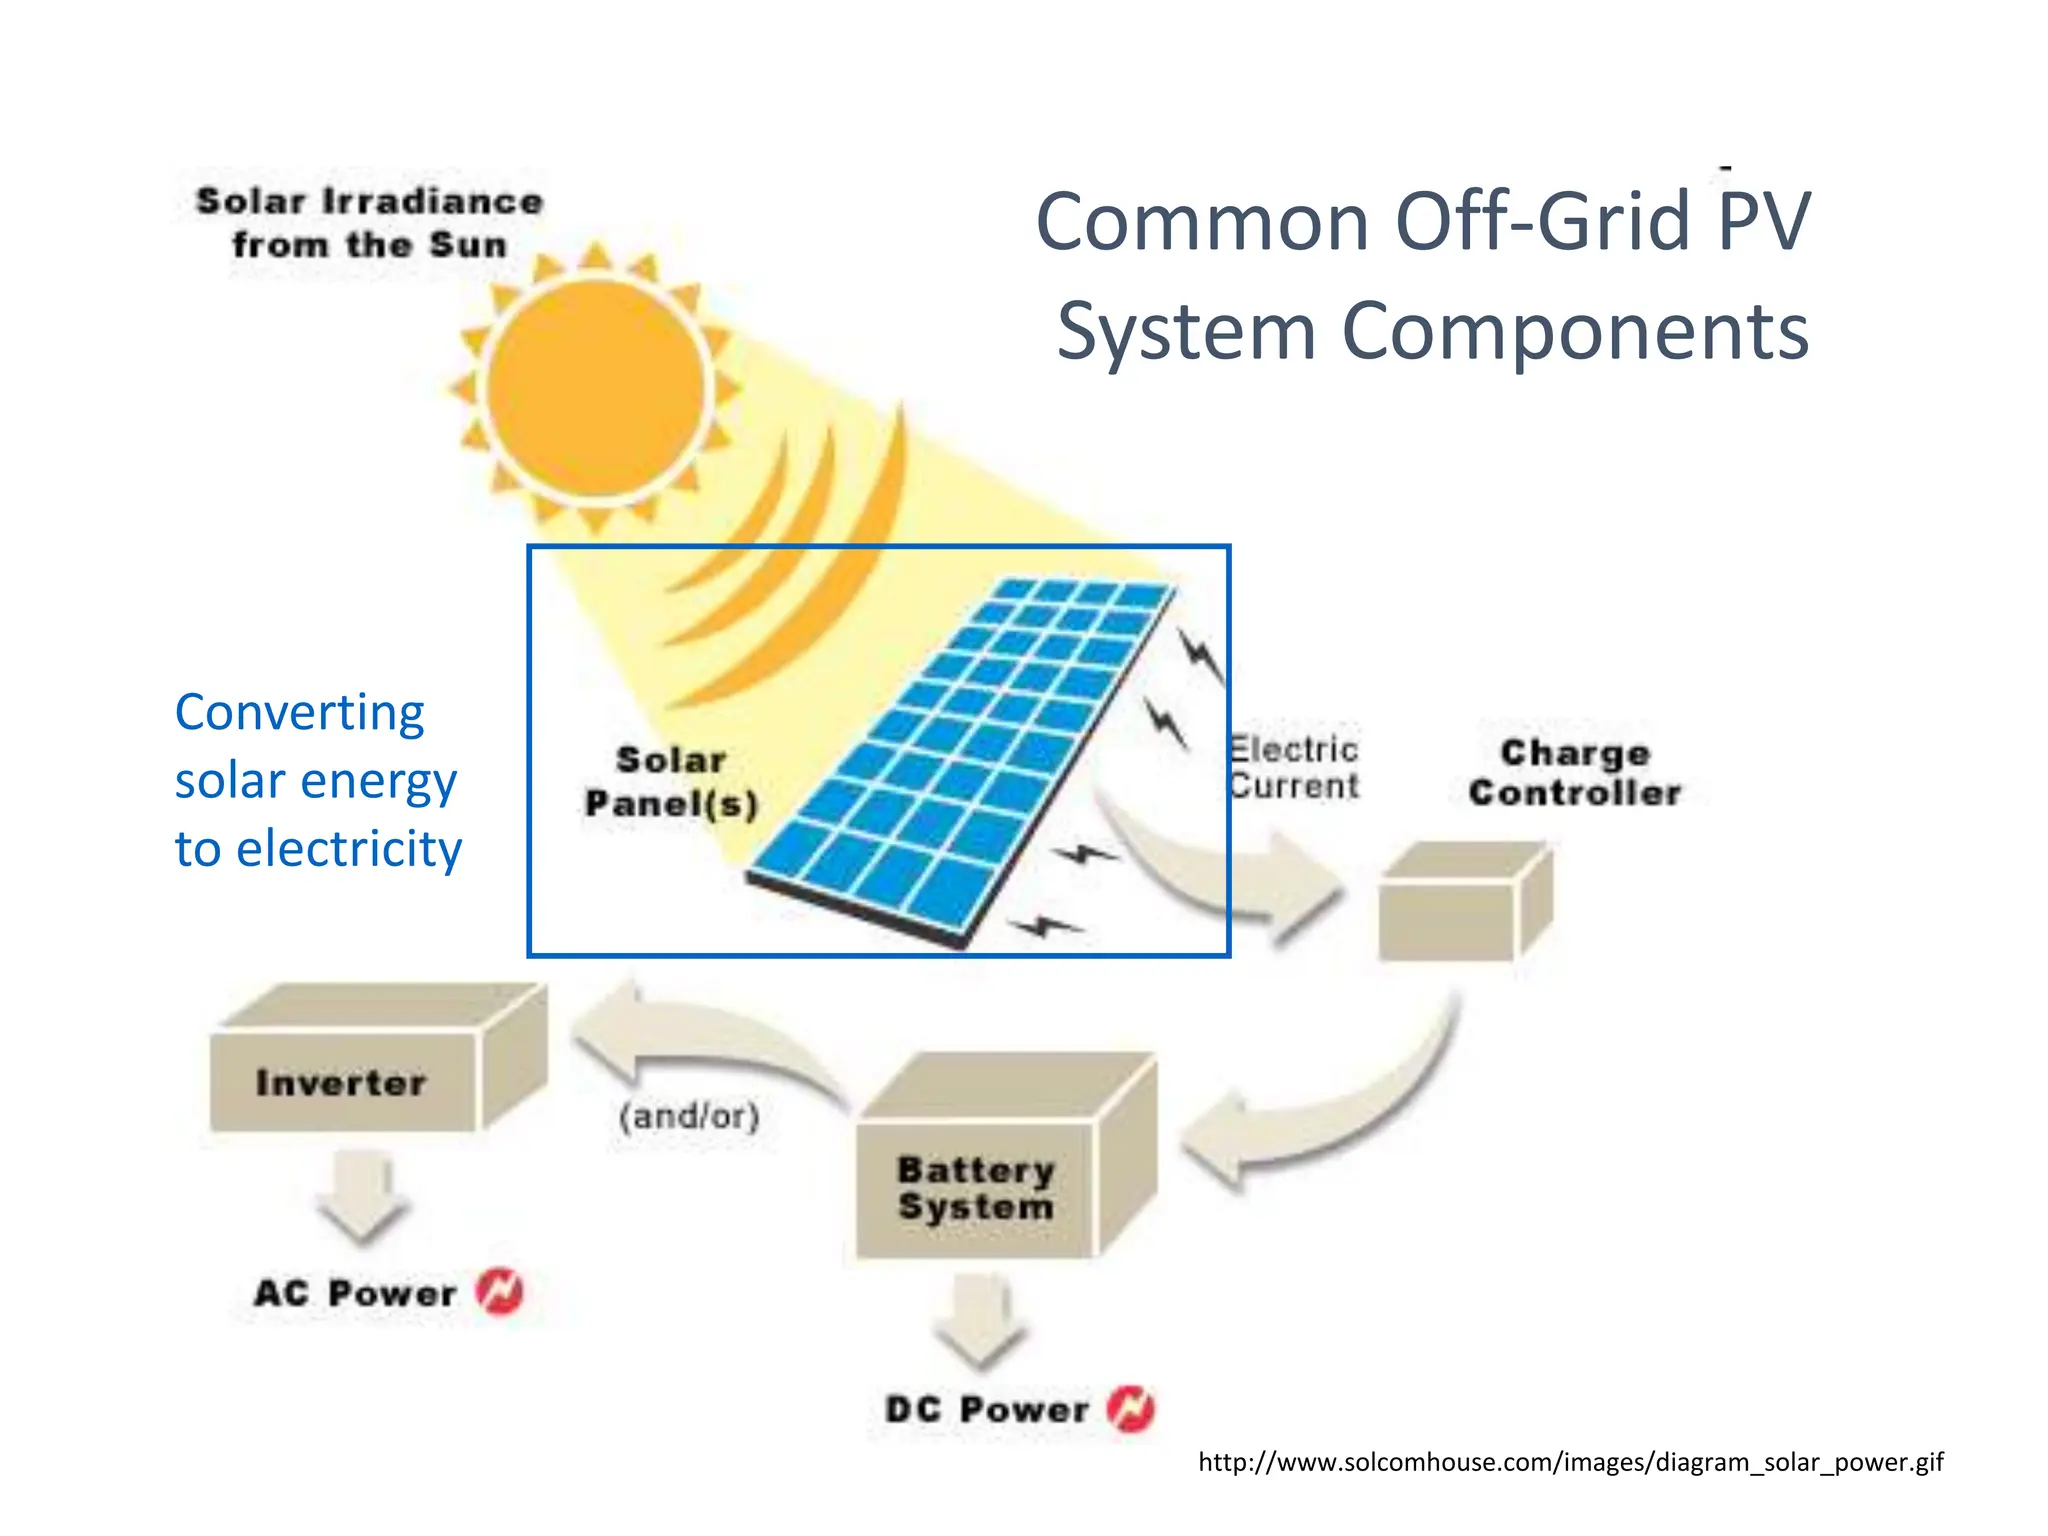
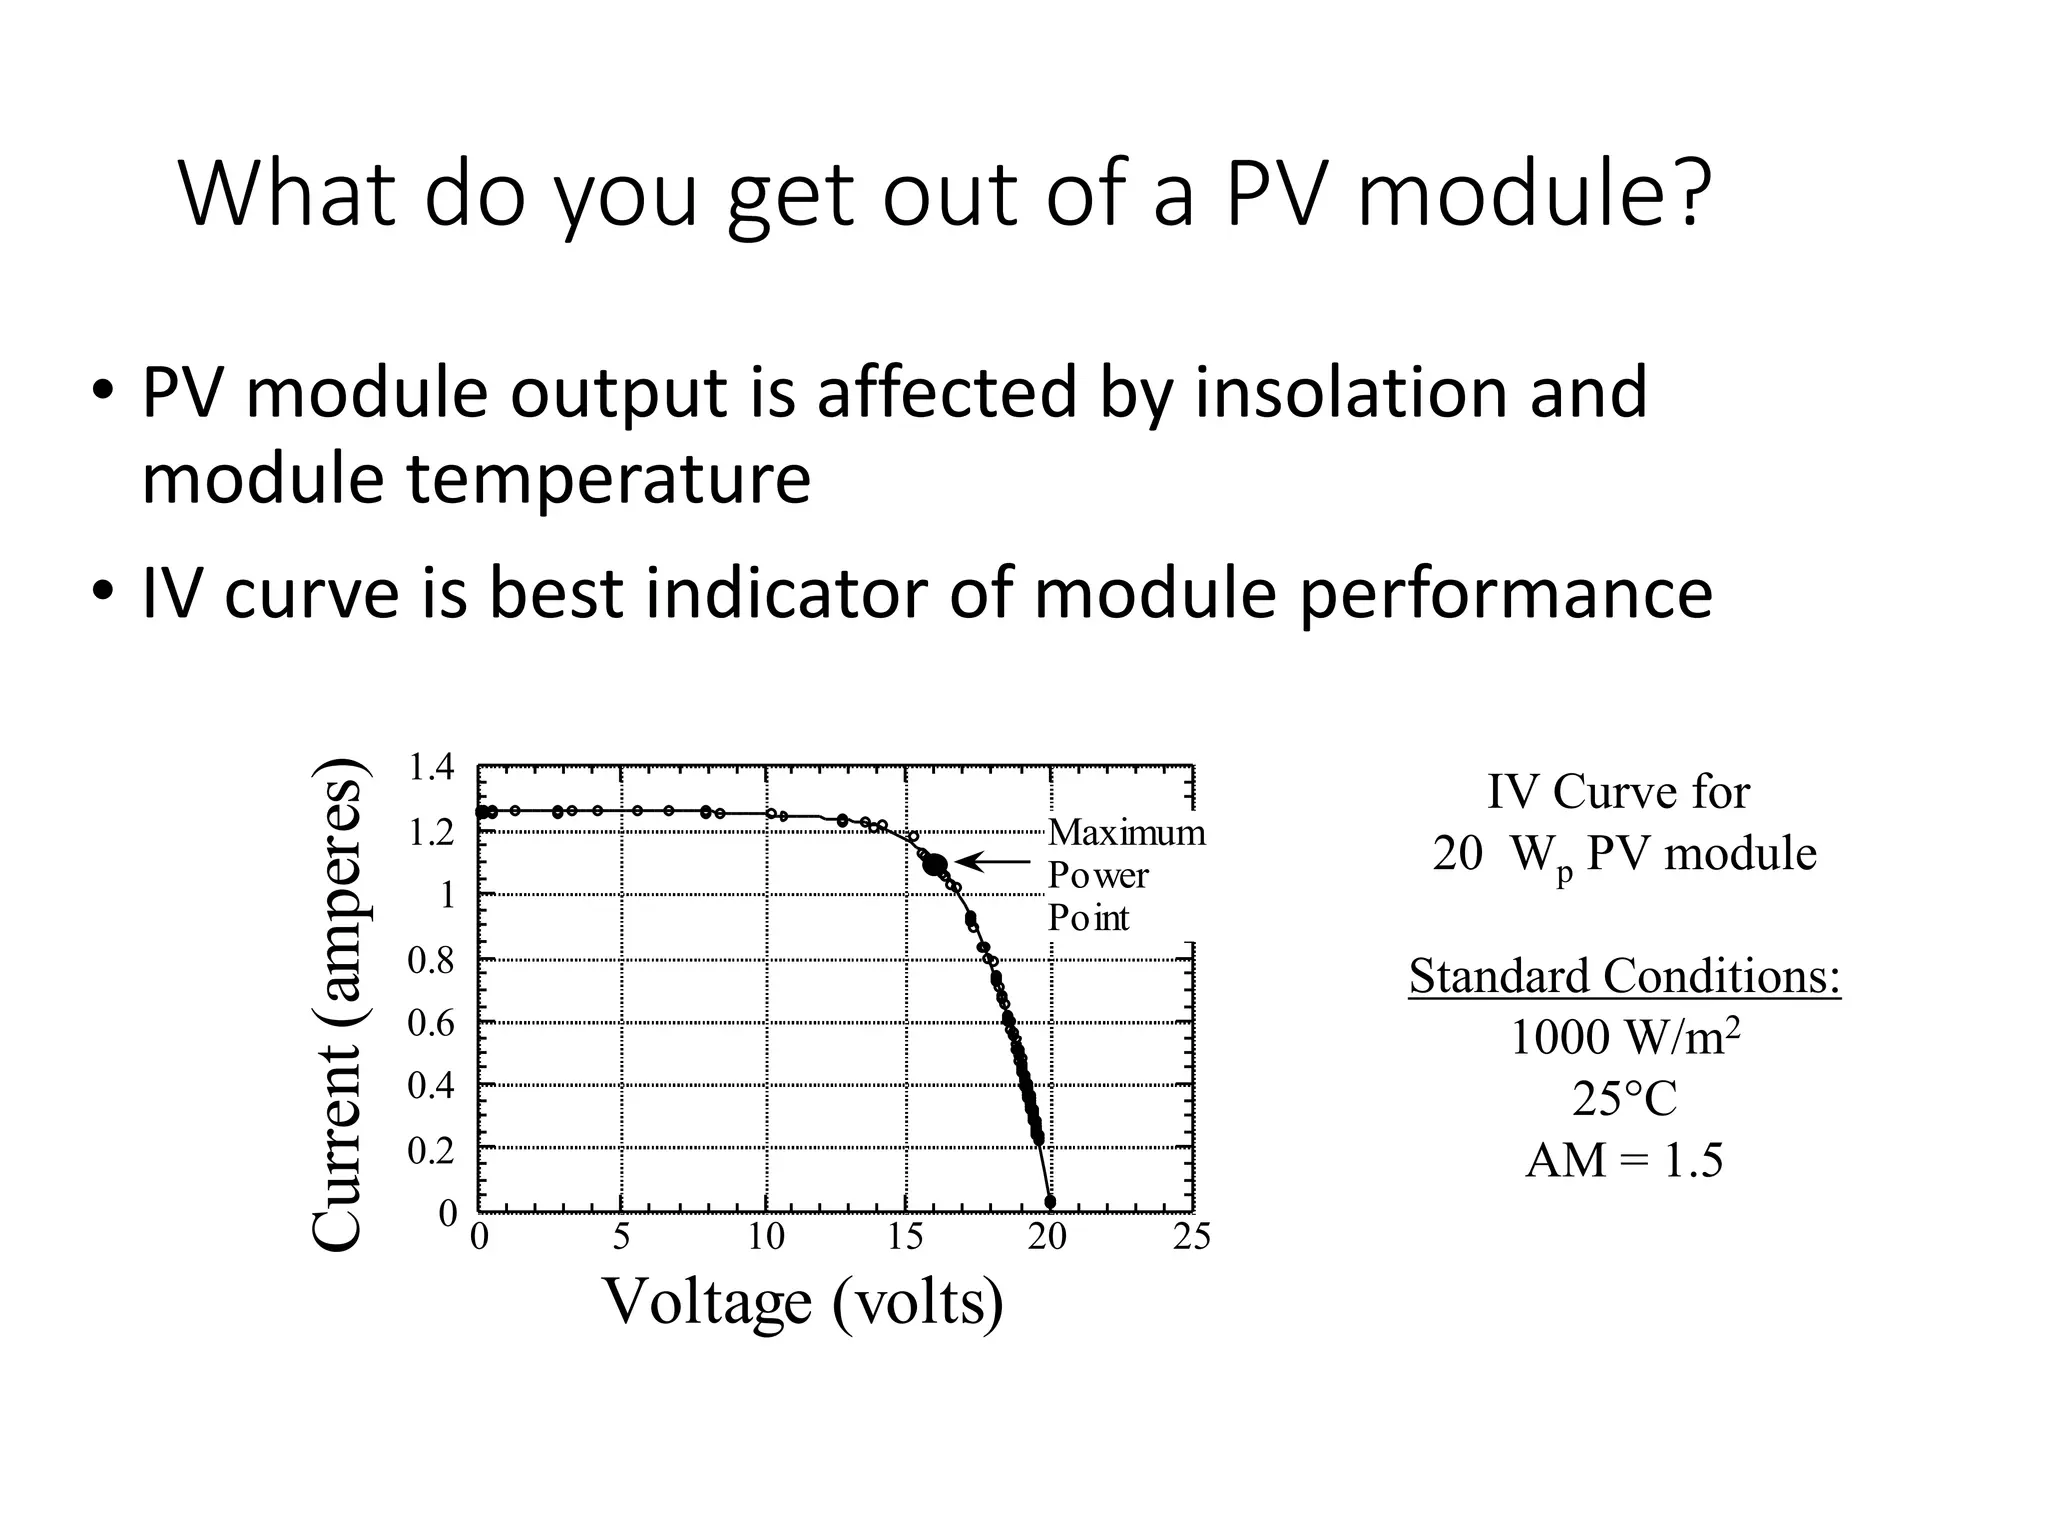
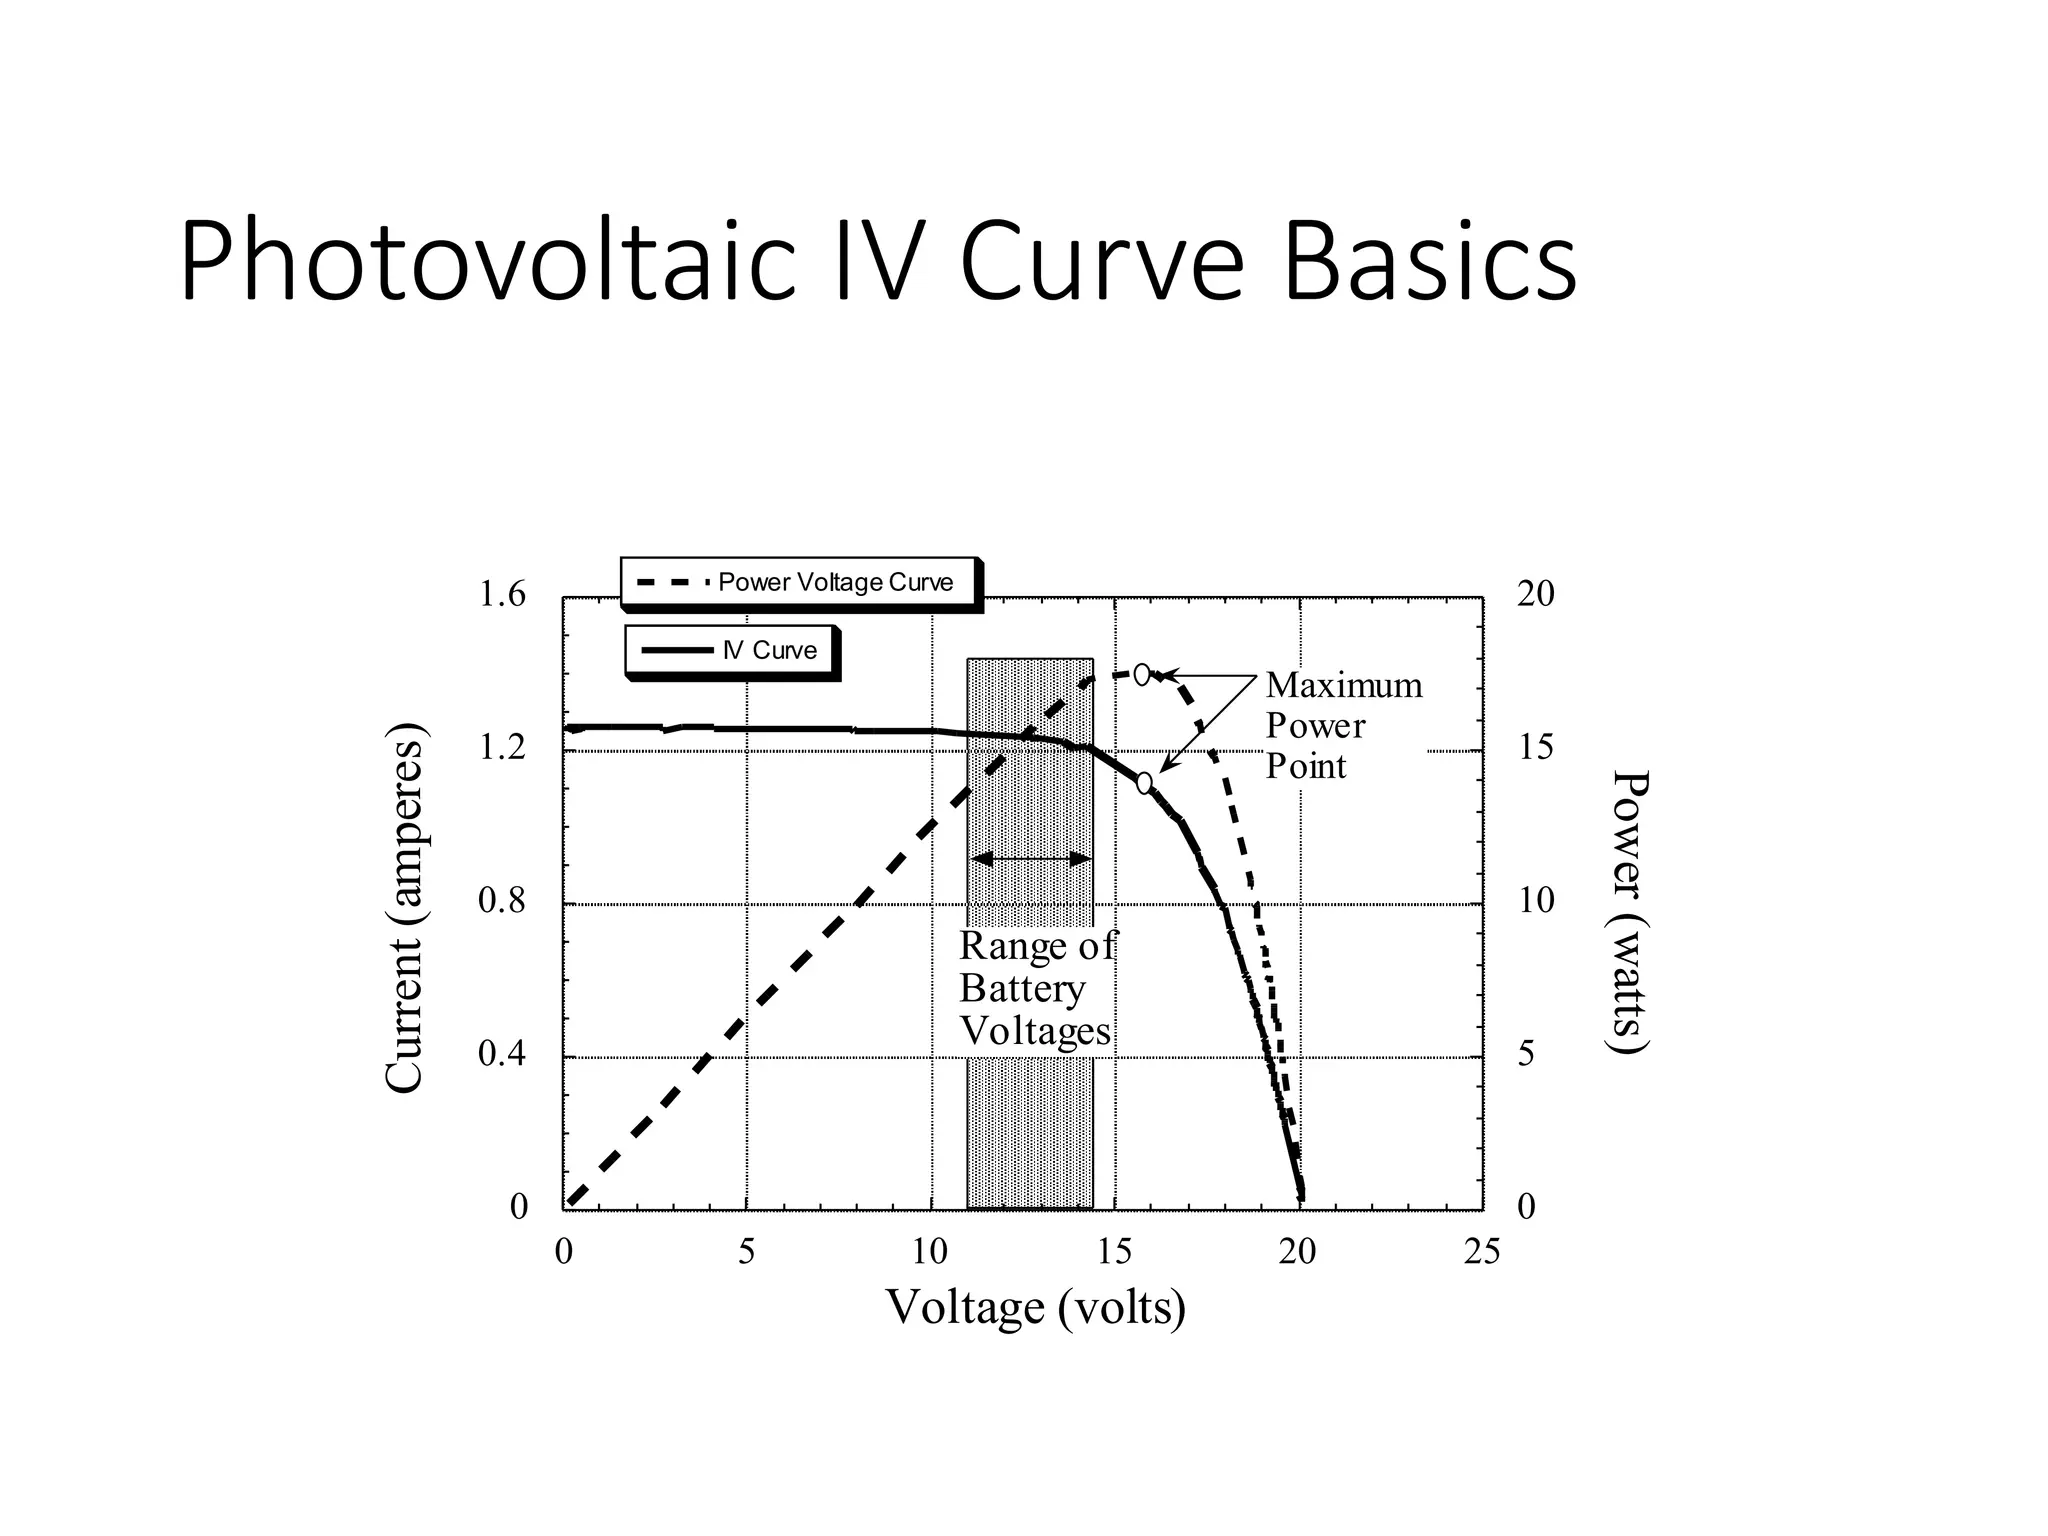
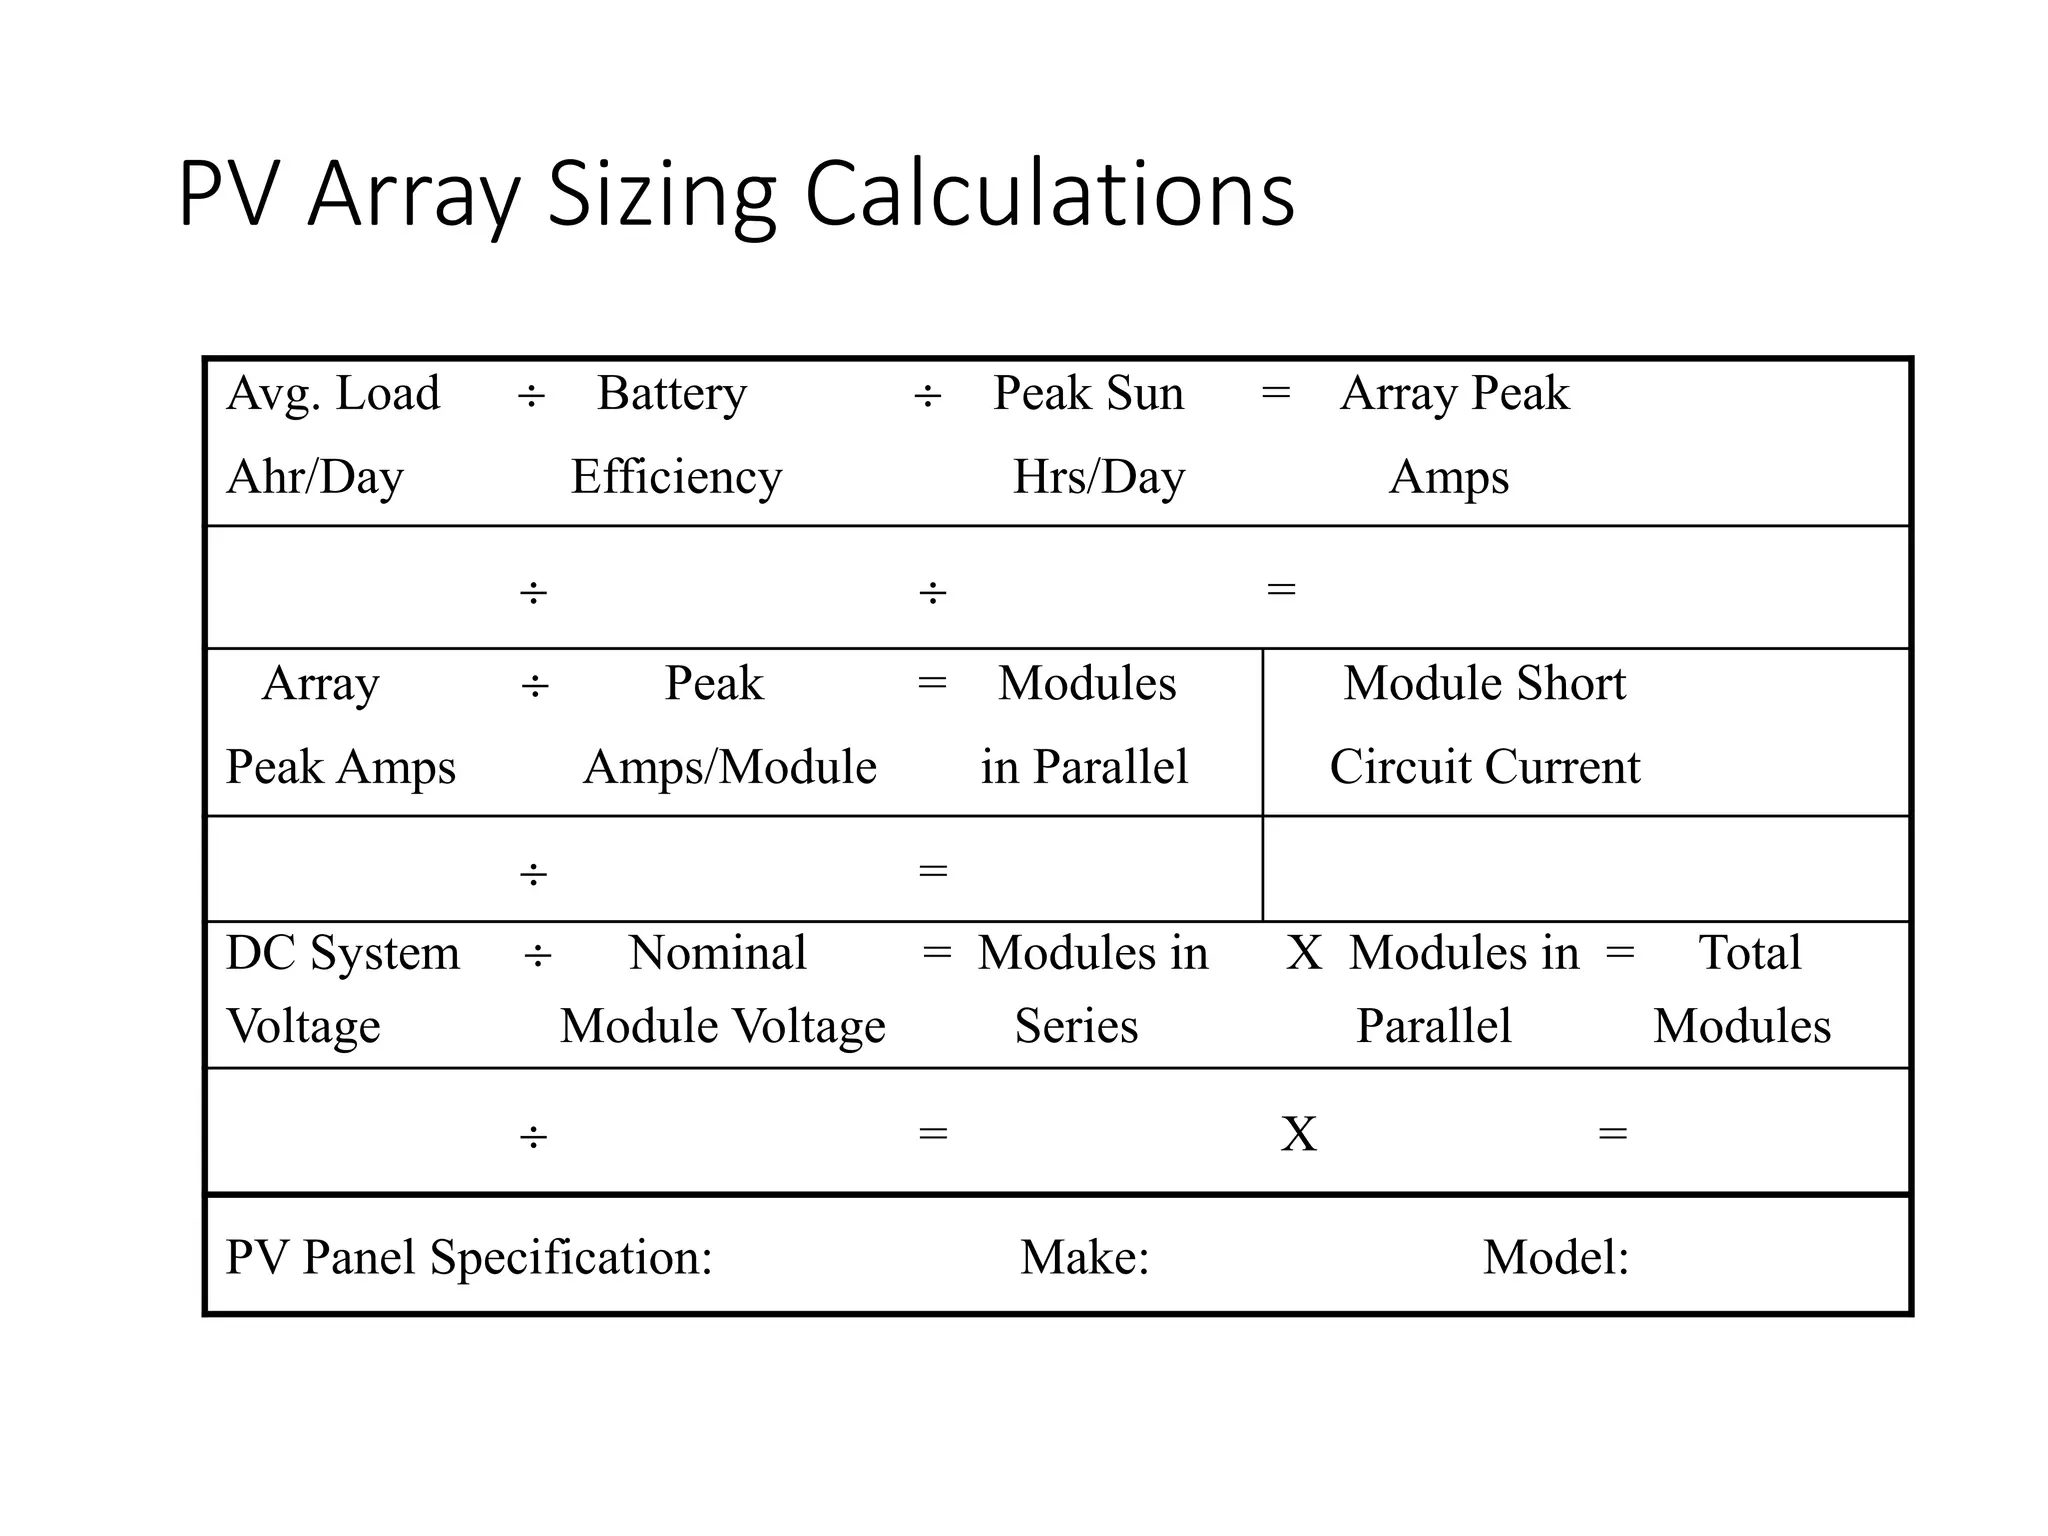
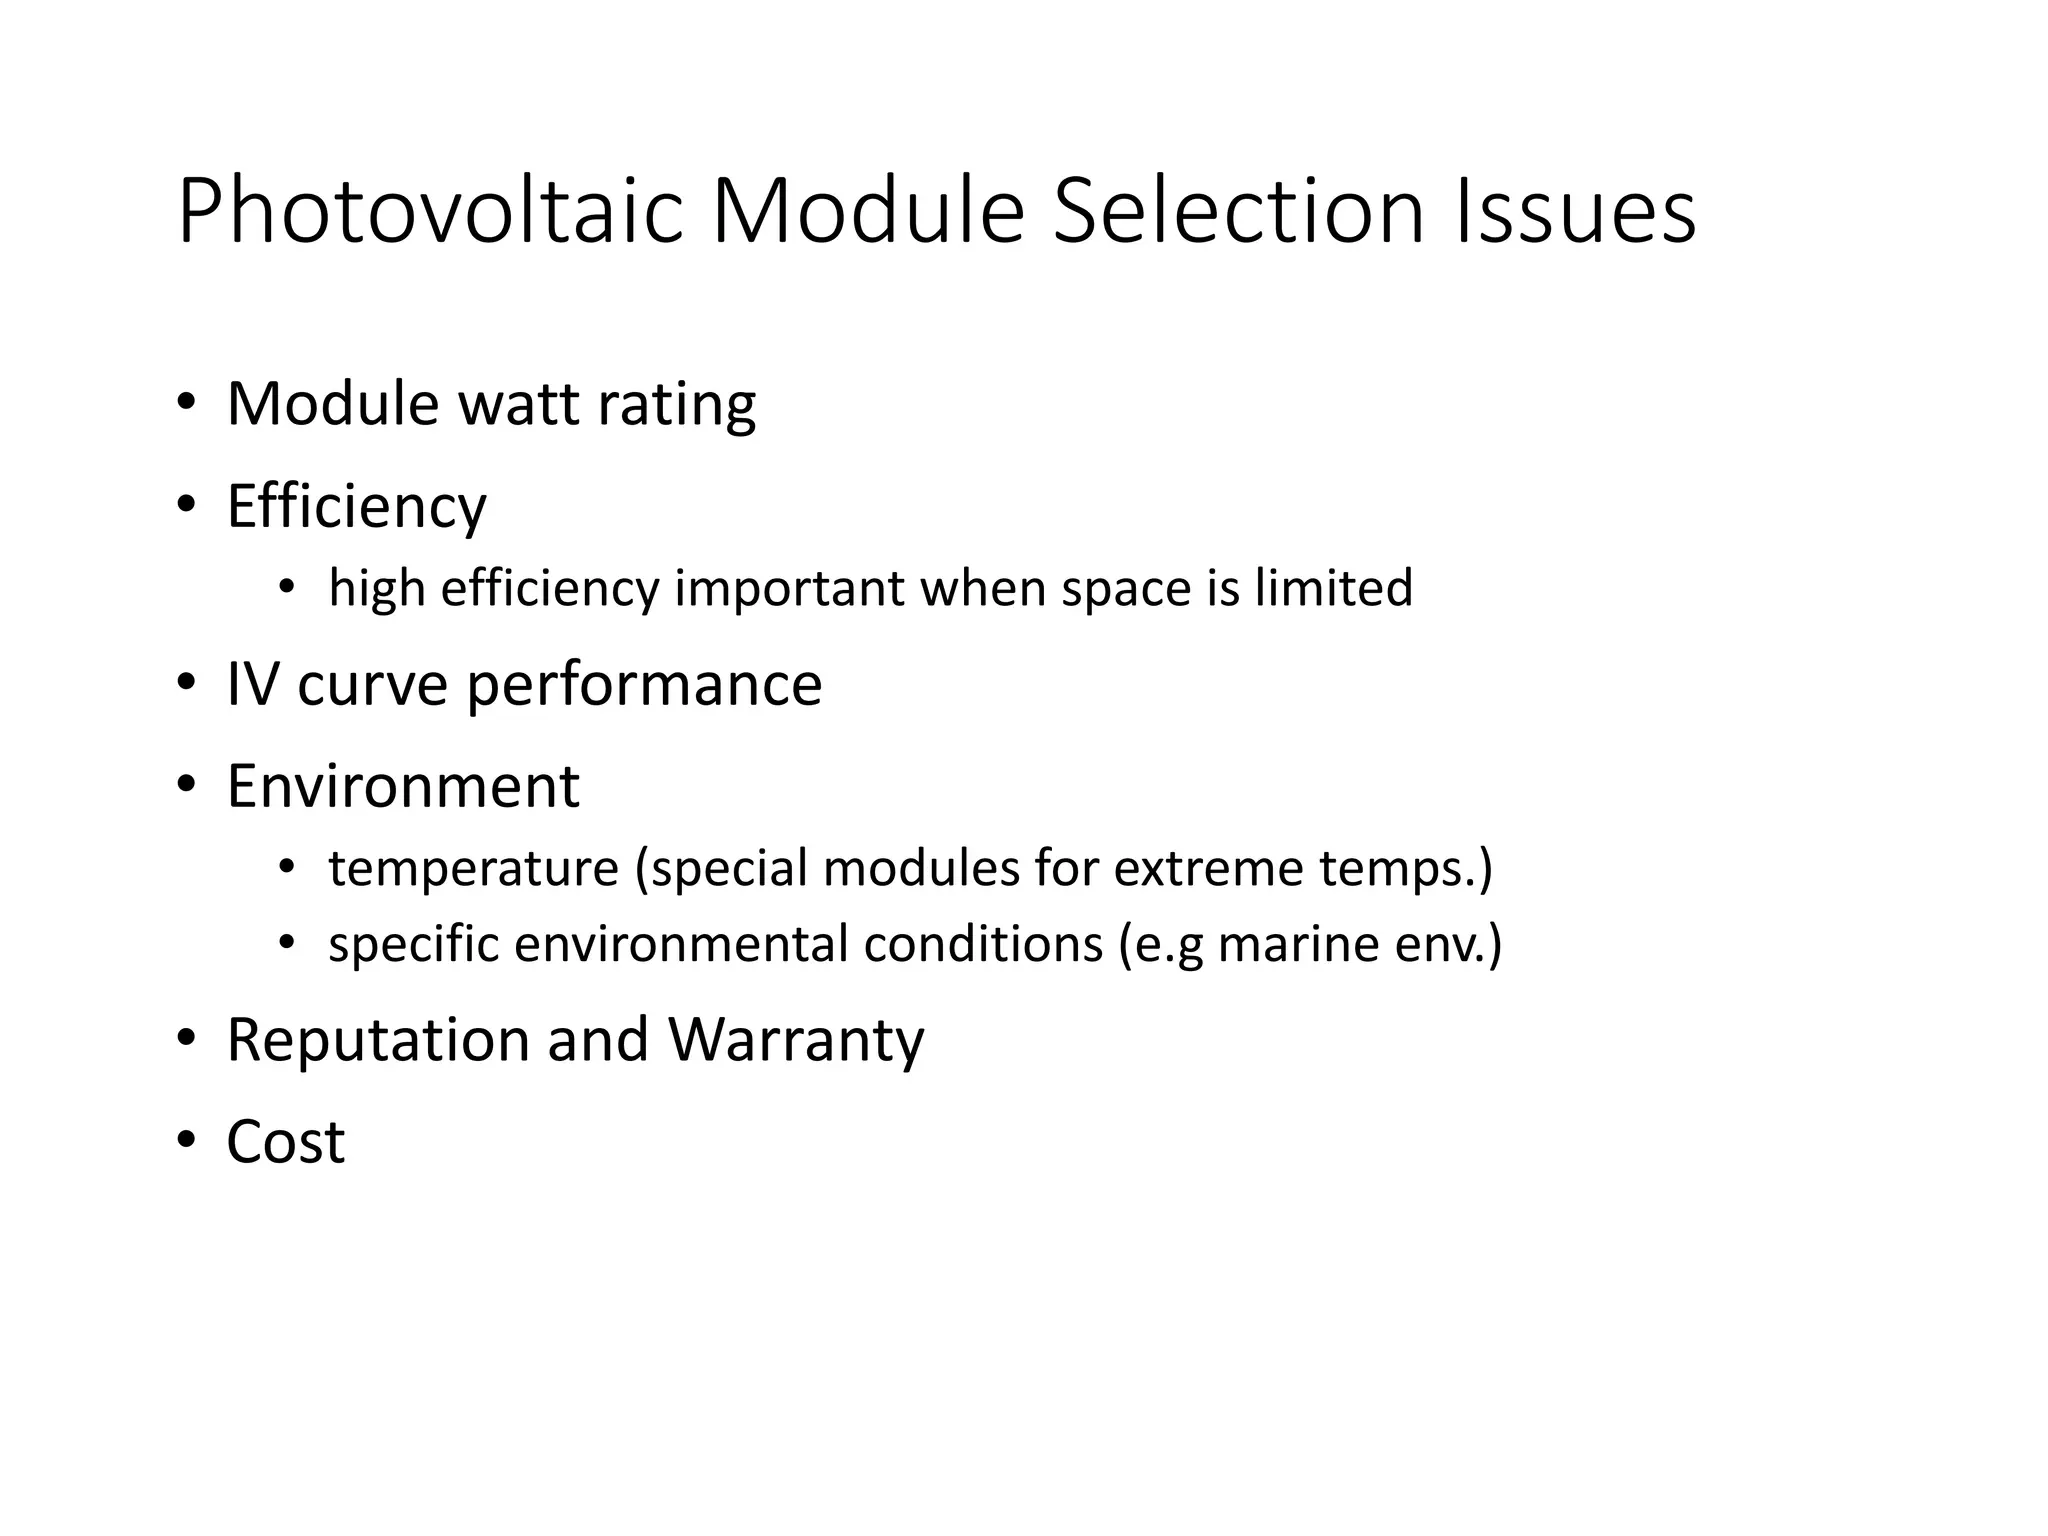
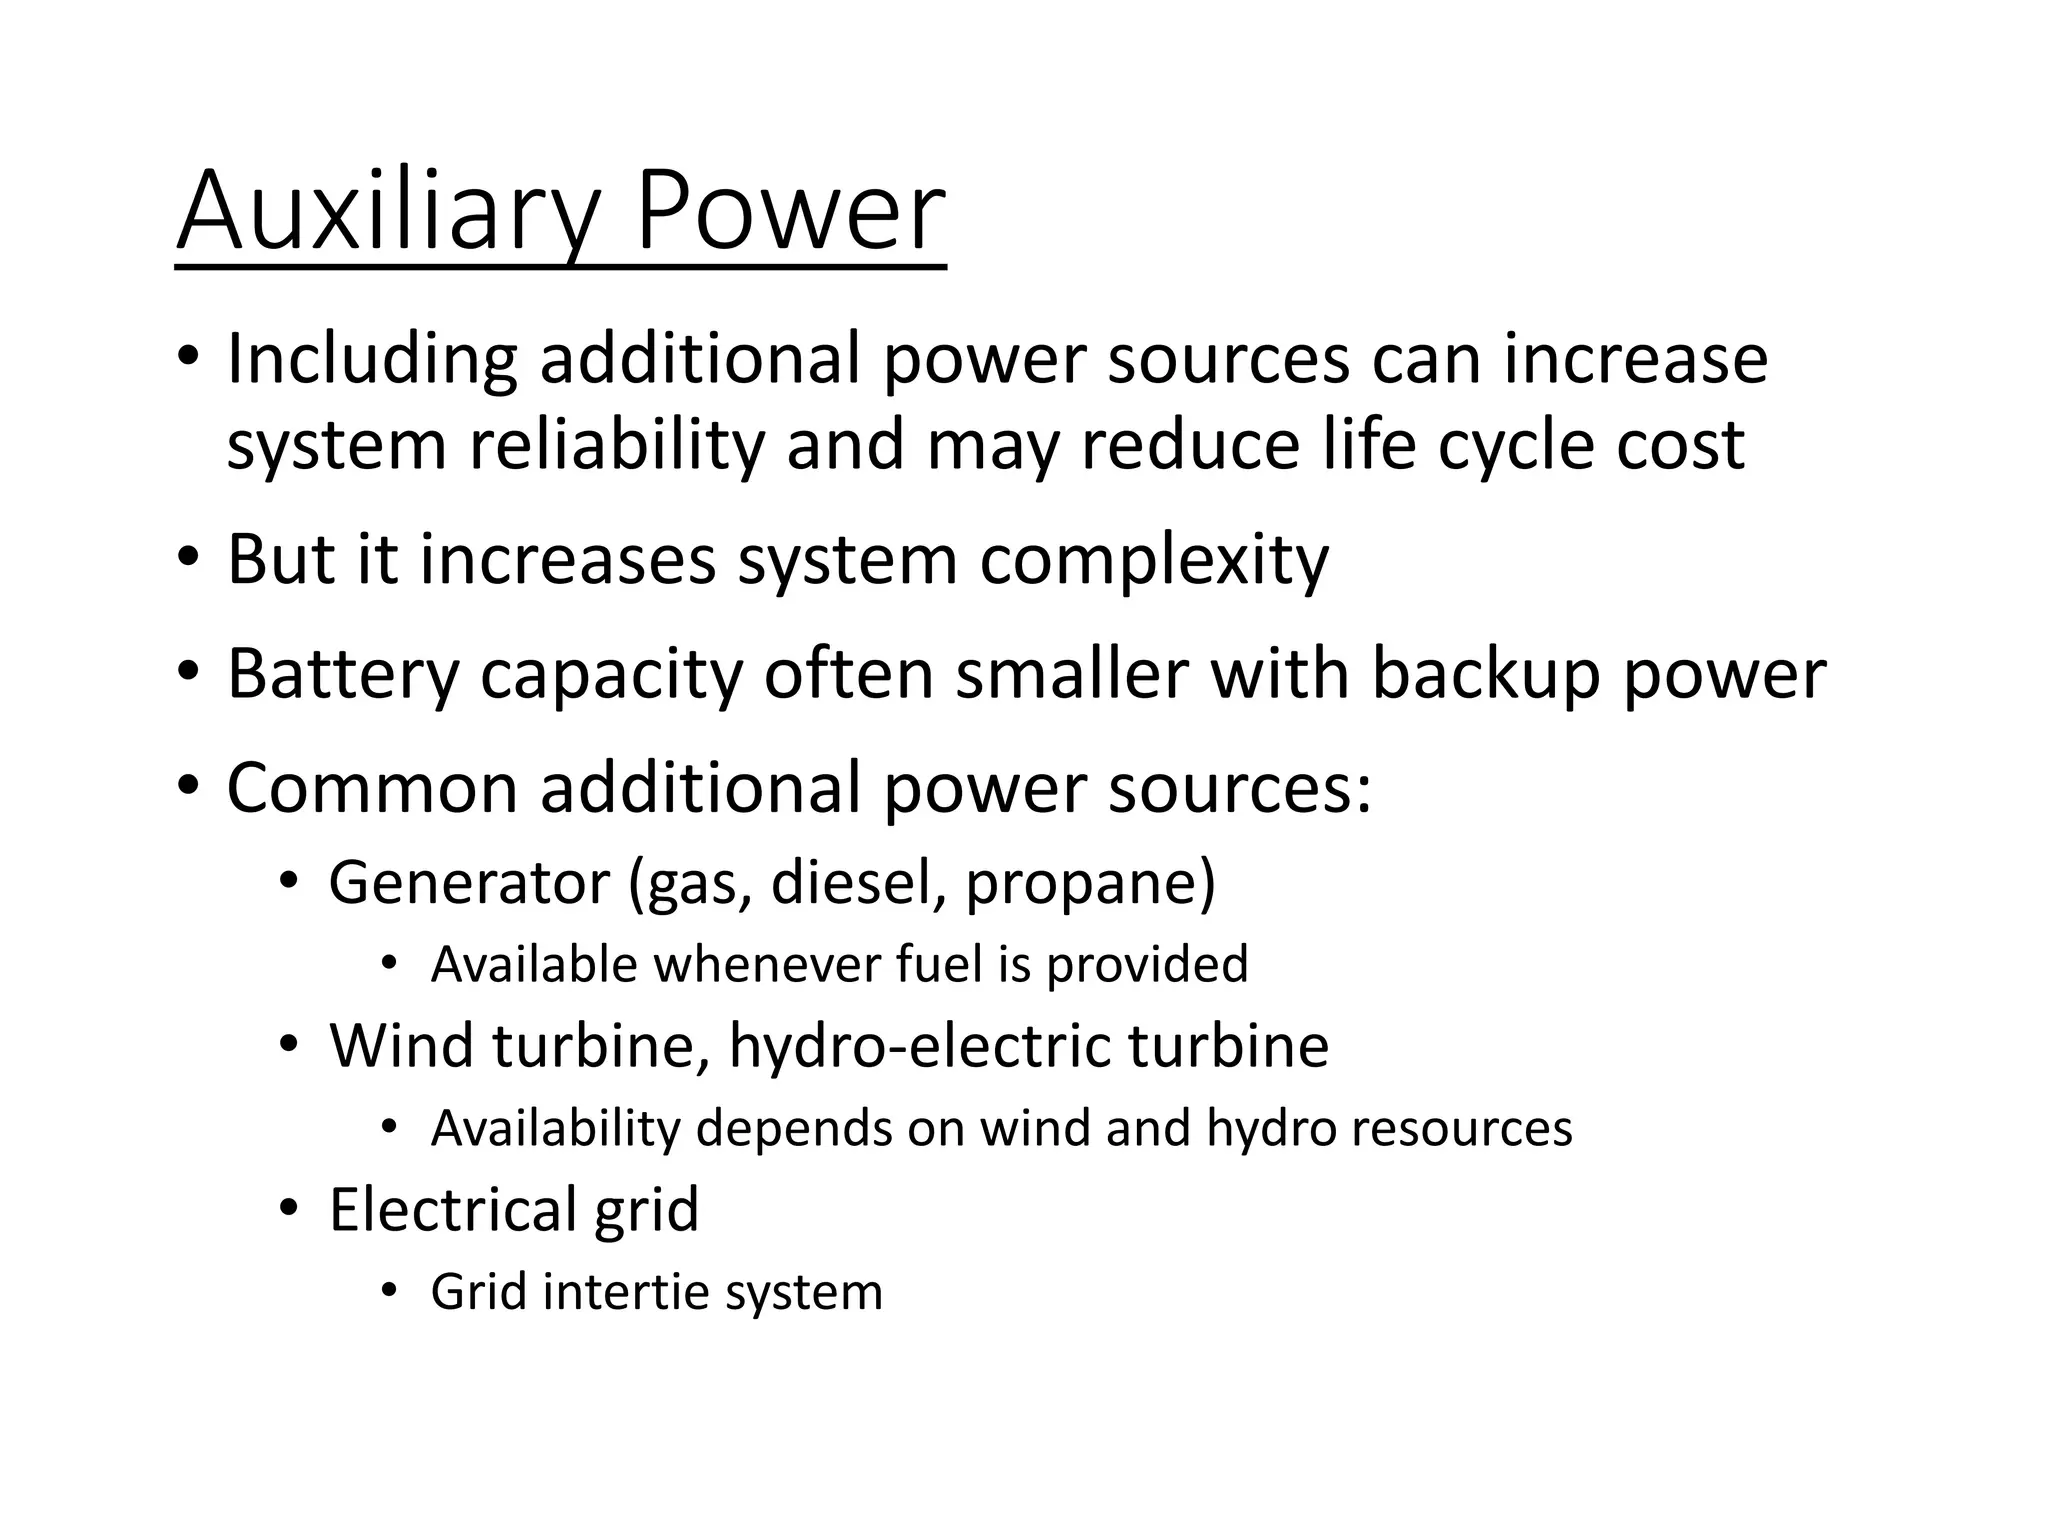
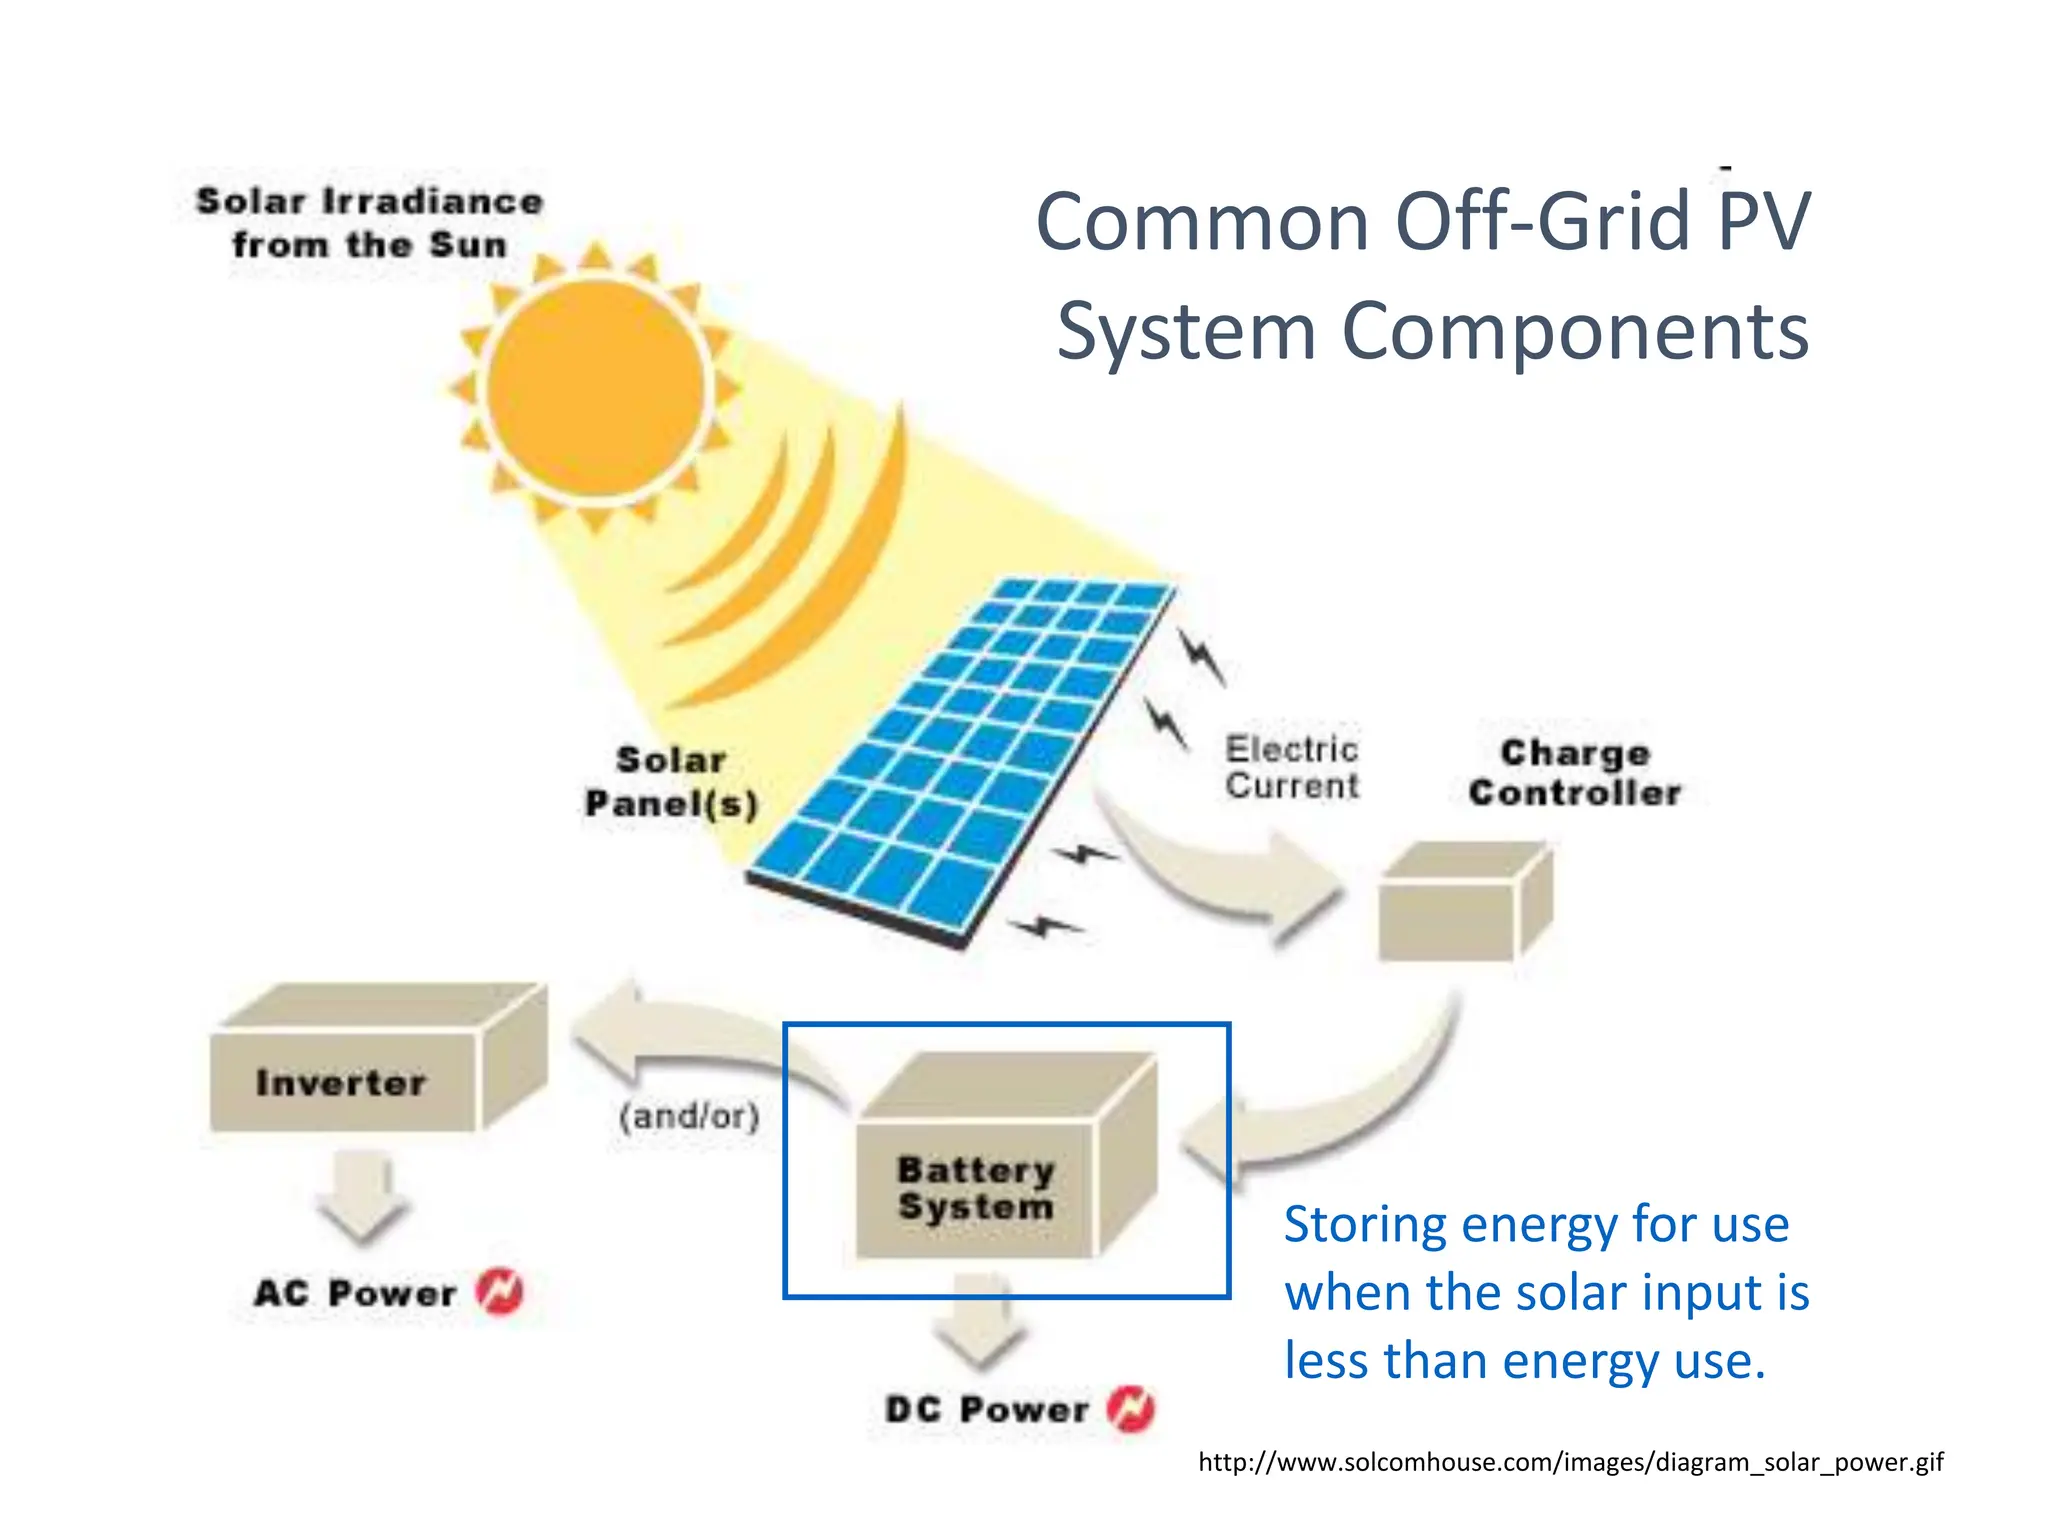
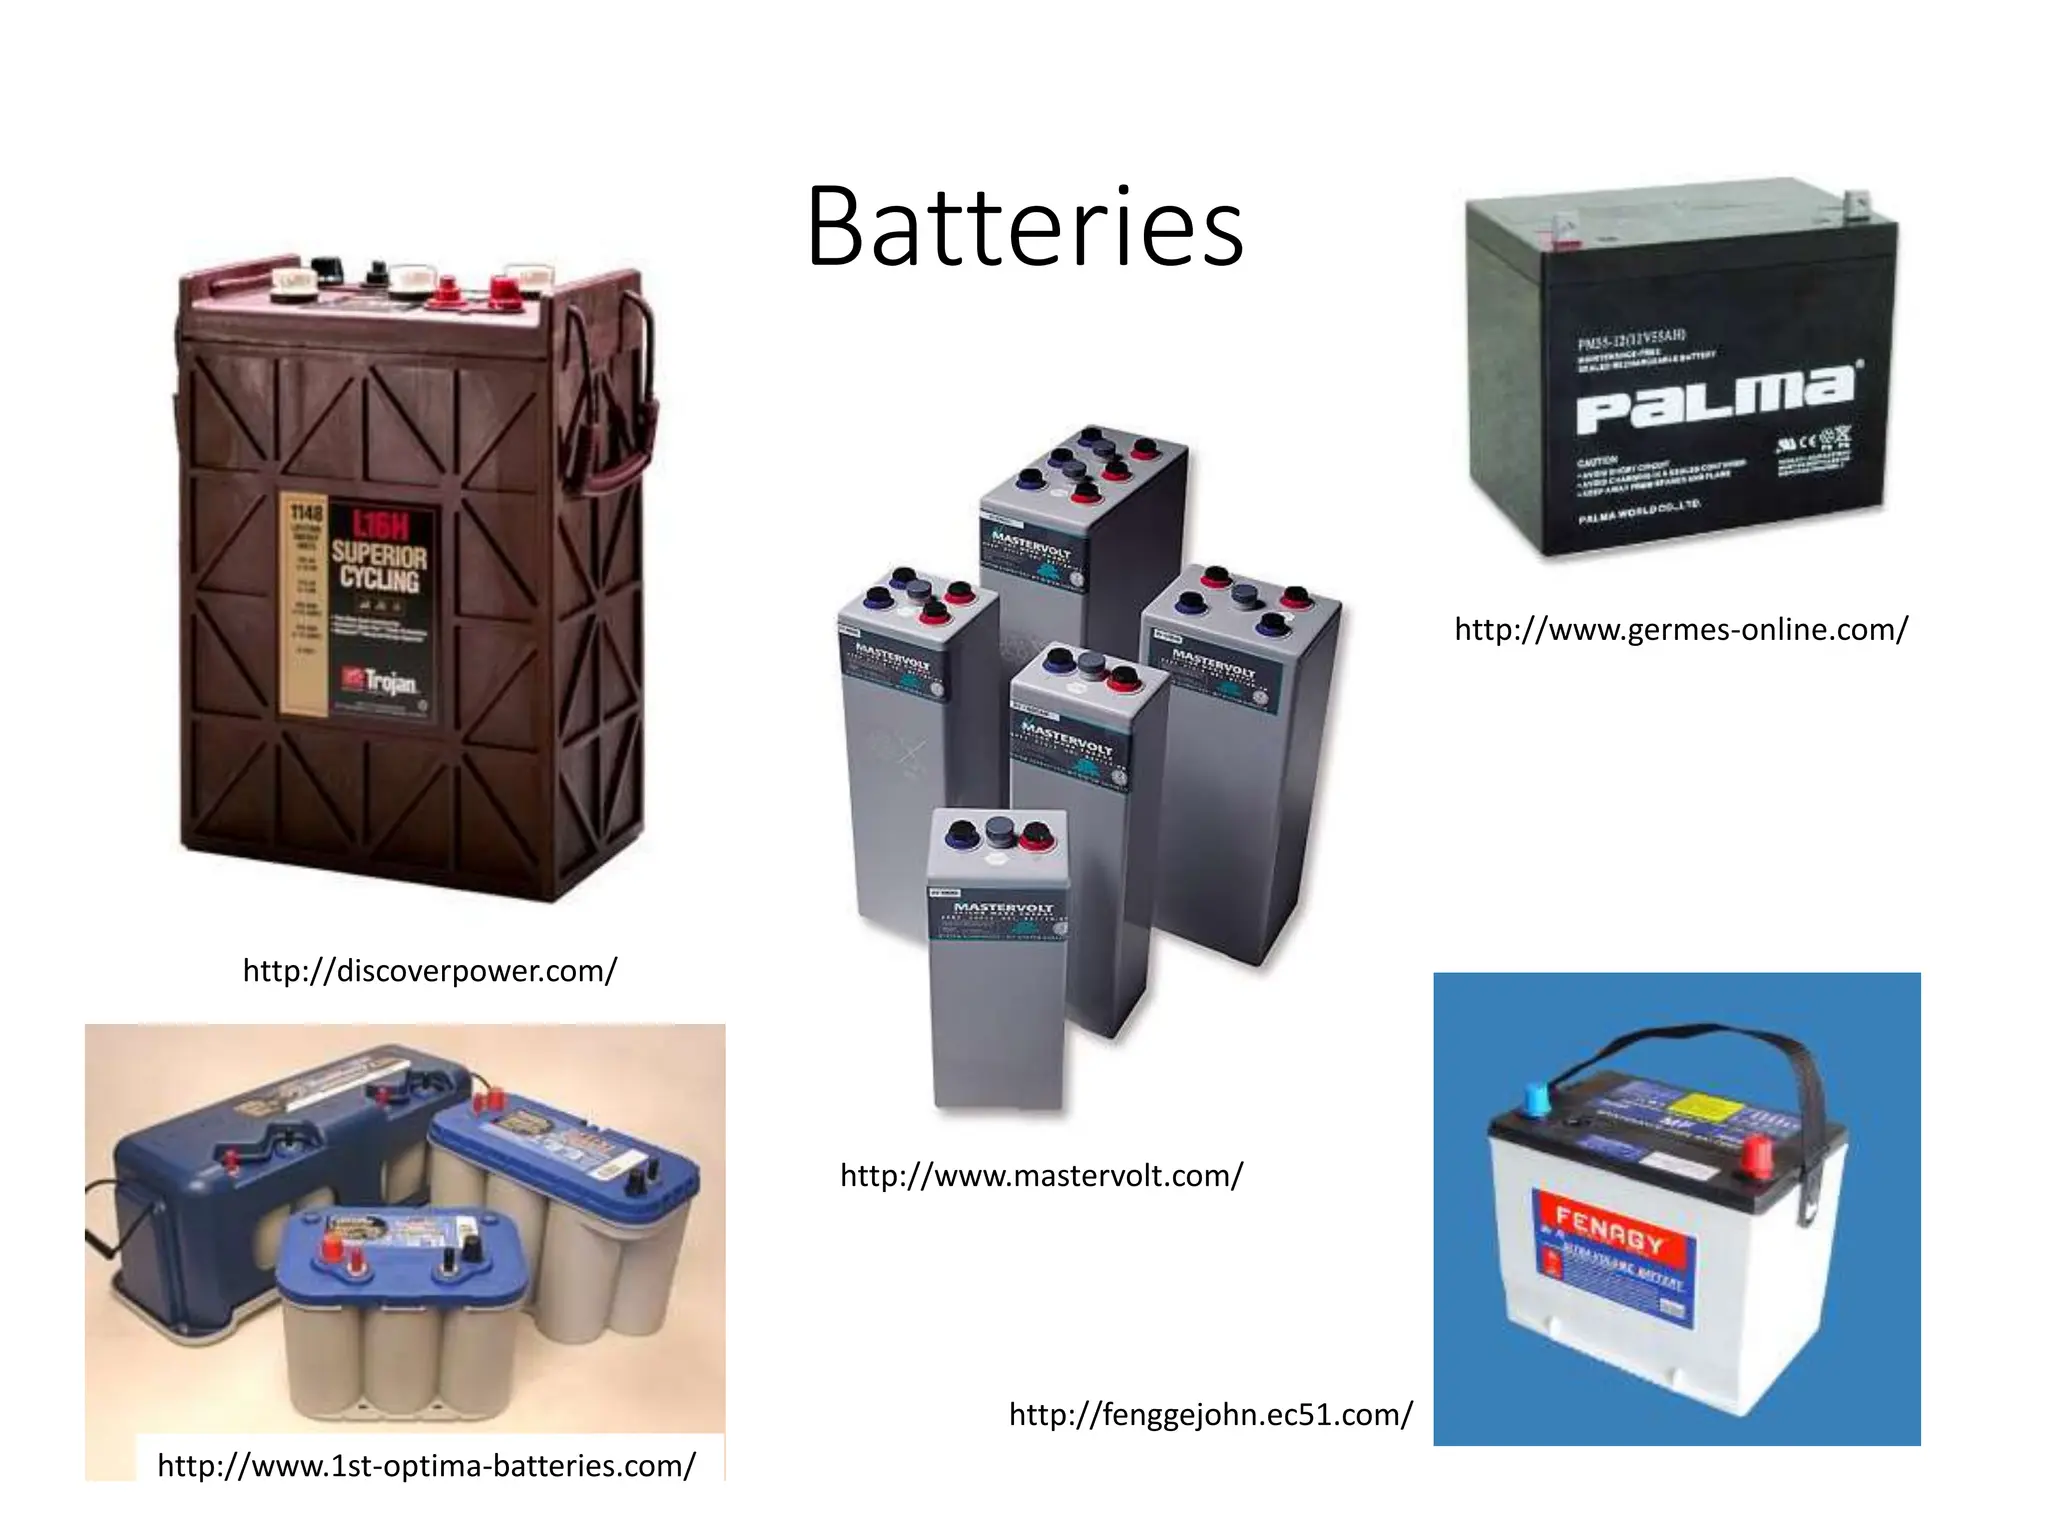
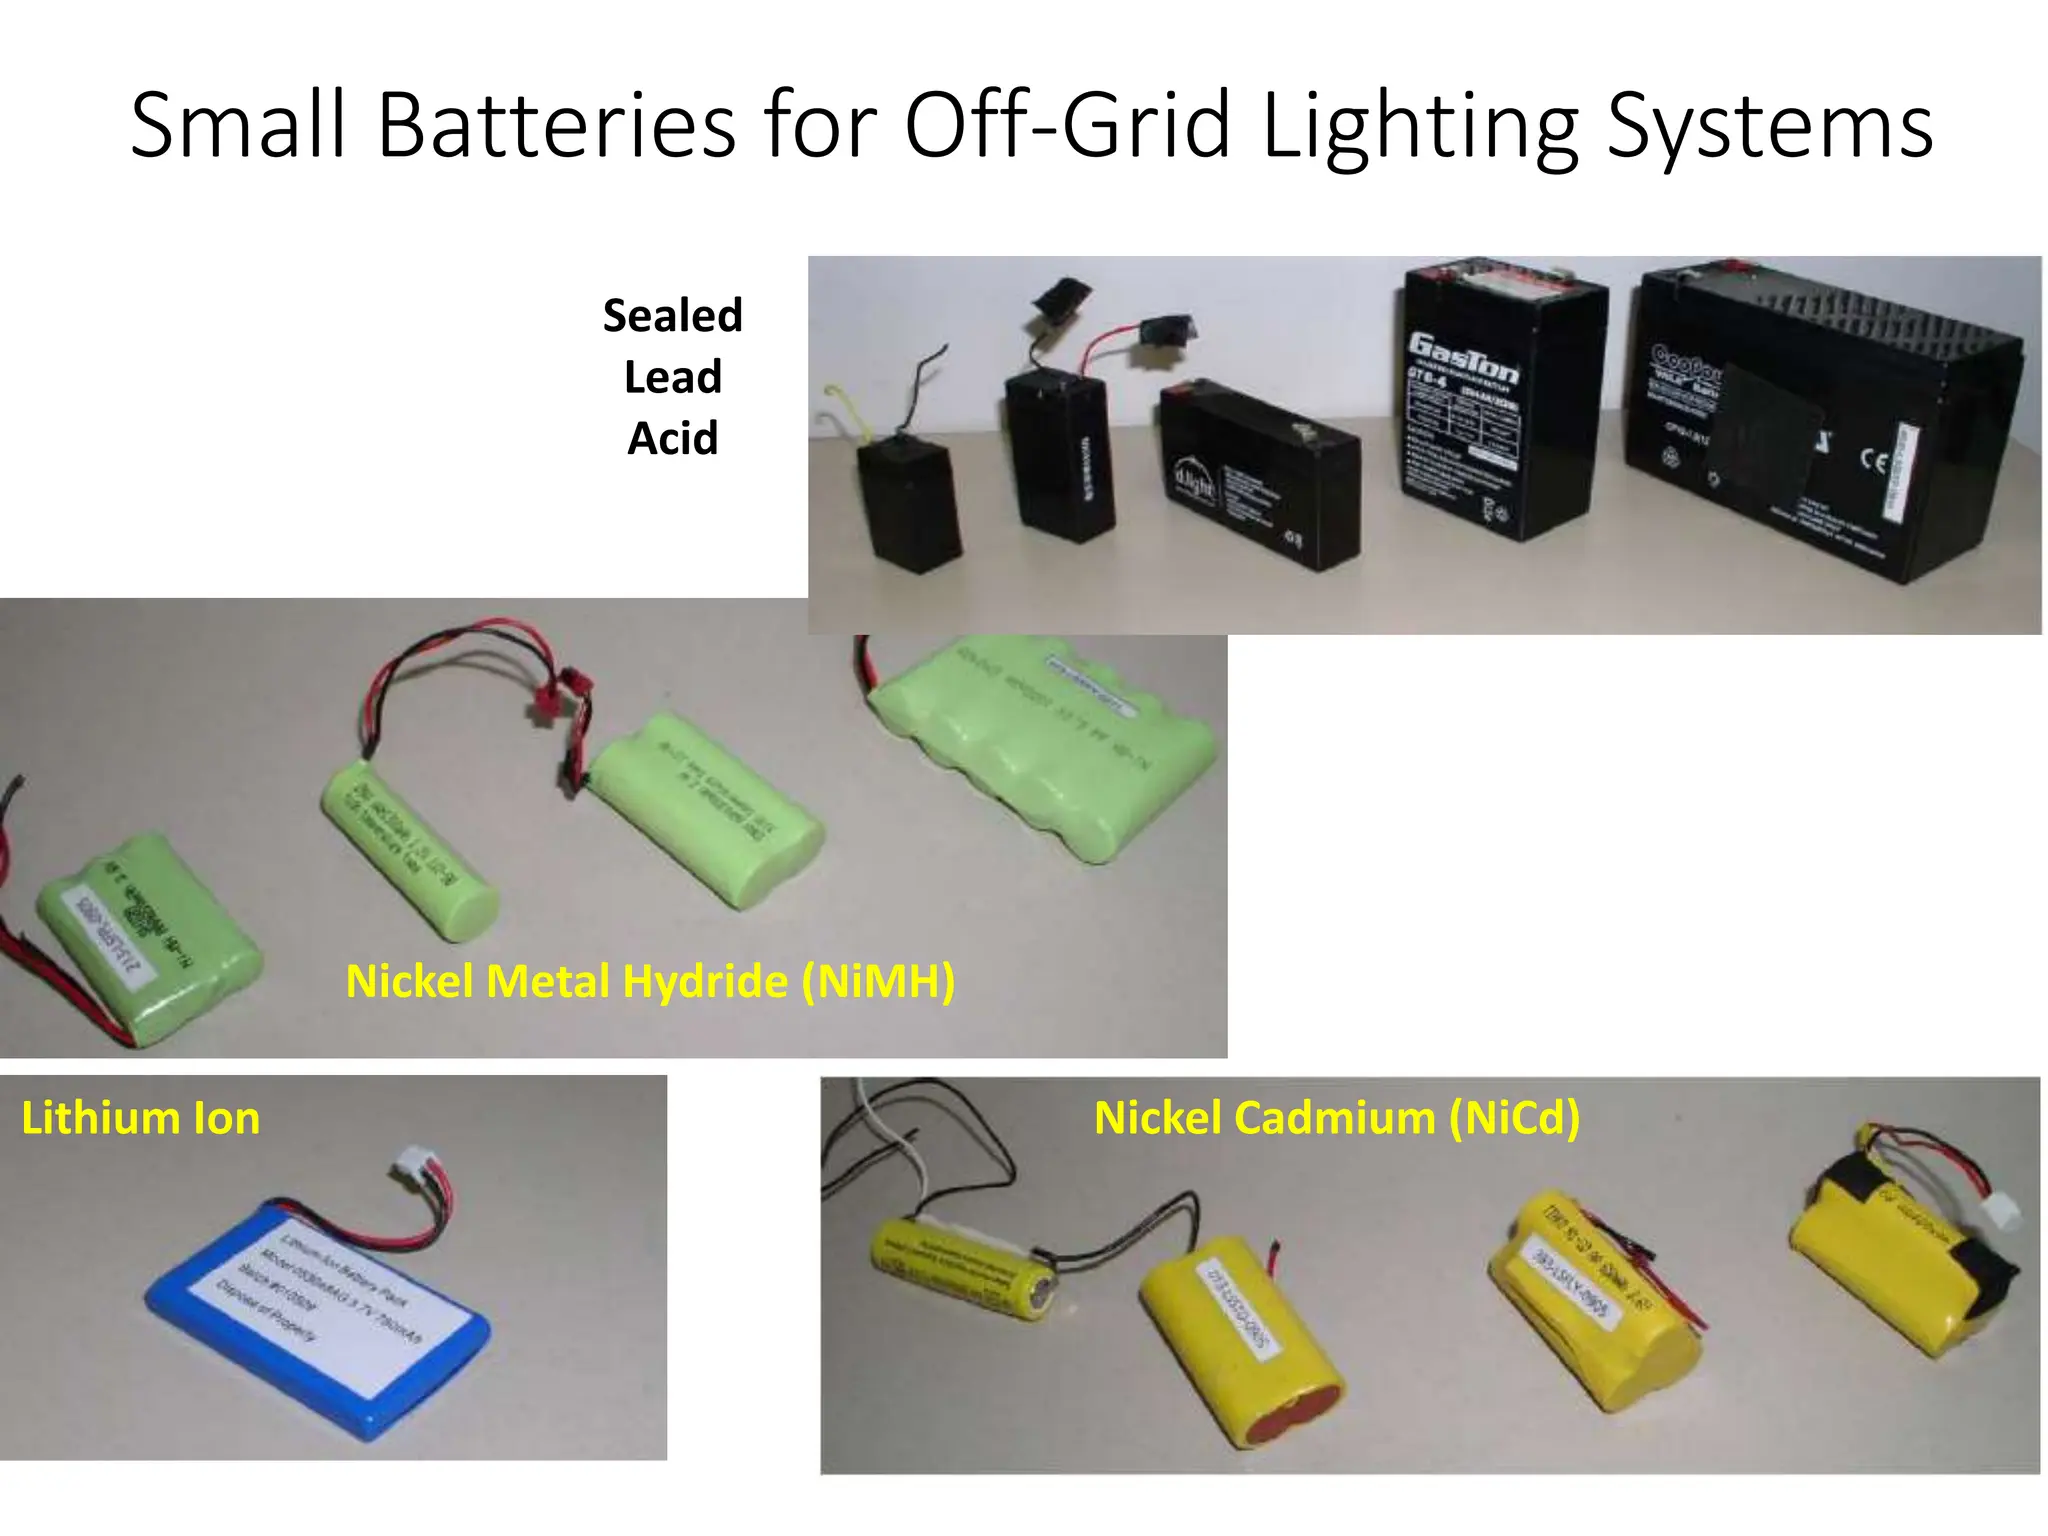
Stand Alone Photovoltaic Systems:
Design Principles and Components
ENGR 475: Renewable Energy Power Systems
Arne Jacobson and Liza Boyle
Fall, 2019
Stand Alone PV Systems
PV Powered Radio Transmitter
in Northern Canada
http://www.canren.gc.ca/
Off-Grid PV Powered
Home in Colorado
http://www.renewableenergyaccess.com
PV Powered Road Sign
http://www.safetysupplyandsign.com/
PV and Wind Powered
Gas Platform in North Sea
http://www.ecofriend.org/
Stand Alone PV Systems
Photos
by
Arne
Jacobson,
Erika
Rosenthal,
Nina
Stam,
and
Shannon
Graham
(clockwise
from
top
left)
Solar Lanterns and LED Lights
Basic (sometimes competing) Design Goals
• Technical functionality and durability
• component selection and integration
• Ease of Installation
• User Interface
• Ease of Maintenance
• Flexibility for change / future growth
• Safety
• human and environmental
• Low Cost
https://realgoods.com/off-grid-solar
Common Off-Grid PV
System Components
Common PV System Components
• PV array
• Auxiliary power sources
• Battery storage
• Charge controller
• Inverter
• AC and DC power handling equipment
• Switches and disconnect
• Fuses and circuit breakers
• Conductors (wires)
• Mounting structures
Off-Grid Lighting System Components
LED or CFL
Battery & Circuitry
Power Source
(solar, AC, dynamo)
Switches, Housing,
Wires, Connectors, etc.
Residential Off-Grid Solar PV System
(basic 12 volt DC configuration)
Drawing my Mike Okendo for Energy for
Sustainable Development Africa, Nairobi, Kenya
Residential Off-Grid Solar PV System
(AC/DC system configuration)
Source: SEI PV Design Manual, p. 102
Steps for PV System Design
• Load evaluation (total energy req’d for loads, peak loads,
AC vs. DC, choosing a system voltage,)
• Solar resource (number and size of PV modules)
• Auxiliary Power (generator, wind, hydro, others)
• Sizing storage (# and type of batteries)
• Charge control strategy
• Siting Issues (solar access, distances)
• Wiring sizing (also disconnects & over-current
protection)
Load Evaluation Equations
• Basic Equations for DC Systems:
• Power = Current * Voltage (P = I*V, W)
• Energy = Power * Time (E = P*∆t, Whr)
• Amp-hour consumption = Current * Time (Ahr)
• AC power a bit more complicated
• Power factor must be considered for some
appliances & inverter combinations
Load Evaluation
• Identify loads and power requirements
• average daily loads and peak loads
• Determine load usage profile over time
• often this is a very crude process
• Hard to estimate actual usage patterns
• Especially true when system does not yet exist
• sometimes iterative approach is req’d
• Get initial load profile, design system, see how much it
costs, then adjust design
Estimating Power Use by
Appliances
• Appliance power consumption data sources (in
order of preference)
• 1) measure power use for appliance
• 2) manufacturer’s data on power use
• (often over-estimates power use)
• 3) “typical” data for appliance type
http://www.codinghorror.com/blog/archives/000353.html
Critical Issues for Load Evaluation
• AC vs. DC power to end use
• AC allows for use of more electrical devices, but
requires purchase of an inverter
• inverter con’s = cost + efficiency (70% - 95%)
• DC common for small systems, AC for large
Critical Issues for Load Evaluation
(cont)
• System voltage (12V, 24V, 48V, etc.)
• AC systems allow for high DC voltage (reduced wire loss)
• DC systems often have 12 VDC (appliance availability)
• Choosing appliances: efficiency usually worth the
extra cost for PV applications
Load Analysis Worksheet
Electric
Load AC DC hrs/day days/wk days AC DC
Light
Light
TV
Radio
Fridge
Hrs
Watt
7
Use
*
Use
*
Watts
Amps
*
Volts
Qty 



Total Daily Load:
Maximum AC Load (Watts)
Maximum DC Load (Watts)
Special Topics for Load Evaluation
• Cycling loads
• i.e. appliances that automatically turn themselves on and
off (e.g. refrigerator)
• “Phantom” loads
• loads that draw power even when they are “off”
• Estimating surge requirements
• some appliances require considerably more power when
starting than during continuous operation
• e.g. motor loads often require 3-5 times their continuous
operating power for a brief time when starting
http://www.solcomhouse.com/images/diagram_solar_power.gif
Common Off-Grid PV
System Components
Solar
Resource
Evaluation
Solar Resource Evaluation
• What is the solar
resource at the site?
• annual average daily;
monthly average daily
• choosing orientation and
tilt for PV array
• impact of shading
• How does resource
match demand?
• seasonal distribution of
loads?
“Full Sun Hours” from
Solar radiation data
0
200
400
600
800
1000
1200
6:00:00 9:00:00 12:00:00 15:00:00 18:00:00
Solar
Radiation
(W/m
2
)
Time of Day
6.8 kWh/m
2
/day
http://www.solcomhouse.com/images/diagram_solar_power.gif
Common Off-Grid PV
System Components
Converting
solar energy
to electricity
What do you get out of a PV module?
• PV module output is affected by insolation and
module temperature
• IV curve is best indicator of module performance
IV Curve for
20 Wp PV module
Standard Conditions:
1000 W/m2
25°C
AM = 1.5
0
0.2
0.4
0.6
0.8
1
1.2
1.4
0 5 10 15 20 25
Current
(amperes)
Voltage (volts)
Maximum
Power
Point
Photovoltaic IV Curve Basics
0
0.4
0.8
1.2
1.6
0
5
10
15
20
0 5 10 15 20 25
IV Curve
Power Voltage Curve
Current
(amperes)
Power
(watts)
Voltage (volts)
Maximum
Power
Point
Range of
Battery
Voltages
PV Array Sizing Calculations
Avg. Load  Battery  Peak Sun = Array Peak
Ahr/Day Efficiency Hrs/Day Amps
  =
Array  Peak = Modules Module Short
Peak Amps Amps/Module in Parallel Circuit Current
 =
DC System  Nominal = Modules in X Modules in = Total
Voltage Module Voltage Series Parallel Modules
 = X =
PV Panel Specification: Make: Model:
Photovoltaic Module Selection Issues
• Module watt rating
• Efficiency
• high efficiency important when space is limited
• IV curve performance
• Environment
• temperature (special modules for extreme temps.)
• specific environmental conditions (e.g marine env.)
• Reputation and Warranty
• Cost
Auxiliary Power
• Including additional power sources can increase
system reliability and may reduce life cycle cost
• But it increases system complexity
• Battery capacity often smaller with backup power
• Common additional power sources:
• Generator (gas, diesel, propane)
• Available whenever fuel is provided
• Wind turbine, hydro-electric turbine
• Availability depends on wind and hydro resources
• Electrical grid
• Grid intertie system
http://www.solcomhouse.com/images/diagram_solar_power.gif
Common Off-Grid PV
System Components
Storing energy for use
when the solar input is
less than energy use.
Battery Storage for PV Systems
• Batteries provide storage for PV and other RE
systems
• Batteries store day time energy for night use
• Systems often have storage capacity for 2 to 10
cloudy days
• Batteries cannot store energy for more than a
few weeks due to “self-discharge” effect
Batteries
http://discoverpower.com/
http://www.germes-online.com/
http://fenggejohn.ec51.com/
http://www.mastervolt.com/
http://www.1st-optima-batteries.com/
Small Batteries for Off-Grid Lighting Systems
Sealed
Lead
Acid
Nickel Metal Hydride (NiMH)
Nickel Cadmium (NiCd)
Lithium Ion
Battery Types
• Lead Acid (Pb-acid) Battery
• Flooded cells (a.k.a. open wet cells)
• Starting and lighting battery (SLI)
• Deep cycle battery (many types)
• Sealed wet cells
• Gel cells
• Nickel Cadmium (NiCd)
• Nickel Iron (NiFe)
• “New” battery technologies {nickel metal hydride
(NiMH), lithium ion (Li-Ion), lithium iron phosphate
(LiFePO4), and others}
Battery Experience Curves
Schmidt O., Hawkes A. & Staffell I. “The future cost of electrical energy storage based on
experience rates” Nature July 2017.
Battery Cost Trend Range and Projections
Björn Nykvist & Måns Nilsson, Nature Climate Change 5, 329–332 (2015)
doi:10.1038/nclimate2564
Inside a Lead Acid Battery
Images Developed by Kevin R. Sullivan of Skyline College in San Bruno, CA
see http://www.autoshop101.com/trainmodules/batteries/101.html
Pb-Acid Battery Chemistry
 Charging
Pb + PbO2 + 2H2SO4 <=> 2PbSO4 + 2H2O
Discharging 
Anode (-): Pb (pure lead)
Cathode (+): PbO2 (lead oxide)
Electrolyte: sulfuric acid/water solution
• Specific gravity of electrolyte changes with state of
charge (ratio of water and sulfuric acid changes)
Battery Vocabulary
• Battery Capacity
• Ahr of storage @ C-xx (or @ 0.xC)
• Whr of storage
• Days of autonomy = # days batteries can meet load
without being charged
• Rate of discharge or charge
• C-xx charge rate = Current at which the battery will be
completely discharged in “xx” hours
• e.g. for 50 Ahr battery, C-10 is 5 amps
• Alternatively, 0.1C is 5 amps
More Battery Vocabulary
• State of Charge (SOC)
• % of battery capacity (in Ahr) remaining
• Depth of Discharge (DOD)
• % of battery capacity (in Ahr) removed
e.g. 40% SOC = 60% DOD
• Usable Storage Capacity = Ahr Capacity * Max
recommended DOD
• Cycle life = # of discharge - charge cycles a battery
can provide before its useful life is over
Good Practices for Pb-Acid Battery Use
• Respect limits of each battery type
• Avoid deep discharges
• “deep” is different for different technologies
• deep discharges cause “sulfation” of lead plates
• Charge battery to full regularly
• Use moderate charge rates (C-5 is max)
• Equalize batteries every few months
• overcharging helps remove sulfate from plates
• Electrolysis during overcharging stirs up electrolyte
Impact of DOD on Cycle Life
(data for gel cell type Pb-acid battery)
Impact of High Voltage Set Point and Depth of
Discharge on Cycle Life
Pb-Acid Battery Capacity and Temperature
• Lower temperatures decrease capacity
• Higher temperatures increase capacity, but reduce cycle life
Comparison of Common Battery Technologies
Pb-Acid
wet cell
deep cyc
Pb-Acid
sealed
shallow cyc
Pb-Acid
Gel Cell
NiCd
wet cell
rec.
DOD 40-80% 15-25% 15-25% 100%
Self-
discharge
(per mo.)
5% 1-4% 2-3% 3-6%
Typ. Cap.
(Ahr/ft3
) 1000 700 250 500
Range
(Ahr/ft3
)
200-
1425
160-
1400
100-
460
100-
1000
Typ. Cap.
(Ahr/lb) 5.5 4.6 2.2 5.0
Comparison of Small Battery Types
Source: Lighting Global Technical Note No. 10 “Lithium-ion Battery Overview” (May, 2012),
http://www.lightingafrica.org/resources/technical-notes.html
Battery Selection Issues
• Battery storage capacity
• Maximum charge and discharge currents
• avoid currents that exceed the C-5 rate
• Match battery voltage to system voltage
• Pb-Acid batteries come in 2 V, 6 V, and 12 V
configurations
• Add batteries in series to increase voltage
• Add batteries in parallel to increase storage capacity
Battery Selection Issues (cont)
• Cycle depth characteristics
• shallow vs. deep cycle, etc.
• Maintenance requirements
• e.g. low maintenance battery good for remote apps
• Environment and Special use requirements
• e.g. temperature performance varies by battery type
• e.g. sealed batteries do not have to be installed upright
• Cost
Battery Sizing Calculations
AC Average  Inverter + DC Average  DC System = Average Amp-
Daily Load efficiency Daily Load voltage hours/Day
[(  ) + ]  =
Average X Days of  Discharge  Battery Ahr = Batteries in
Amp-hours/day Autonomy Limit Capacity Parallel
X   =
DC System  Battery = Batteries X Batteries = Total
Voltage Voltage in Series in Parallel Batteries
 = X =
Battery Specification: Make: Model:
Some Battery Installation Issues
• Well ventilated enclosure
• Vent H2 and O2 gases from electrolysis
• Vent corrosive sulfur compounds
• Keep batteries away from ignition sources
• Clean, dry area with moderate temperatures
• Use over-current protection (fuses, circuit breakers, and
disconnect switches)
• Protect against acid spills (wet cell Pb-acid)
• Have water and baking soda available if spill occurs
• Maintenance issues
• Configure batteries for easy access

OffGrid_PV_Design_F19_part1.pptx Lecture from Humboldt State University

  • 1.
    Stand Alone PhotovoltaicSystems: Design Principles and Components ENGR 475: Renewable Energy Power Systems Arne Jacobson and Liza Boyle Fall, 2019
  • 2.
    Stand Alone PVSystems PV Powered Radio Transmitter in Northern Canada http://www.canren.gc.ca/ Off-Grid PV Powered Home in Colorado http://www.renewableenergyaccess.com PV Powered Road Sign http://www.safetysupplyandsign.com/ PV and Wind Powered Gas Platform in North Sea http://www.ecofriend.org/
  • 3.
    Stand Alone PVSystems Photos by Arne Jacobson, Erika Rosenthal, Nina Stam, and Shannon Graham (clockwise from top left)
  • 4.
  • 5.
    Basic (sometimes competing)Design Goals • Technical functionality and durability • component selection and integration • Ease of Installation • User Interface • Ease of Maintenance • Flexibility for change / future growth • Safety • human and environmental • Low Cost
  • 6.
  • 7.
    Common PV SystemComponents • PV array • Auxiliary power sources • Battery storage • Charge controller • Inverter • AC and DC power handling equipment • Switches and disconnect • Fuses and circuit breakers • Conductors (wires) • Mounting structures
  • 8.
    Off-Grid Lighting SystemComponents LED or CFL Battery & Circuitry Power Source (solar, AC, dynamo) Switches, Housing, Wires, Connectors, etc.
  • 9.
    Residential Off-Grid SolarPV System (basic 12 volt DC configuration) Drawing my Mike Okendo for Energy for Sustainable Development Africa, Nairobi, Kenya
  • 10.
    Residential Off-Grid SolarPV System (AC/DC system configuration) Source: SEI PV Design Manual, p. 102
  • 11.
    Steps for PVSystem Design • Load evaluation (total energy req’d for loads, peak loads, AC vs. DC, choosing a system voltage,) • Solar resource (number and size of PV modules) • Auxiliary Power (generator, wind, hydro, others) • Sizing storage (# and type of batteries) • Charge control strategy • Siting Issues (solar access, distances) • Wiring sizing (also disconnects & over-current protection)
  • 12.
    Load Evaluation Equations •Basic Equations for DC Systems: • Power = Current * Voltage (P = I*V, W) • Energy = Power * Time (E = P*∆t, Whr) • Amp-hour consumption = Current * Time (Ahr) • AC power a bit more complicated • Power factor must be considered for some appliances & inverter combinations
  • 13.
    Load Evaluation • Identifyloads and power requirements • average daily loads and peak loads • Determine load usage profile over time • often this is a very crude process • Hard to estimate actual usage patterns • Especially true when system does not yet exist • sometimes iterative approach is req’d • Get initial load profile, design system, see how much it costs, then adjust design
  • 14.
    Estimating Power Useby Appliances • Appliance power consumption data sources (in order of preference) • 1) measure power use for appliance • 2) manufacturer’s data on power use • (often over-estimates power use) • 3) “typical” data for appliance type http://www.codinghorror.com/blog/archives/000353.html
  • 15.
    Critical Issues forLoad Evaluation • AC vs. DC power to end use • AC allows for use of more electrical devices, but requires purchase of an inverter • inverter con’s = cost + efficiency (70% - 95%) • DC common for small systems, AC for large
  • 16.
    Critical Issues forLoad Evaluation (cont) • System voltage (12V, 24V, 48V, etc.) • AC systems allow for high DC voltage (reduced wire loss) • DC systems often have 12 VDC (appliance availability) • Choosing appliances: efficiency usually worth the extra cost for PV applications
  • 17.
    Load Analysis Worksheet Electric LoadAC DC hrs/day days/wk days AC DC Light Light TV Radio Fridge Hrs Watt 7 Use * Use * Watts Amps * Volts Qty     Total Daily Load: Maximum AC Load (Watts) Maximum DC Load (Watts)
  • 18.
    Special Topics forLoad Evaluation • Cycling loads • i.e. appliances that automatically turn themselves on and off (e.g. refrigerator) • “Phantom” loads • loads that draw power even when they are “off” • Estimating surge requirements • some appliances require considerably more power when starting than during continuous operation • e.g. motor loads often require 3-5 times their continuous operating power for a brief time when starting
  • 19.
  • 20.
    Solar Resource Evaluation •What is the solar resource at the site? • annual average daily; monthly average daily • choosing orientation and tilt for PV array • impact of shading • How does resource match demand? • seasonal distribution of loads? “Full Sun Hours” from Solar radiation data 0 200 400 600 800 1000 1200 6:00:00 9:00:00 12:00:00 15:00:00 18:00:00 Solar Radiation (W/m 2 ) Time of Day 6.8 kWh/m 2 /day
  • 21.
  • 22.
    What do youget out of a PV module? • PV module output is affected by insolation and module temperature • IV curve is best indicator of module performance IV Curve for 20 Wp PV module Standard Conditions: 1000 W/m2 25°C AM = 1.5 0 0.2 0.4 0.6 0.8 1 1.2 1.4 0 5 10 15 20 25 Current (amperes) Voltage (volts) Maximum Power Point
  • 23.
    Photovoltaic IV CurveBasics 0 0.4 0.8 1.2 1.6 0 5 10 15 20 0 5 10 15 20 25 IV Curve Power Voltage Curve Current (amperes) Power (watts) Voltage (volts) Maximum Power Point Range of Battery Voltages
  • 24.
    PV Array SizingCalculations Avg. Load  Battery  Peak Sun = Array Peak Ahr/Day Efficiency Hrs/Day Amps   = Array  Peak = Modules Module Short Peak Amps Amps/Module in Parallel Circuit Current  = DC System  Nominal = Modules in X Modules in = Total Voltage Module Voltage Series Parallel Modules  = X = PV Panel Specification: Make: Model:
  • 25.
    Photovoltaic Module SelectionIssues • Module watt rating • Efficiency • high efficiency important when space is limited • IV curve performance • Environment • temperature (special modules for extreme temps.) • specific environmental conditions (e.g marine env.) • Reputation and Warranty • Cost
  • 26.
    Auxiliary Power • Includingadditional power sources can increase system reliability and may reduce life cycle cost • But it increases system complexity • Battery capacity often smaller with backup power • Common additional power sources: • Generator (gas, diesel, propane) • Available whenever fuel is provided • Wind turbine, hydro-electric turbine • Availability depends on wind and hydro resources • Electrical grid • Grid intertie system
  • 27.
    http://www.solcomhouse.com/images/diagram_solar_power.gif Common Off-Grid PV SystemComponents Storing energy for use when the solar input is less than energy use.
  • 28.
    Battery Storage forPV Systems • Batteries provide storage for PV and other RE systems • Batteries store day time energy for night use • Systems often have storage capacity for 2 to 10 cloudy days • Batteries cannot store energy for more than a few weeks due to “self-discharge” effect
  • 29.
  • 30.
    Small Batteries forOff-Grid Lighting Systems Sealed Lead Acid Nickel Metal Hydride (NiMH) Nickel Cadmium (NiCd) Lithium Ion
  • 31.
    Battery Types • LeadAcid (Pb-acid) Battery • Flooded cells (a.k.a. open wet cells) • Starting and lighting battery (SLI) • Deep cycle battery (many types) • Sealed wet cells • Gel cells • Nickel Cadmium (NiCd) • Nickel Iron (NiFe) • “New” battery technologies {nickel metal hydride (NiMH), lithium ion (Li-Ion), lithium iron phosphate (LiFePO4), and others}
  • 32.
    Battery Experience Curves SchmidtO., Hawkes A. & Staffell I. “The future cost of electrical energy storage based on experience rates” Nature July 2017.
  • 33.
    Battery Cost TrendRange and Projections Björn Nykvist & Måns Nilsson, Nature Climate Change 5, 329–332 (2015) doi:10.1038/nclimate2564
  • 34.
    Inside a LeadAcid Battery Images Developed by Kevin R. Sullivan of Skyline College in San Bruno, CA see http://www.autoshop101.com/trainmodules/batteries/101.html
  • 35.
    Pb-Acid Battery Chemistry Charging Pb + PbO2 + 2H2SO4 <=> 2PbSO4 + 2H2O Discharging  Anode (-): Pb (pure lead) Cathode (+): PbO2 (lead oxide) Electrolyte: sulfuric acid/water solution • Specific gravity of electrolyte changes with state of charge (ratio of water and sulfuric acid changes)
  • 36.
    Battery Vocabulary • BatteryCapacity • Ahr of storage @ C-xx (or @ 0.xC) • Whr of storage • Days of autonomy = # days batteries can meet load without being charged • Rate of discharge or charge • C-xx charge rate = Current at which the battery will be completely discharged in “xx” hours • e.g. for 50 Ahr battery, C-10 is 5 amps • Alternatively, 0.1C is 5 amps
  • 37.
    More Battery Vocabulary •State of Charge (SOC) • % of battery capacity (in Ahr) remaining • Depth of Discharge (DOD) • % of battery capacity (in Ahr) removed e.g. 40% SOC = 60% DOD • Usable Storage Capacity = Ahr Capacity * Max recommended DOD • Cycle life = # of discharge - charge cycles a battery can provide before its useful life is over
  • 38.
    Good Practices forPb-Acid Battery Use • Respect limits of each battery type • Avoid deep discharges • “deep” is different for different technologies • deep discharges cause “sulfation” of lead plates • Charge battery to full regularly • Use moderate charge rates (C-5 is max) • Equalize batteries every few months • overcharging helps remove sulfate from plates • Electrolysis during overcharging stirs up electrolyte
  • 39.
    Impact of DODon Cycle Life (data for gel cell type Pb-acid battery)
  • 40.
    Impact of HighVoltage Set Point and Depth of Discharge on Cycle Life
  • 41.
    Pb-Acid Battery Capacityand Temperature • Lower temperatures decrease capacity • Higher temperatures increase capacity, but reduce cycle life
  • 42.
    Comparison of CommonBattery Technologies Pb-Acid wet cell deep cyc Pb-Acid sealed shallow cyc Pb-Acid Gel Cell NiCd wet cell rec. DOD 40-80% 15-25% 15-25% 100% Self- discharge (per mo.) 5% 1-4% 2-3% 3-6% Typ. Cap. (Ahr/ft3 ) 1000 700 250 500 Range (Ahr/ft3 ) 200- 1425 160- 1400 100- 460 100- 1000 Typ. Cap. (Ahr/lb) 5.5 4.6 2.2 5.0
  • 43.
    Comparison of SmallBattery Types Source: Lighting Global Technical Note No. 10 “Lithium-ion Battery Overview” (May, 2012), http://www.lightingafrica.org/resources/technical-notes.html
  • 44.
    Battery Selection Issues •Battery storage capacity • Maximum charge and discharge currents • avoid currents that exceed the C-5 rate • Match battery voltage to system voltage • Pb-Acid batteries come in 2 V, 6 V, and 12 V configurations • Add batteries in series to increase voltage • Add batteries in parallel to increase storage capacity
  • 45.
    Battery Selection Issues(cont) • Cycle depth characteristics • shallow vs. deep cycle, etc. • Maintenance requirements • e.g. low maintenance battery good for remote apps • Environment and Special use requirements • e.g. temperature performance varies by battery type • e.g. sealed batteries do not have to be installed upright • Cost
  • 46.
    Battery Sizing Calculations ACAverage  Inverter + DC Average  DC System = Average Amp- Daily Load efficiency Daily Load voltage hours/Day [(  ) + ]  = Average X Days of  Discharge  Battery Ahr = Batteries in Amp-hours/day Autonomy Limit Capacity Parallel X   = DC System  Battery = Batteries X Batteries = Total Voltage Voltage in Series in Parallel Batteries  = X = Battery Specification: Make: Model:
  • 47.
    Some Battery InstallationIssues • Well ventilated enclosure • Vent H2 and O2 gases from electrolysis • Vent corrosive sulfur compounds • Keep batteries away from ignition sources • Clean, dry area with moderate temperatures • Use over-current protection (fuses, circuit breakers, and disconnect switches) • Protect against acid spills (wet cell Pb-acid) • Have water and baking soda available if spill occurs • Maintenance issues • Configure batteries for easy access

Editor's Notes

  • #2 6
  • #34 - 100mAh to 10Ah – pico PV sized batteries - 10Ah to 100Ah – SHS and larger sized batteries - From 2008 to 2012, lithium-ion battery prices decreased by 42% (Dalberg 2013) - Historical pricing is mostly based on real pricing data recorded over the last few years. Where real pricing data was not available, estimations were made. Forward pricing is not set on a financial model, but on Navigant Research’s expectations for where the industry is headed based on manufacturing scale, materials prices and demand. Prices do not take into account transportation costs. 2009 figures are modelled numbers as pricing data was not available before 2010. - Price ranges have not been adjusted for inflation. - Source: Navigant Research custom research