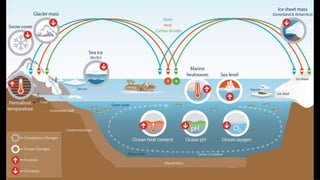
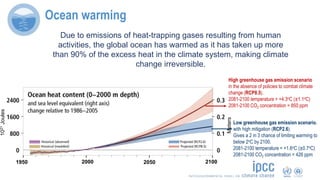
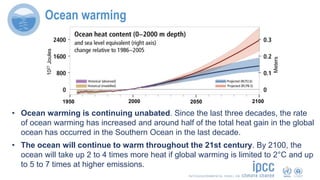
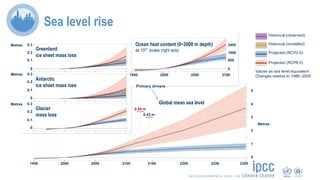
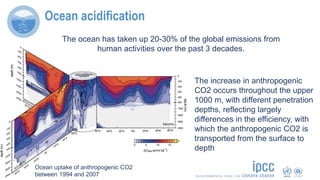
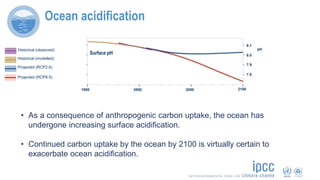
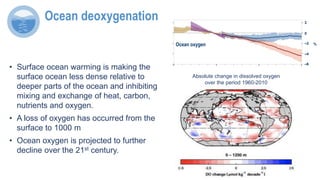
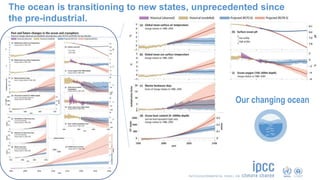
The Ocean and Cryosphere
in a Changing Climate
Oceanographic changes: Ocean warming, sea level
rise, ocean acidification and ocean deoxygenation
#SROCC
Karina von Schuckmann
Mercator Ocean International
Meters
1950 2000 2050 2100
1021Joules
Ocean warming
High greenhouse gas emission scenario
in the absence of policies to combat climate
change (RCP8.5).
2081-2100 temperature = +4.3oC (±1.1oC)
2081-2100 CO2 concentration = 850 ppm
Low greenhouse gas emission scenario,
with high mitigation (RCP2.6).
Gives a 2 in 3 chance of limiting warming to
below 2oC by 2100.
2081-2100 temperature = +1.6oC (±0.7oC)
2081-2100 CO2 concentration = 426 ppm
Due to emissions of heat-trapping gases resulting from human
activities, the global ocean has warmed as it has taken up more
than 90% of the excess heat in the climate system, making climate
change irreversible.
Meters
1950 2000 2050 2100
1021Joules
Ocean warming
• Ocean warming is continuing unabated. Since the last three decades, the rate
of ocean warming has increased and around half of the total heat gain in the global
ocean has occurred in the Southern Ocean in the last decade.
• The ocean will continue to warm throughout the 21st century. By 2100, the
ocean will take up 2 to 4 times more heat if global warming is limited to 2°C and up
to 5 to 7 times at higher emissions.
Primary drivers
Sea level rise
1950 2000 2050 2100
0.3
0.2
Antarctic
ice sheet mass loss
2150 2200 2250 2300
Greenland
ice sheet mass loss
Glacier
mass loss
0.1
0
0.3
0.2
0.1
0
0.3
0.2
0.1
0
Ocean heat content (0−2000 m depth)
as 1021 Joules (right axis)
Metres
Metres
Metres
2400
1600
800
0
1950 2000 2050 2100
0.84 m
0.43 m
Global mean sea level
Metres
5
4
3
2
1
0
Values as sea level equivalent
Changes relative to 1986–2005
Historical (observed)
Historical (modelled)
Projected (RCP2.6)
Projected (RCP8.5)
Sea level rise
• During the 20th century, the global mean sea level rose by about
15cm. Sea level is currently rising more than twice as fast.
• Sea level rise will further accelerate reaching up to 1.10 m in
2100 if emissions are not sharply reduced.
• There is no scenario that stops sea level rise this century.
We have the choice between below 1 metre and up to several
metres of sea level rise by 2300
The increase in anthropogenic
CO2 occurs throughout the upper
1000 m, with different penetration
depths, reflecting largely
differences in the efficiency, with
which the anthropogenic CO2 is
transported from the surface to
depth
Ocean uptake of anthropogenic CO2
between 1994 and 2007
Ocean acidification
The ocean has taken up 20-30% of the global emissions from
human activities over the past 3 decades.
• As a consequence of anthropogenic carbon uptake, the ocean has
undergone increasing surface acidification.
• Continued carbon uptake by the ocean by 2100 is virtually certain to
exacerbate ocean acidification.
Ocean acidification
Surface pH
1950 2000 2050 2100
8.1
8.0
7.9
pH
7.8
Historical (observed)
Historical (modelled)
Projected (RCP2.6)
Projected (RCP8.5)
Absolute change in dissolved oxygen
over the period 1960-2010
Ocean oxygen
2
0
–2
–6
%
–4
Ocean deoxygenation
• Surface ocean warming is making the
surface ocean less dense relative to
deeper parts of the ocean and inhibiting
mixing and exchange of heat, carbon,
nutrients and oxygen.
• A loss of oxygen has occurred from the
surface to 1000 m
• Ocean oxygen is projected to further
decline over the 21st century.
Our changing ocean
The ocean is transitioning to new states, unprecedented since
the pre-industrial.
SROCC

Oceanographic Changes

  • 1.
    The Ocean andCryosphere in a Changing Climate Oceanographic changes: Ocean warming, sea level rise, ocean acidification and ocean deoxygenation #SROCC Karina von Schuckmann Mercator Ocean International
  • 3.
    Meters 1950 2000 20502100 1021Joules Ocean warming High greenhouse gas emission scenario in the absence of policies to combat climate change (RCP8.5). 2081-2100 temperature = +4.3oC (±1.1oC) 2081-2100 CO2 concentration = 850 ppm Low greenhouse gas emission scenario, with high mitigation (RCP2.6). Gives a 2 in 3 chance of limiting warming to below 2oC by 2100. 2081-2100 temperature = +1.6oC (±0.7oC) 2081-2100 CO2 concentration = 426 ppm Due to emissions of heat-trapping gases resulting from human activities, the global ocean has warmed as it has taken up more than 90% of the excess heat in the climate system, making climate change irreversible.
  • 4.
    Meters 1950 2000 20502100 1021Joules Ocean warming • Ocean warming is continuing unabated. Since the last three decades, the rate of ocean warming has increased and around half of the total heat gain in the global ocean has occurred in the Southern Ocean in the last decade. • The ocean will continue to warm throughout the 21st century. By 2100, the ocean will take up 2 to 4 times more heat if global warming is limited to 2°C and up to 5 to 7 times at higher emissions.
  • 5.
    Primary drivers Sea levelrise 1950 2000 2050 2100 0.3 0.2 Antarctic ice sheet mass loss 2150 2200 2250 2300 Greenland ice sheet mass loss Glacier mass loss 0.1 0 0.3 0.2 0.1 0 0.3 0.2 0.1 0 Ocean heat content (0−2000 m depth) as 1021 Joules (right axis) Metres Metres Metres 2400 1600 800 0 1950 2000 2050 2100 0.84 m 0.43 m Global mean sea level Metres 5 4 3 2 1 0 Values as sea level equivalent Changes relative to 1986–2005 Historical (observed) Historical (modelled) Projected (RCP2.6) Projected (RCP8.5)
  • 6.
    Sea level rise •During the 20th century, the global mean sea level rose by about 15cm. Sea level is currently rising more than twice as fast. • Sea level rise will further accelerate reaching up to 1.10 m in 2100 if emissions are not sharply reduced. • There is no scenario that stops sea level rise this century. We have the choice between below 1 metre and up to several metres of sea level rise by 2300
  • 7.
    The increase inanthropogenic CO2 occurs throughout the upper 1000 m, with different penetration depths, reflecting largely differences in the efficiency, with which the anthropogenic CO2 is transported from the surface to depth Ocean uptake of anthropogenic CO2 between 1994 and 2007 Ocean acidification The ocean has taken up 20-30% of the global emissions from human activities over the past 3 decades.
  • 8.
    • As aconsequence of anthropogenic carbon uptake, the ocean has undergone increasing surface acidification. • Continued carbon uptake by the ocean by 2100 is virtually certain to exacerbate ocean acidification. Ocean acidification Surface pH 1950 2000 2050 2100 8.1 8.0 7.9 pH 7.8 Historical (observed) Historical (modelled) Projected (RCP2.6) Projected (RCP8.5)
  • 9.
    Absolute change indissolved oxygen over the period 1960-2010 Ocean oxygen 2 0 –2 –6 % –4 Ocean deoxygenation • Surface ocean warming is making the surface ocean less dense relative to deeper parts of the ocean and inhibiting mixing and exchange of heat, carbon, nutrients and oxygen. • A loss of oxygen has occurred from the surface to 1000 m • Ocean oxygen is projected to further decline over the 21st century.
  • 10.
    Our changing ocean Theocean is transitioning to new states, unprecedented since the pre-industrial.
  • 11.

Editor's Notes

  • #6 Metres SLR by 2300 due to: Thermal expansion Glacier melt Ice sheet melt
  • #7 Metres SLR by 2300 due to: Thermal expansion Glacier melt Ice sheet melt
  • #12 What we see is that human-induced climate change has a major footprint on the systems that we depend upon – from the top of the mountains to the depth of oceans. These changes will continue for generations to come.