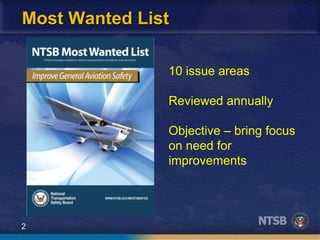
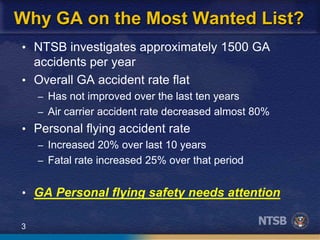
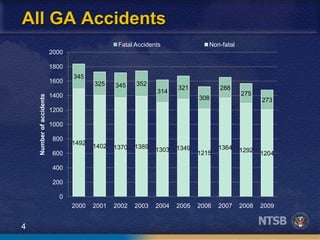
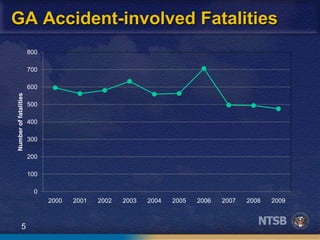
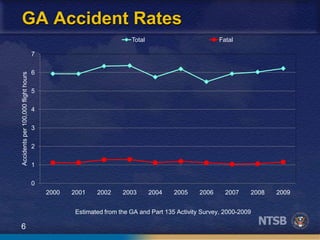
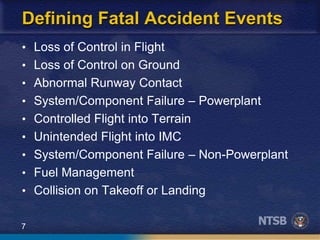
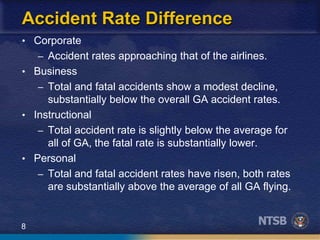
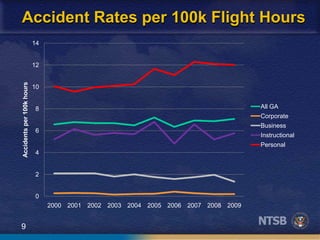
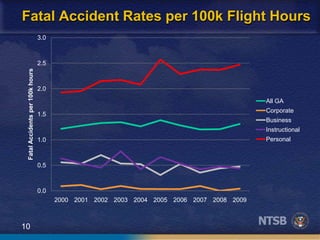
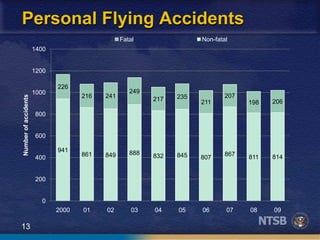
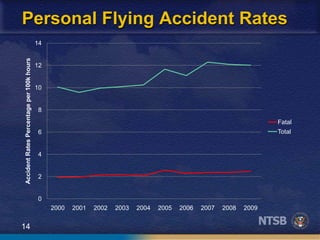
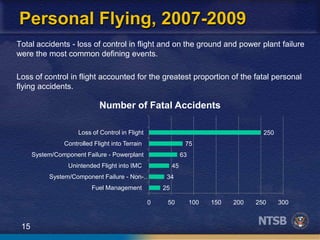
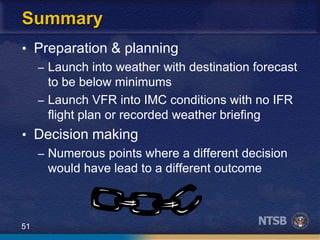
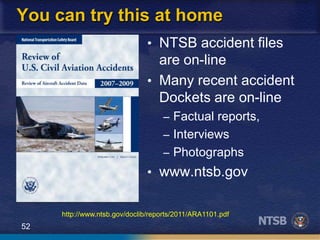
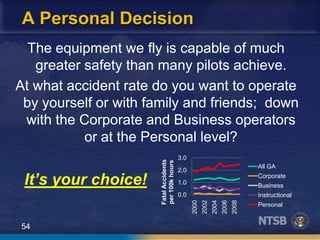
Personal Flying:
How Safe Do
You Want to Be?
Sun & Fun
Lakeland Florida
March 30, 2012
Earl F. Weener, Ph.D.
NTSB Board Member
2
Most Wanted List
10 issue areas
Reviewed annually
Objective – bring focus
on need for
improvements
3
Why GA on the Most Wanted List?
• NTSB investigates approximately 1500 GA
accidents per year
• Overall GA accident rate flat
– Has not improved over the last ten years
– Air carrier accident rate decreased almost 80%
• Personal flying accident rate
– Increased 20% over last 10 years
– Fatal rate increased 25% over that period
• GA Personal flying safety needs attention
4
All GA Accidents
1492
1402 1370 1389 1303 1349
1215
1364 1292
1204
345
325 345 352
314
321
308
288
275
273
0
200
400
600
800
1000
1200
1400
1600
1800
2000
2000 2001 2002 2003 2004 2005 2006 2007 2008 2009
Numberofaccidents Fatal Accidents Non-fatal
5
GA Accident-involved Fatalities
0
100
200
300
400
500
600
700
800
2000 2001 2002 2003 2004 2005 2006 2007 2008 2009
Numberoffatalities
6
GA Accident Rates
0
1
2
3
4
5
6
7
2000 2001 2002 2003 2004 2005 2006 2007 2008 2009
Accidentsper100,000flighthours
Total Fatal
Estimated from the GA and Part 135 Activity Survey, 2000-2009
7
Defining Fatal Accident Events
• Loss of Control in Flight
• Loss of Control on Ground
• Abnormal Runway Contact
• System/Component Failure – Powerplant
• Controlled Flight into Terrain
• Unintended Flight into IMC
• System/Component Failure – Non-Powerplant
• Fuel Management
• Collision on Takeoff or Landing
8
• Corporate
– Accident rates approaching that of the airlines.
• Business
– Total and fatal accidents show a modest decline,
substantially below the overall GA accident rates.
• Instructional
– Total accident rate is slightly below the average for
all of GA, the fatal rate is substantially lower.
• Personal
– Total and fatal accident rates have risen, both rates
are substantially above the average of all GA flying.
Accident Rate Difference
9
Accident Rates per 100k Flight Hours
0
2
4
6
8
10
12
14
2000 2001 2002 2003 2004 2005 2006 2007 2008 2009
Accidentsper100khours
All GA
Corporate
Business
Instructional
Personal
10
Fatal Accident Rates per 100k Flight Hours
0.0
0.5
1.0
1.5
2.0
2.5
3.0
2000 2001 2002 2003 2004 2005 2006 2007 2008 2009
FatalAccidentsper100khours
All GA
Corporate
Business
Instructional
Personal
11
Business Flying, 2007-2009
All accidents – Loss of control (in-flight or on the ground) accounted for the
largest portion, followed by system/component failures.
Fatal accidents - Loss of control in flight accounted for the greatest proportion,
followed by controlled flight into terrain and collisions on takeoff or landing.
0
0
1
2
4
5
12
0 2 4 6 8 10 12 14
Loss of Control on Ground
System/Component Failure - Non-Powerplant
Fuel Management
System/Component Failure - Powerplant
Collision on Takeoff or Landing
Controlled Flight into Terrain
Loss of Control in Flight
Number of Fatal Accidents
12
25
25
78
88
116
122
0 20 40 60 80 100 120 140
Collision on Takeoff or Landing
System/Component Failure - Non-Powerplant
System/Component Failure - Powerplant
Loss of Control in Flight
Abnormal Runway Contact
Loss of Control on Ground
Number of Fatal Accidents
Loss of control on the ground or in flight and abnormal runway contact (e.g.,
hard landings) accounted for the great majority of defining accident events
for instructional flying accidents in both fixed-wing airplanes and helicopters.
Instructional Flying, 2007-2009
13
Personal Flying Accidents
941
861 849 888 832 845 807
867 811 814
226
216 241
249
217 235
211
207
198 206
0
200
400
600
800
1000
1200
1400
2000 01 02 03 04 05 06 07 08 09
Numberofaccidents
Fatal Non-fatal
14
Personal Flying Accident Rates
0
2
4
6
8
10
12
14
2000 2001 2002 2003 2004 2005 2006 2007 2008 2009
AccidentRatesPercentageper100khours
Fatal
Total
15
Personal Flying, 2007-2009
25
34
45
63
75
250
0 50 100 150 200 250 300
Fuel Management
System/Component Failure - Non-…
Unintended Flight into IMC
System/Component Failure - Powerplant
Controlled Flight into Terrain
Loss of Control in Flight
Number of Fatal Accidents
Total accidents - loss of control in flight and on the ground and power plant failure
were the most common defining events.
Loss of control in flight accounted for the greatest proportion of the fatal personal
flying accidents.
16
Alfred Sheinwold
“Learn all you can from the mistakes
of others. You won’t have time to
make them all yourself”
17
Accident Chain-of-Events
• An accident is typically
the end of a sequence
of events
• Interruption of this
chain-of-events could
eliminate the accident
• Look for opportunities
to break the chain
18
Loss of Control in Flight
19
Loss of Control In-flight
• Accident #LAX08FA300
• Beechcraft A36
• Approach to KCRQ, Carlsbad CA airport,
331 ft msl
• One person onboard, fatal
• Weather – 100 ft ceiling, ¼ mi visibility,
wind 280 degrees at 5 kt
• ILS 24 minimums 200 ft ceiling, ¾ mi
visibility
20
Loss of Control In-flight
• Pilot
– Private certificate
– Instrument rating 2 months prior
– Nine hundred hours total time
– No instrument training in accident aircraft
• Aircraft
– No apparent malfunctions
– Adequate fuel
21
Loss of Control In-flight
• Accident sequence
– ATC cleared for ILS approach RW 24
– Tower issued “low altitude alert” and
advised pilot he was south of localizer
– Two minutes later pilot stated he was
“aborting” the approach
– One minute later pilot stated “I’m in trouble”
22
Loss of Control In-flight
• Radar tracks
– Two miles from approach end RW24
airplane crossed LOC at 800 ft heading
south
– Track started tight left-hand turns
– Altitude fluctuated between 600 and 1100 ft
msl
– Last radar return showed airplane at 900 ft
msl and 56 kt ground speed
• Wreckage confined to initial impact area
23
Loss of Control In-flight
Probable Cause
The pilot’s failure to maintain control
during the instrument approach and
attempted go-around
24
Controlled Flight into Terrain
25
Controlled Flight into Terrain
• Accident NYC08FA138
• Cirrus SR22
• Night IFR Departure Front Royal
Virginia, KFRR, 709 ft msl
• Two fatalities – pilot & son
• Weather – Winchester, KOKV, 15 mi S
– Wind 340 deg at 4 kt
– 3 mi visibility in rain
– Broken 2,400 ft, overcast 3,000 ft
26
Controlled Flight into Terrain
• Pilot
– Private Certificate, Instrument rating
– Estimated total time – 193 hours
• Aircraft
– Airplane total time less than 300 hrs
– No apparent malfunctions
– Flight data extracted from PFD system
27
Controlled Flight into Terrain
• Accident sequence
– IFR clearance – direct COGAN intersection,
climb and maintain 4,000, expect 5,000 10
minutes after departure
– Prior to takeoff, Desired Course set to 050
deg, approximate direct course to COGAN
– Airplane departed RW27
– GPS waypoint COGAN selected during
takeoff roll
– Aircraft path continued west, consistent with
GPSS not selected
28
Controlled Flight into Terrain
• Flight path
– Total time of flight 80 seconds
– First 40 sec, runway heading, climbing 900
to 1,000 fpm
– 25 sec, vertical speed decreased to 0 fpm,
– then up 2200 fpm,
– then decreased to 700 – 750 fpm up
– Airplane reached 2,200 ft msl and 140 kt ias
– Last 6 sec, steep descending turn to left, roll
to 95 deg and pitch to 27 deg down
29
Controlled Flight into Terrain
Probable Cause
The pilot’s failure to maintain
clearance from rising mountainous
terrain, and his failure to turn toward
his assigned course during initial
climb. Contributing to the accident
were the low ceiling, reduced
visibility, dark night conditions and
rising mountainous terrain
30
System Failure – Powerplant
31
System Failure - Powerplant
• Accident ERA09FA093
• Beechcraft 36
• Night IFR approach, Bowman Field,
KLOU, Louisville, KY
• One fatality – pilot
• Weather
– Winds 330 degrees at 3 kts
– Ceiling overcast at 800 ft
– Visibility 6 miles in mist
32
System Failure - Powerplant
• Pilot
– Commercial Certificate, SEL/MEL
– Flight Instructor rating, SEL
– Instrument rating
– Approximately 2300 hrs total flight time
• Airplane
– Total airframe time – 6274 hours
– Engine IO 520, 58 hours since overhaul
– Pilot observed oil pressure problem
– Mechanic advised to have problem checked
33
System Failure - Powerplant
• Accident sequence
– Prior to night departure from MDW, pilot
noted problem with airplane
– Maintenance not available until morning
– After several attempts, pilot managed to get
engine started and departed for KLOU at
about 0220
– Nine miles out on RNAV approach to KLOU
pilot declared “Emergency” due to engine
failure
34
System Failure - Powerplant
• Aircraft right wing struck tree at height of
about 30 ft along side a golf course
• Aircraft came to rest inverted
approximately 175 ft from tree
• Front section of cabin roof crushed in
• Fuel recovered from left tank, right tank
separated from aircraft
• Initial examination revealed engine
would not rotate
35
System Failure - Powerplant
• Engine teardown
– Crankshaft and counterweight assembly
fractured through at forward fillet radius of
#2 main bearing journal
– #2 main bearing journal showed scoring
consistent with bearing rotation
– #3 main bearing journal fractured at rear
fillet area
36
System Failure - Powerplant
• NTSB Materials Lab found presence of silk
thread patterns and gasket making material on
sealing surfaces of the main bearing bosses
• Material not part of engine manufacturer
maintenance documentation, TCM SIL 99-2B
• #2 main bearing boss severely damaged on
both halves, including rotation mechanical
gouging and deformation of the boss area
behind the bearing, including mushrooming
deformation of the boss
37
System Failure - Powerplant
Probable Cause
The pilot’s continued operation of
the aircraft with known deficiencies.
Contributing to the accident was the
improper sealing of the engine case
during overhaul
38
Unintended Flight into IMC
39
Unintended Flight into IMC
• Accident DEN08FA141
• Cessna 182T
• Four fatalities – pilot and 3 passengers
• VFR flight from Steamboat Springs
Colorado to Brenham Texas
• No record of weather briefing or flight plan
• Impacted terrain on Mt Guyot, near
Georgia Pass, Park County, Colorado
• Weather – IMC in general area
40
Unintended Flight into IMC
• Pilot
– Private Certificate, SEL & MEL
– Instrument rating
– Total flight time – 1576 hours
– Instrument time – 154 actual, 40 simulated
• Airplane
– Garmin 1000 with XM weather & stormscope
– 1492 hours total time
– No evidence of pre-impact anomalies in
engine or airplane systems
41
Unintended Flight into IMC
• Accident flight – NTSB meteorology analysis
– At departure marginal VMC with overcast above
and scattered clouds at and below flight level
– Weather at accident site deteriorated rapidly
after departure
– Pilot likely encountered level 2 thunderstorm
– Lost control and impacted terrain
• Approximately 55 degrees nose down
• Wings level
– Wreckage located at 12,300 ft msl
42
Unintended Flight into Terrain
Probable Cause
The pilot’s failure to maintain aircraft
control after inadvertently
encountering instrument
meteorological conditions.
Contributing to the accident were
the pilot’s failure to obtain a weather
brief and the severe weather
conditions.
43
Fuel Management
44
Fuel Management
• Accident ERA09FA289
• Beechcraft A36
• Pilot & fwd passenger – fatal; two aft
passengers received minor injuries
• IFR flight plan; VMC conditions
• Flight from Destin, FL to Newnan GA
• Accident location was Beauregard, AL
• Weather – scattered at 3,900 ft, 10 mile
visibility, winds 120 degree at 5 kts
45
Fuel Management
• Pilot
– Private Certificate, SEL
– Instrument rating
– Total flight time – 1,618 hours
– Instrument time – 110 actual, 26 simulated
• Airplane
– Recently turbonormalized engine
– Osborne Tip tanks (approx 10 gal per tank)
– 752 hours total time
– No evidence of pre-impact anomalies
46
Fuel Management
• Accident sequence
– Second leg of trip
– Picked up 3 passengers at intermediate
airport
– In cruise at 7,000 ft, engine lost power
– Restarted, but subsequently lost power again
– Forced landing approach to pasture
– Collided with trees and large rolled bale of
hay
47
Fuel Management
• Post accident investigation
– Fuel selector to right tank – 1 qt fuel present
– Right tip tank breached but contained 4 ½
gal
– Left fuel tank separated from airplane
– Left tip tank breached but contained ½ gal
– Before trip
• 74 gal usable in main tanks
• 20 gal usable in combined tip tanks
• 25.4 gal drained to make weight & CG
48
Fuel Management
• At takeoff for 2nd flight leg, about 48.6 gal
in mains and 20 gal in tip tanks
• Performance calculations indicated that
more than 48.6 gal would have been
used by point of initial loss of power
• Likely used all main fuel but not tip fuel
49
Fuel Management
Probable Cause
The pilot’s improper fuel
management, which resulted in a
total loss of engine power due to
fuel starvation.
50
Summary
• Pilot proficiency
– Launch into hard IMC with new instrument
rating and no instrument instruction in
airplane
– System operational confusion on IFR
departure
– Fuel system mismanagement leading to
forced landing
• Airworthiness
– Takeoff night IFR with known deficiency
51
Summary
• Preparation & planning
– Launch into weather with destination forecast
to be below minimums
– Launch VFR into IMC conditions with no IFR
flight plan or recorded weather briefing
• Decision making
– Numerous points where a different decision
would have lead to a different outcome
52
You can try this at home
• NTSB accident files
are on-line
• Many recent accident
Dockets are on-line
– Factual reports,
– Interviews
– Photographs
• www.ntsb.gov
http://www.ntsb.gov/doclib/reports/2011/ARA1101.pdf
53
Douglas Adams
“Human beings, who are almost
unique in having ability to learn from
the experience of others, are also
remarkable for their apparent
disinclination to do so.”
54
A Personal Decision
The equipment we fly is capable of much
greater safety than many pilots achieve.
At what accident rate do you want to operate
by yourself or with family and friends; down
with the Corporate and Business operators
or at the Personal level?
It’s your choice!
0.0
1.0
2.0
3.0
2000
2002
2004
2006
2008
FatalAccidents
per100khours
All GA
Corporate
Business
Instructional
Personal
55

NTSB presents: Personal Flying

  • 1.
    Personal Flying: How SafeDo You Want to Be? Sun & Fun Lakeland Florida March 30, 2012 Earl F. Weener, Ph.D. NTSB Board Member
  • 2.
    2 Most Wanted List 10issue areas Reviewed annually Objective – bring focus on need for improvements
  • 3.
    3 Why GA onthe Most Wanted List? • NTSB investigates approximately 1500 GA accidents per year • Overall GA accident rate flat – Has not improved over the last ten years – Air carrier accident rate decreased almost 80% • Personal flying accident rate – Increased 20% over last 10 years – Fatal rate increased 25% over that period • GA Personal flying safety needs attention
  • 4.
    4 All GA Accidents 1492 14021370 1389 1303 1349 1215 1364 1292 1204 345 325 345 352 314 321 308 288 275 273 0 200 400 600 800 1000 1200 1400 1600 1800 2000 2000 2001 2002 2003 2004 2005 2006 2007 2008 2009 Numberofaccidents Fatal Accidents Non-fatal
  • 5.
    5 GA Accident-involved Fatalities 0 100 200 300 400 500 600 700 800 20002001 2002 2003 2004 2005 2006 2007 2008 2009 Numberoffatalities
  • 6.
    6 GA Accident Rates 0 1 2 3 4 5 6 7 20002001 2002 2003 2004 2005 2006 2007 2008 2009 Accidentsper100,000flighthours Total Fatal Estimated from the GA and Part 135 Activity Survey, 2000-2009
  • 7.
    7 Defining Fatal AccidentEvents • Loss of Control in Flight • Loss of Control on Ground • Abnormal Runway Contact • System/Component Failure – Powerplant • Controlled Flight into Terrain • Unintended Flight into IMC • System/Component Failure – Non-Powerplant • Fuel Management • Collision on Takeoff or Landing
  • 8.
    8 • Corporate – Accidentrates approaching that of the airlines. • Business – Total and fatal accidents show a modest decline, substantially below the overall GA accident rates. • Instructional – Total accident rate is slightly below the average for all of GA, the fatal rate is substantially lower. • Personal – Total and fatal accident rates have risen, both rates are substantially above the average of all GA flying. Accident Rate Difference
  • 9.
    9 Accident Rates per100k Flight Hours 0 2 4 6 8 10 12 14 2000 2001 2002 2003 2004 2005 2006 2007 2008 2009 Accidentsper100khours All GA Corporate Business Instructional Personal
  • 10.
    10 Fatal Accident Ratesper 100k Flight Hours 0.0 0.5 1.0 1.5 2.0 2.5 3.0 2000 2001 2002 2003 2004 2005 2006 2007 2008 2009 FatalAccidentsper100khours All GA Corporate Business Instructional Personal
  • 11.
    11 Business Flying, 2007-2009 Allaccidents – Loss of control (in-flight or on the ground) accounted for the largest portion, followed by system/component failures. Fatal accidents - Loss of control in flight accounted for the greatest proportion, followed by controlled flight into terrain and collisions on takeoff or landing. 0 0 1 2 4 5 12 0 2 4 6 8 10 12 14 Loss of Control on Ground System/Component Failure - Non-Powerplant Fuel Management System/Component Failure - Powerplant Collision on Takeoff or Landing Controlled Flight into Terrain Loss of Control in Flight Number of Fatal Accidents
  • 12.
    12 25 25 78 88 116 122 0 20 4060 80 100 120 140 Collision on Takeoff or Landing System/Component Failure - Non-Powerplant System/Component Failure - Powerplant Loss of Control in Flight Abnormal Runway Contact Loss of Control on Ground Number of Fatal Accidents Loss of control on the ground or in flight and abnormal runway contact (e.g., hard landings) accounted for the great majority of defining accident events for instructional flying accidents in both fixed-wing airplanes and helicopters. Instructional Flying, 2007-2009
  • 13.
    13 Personal Flying Accidents 941 861849 888 832 845 807 867 811 814 226 216 241 249 217 235 211 207 198 206 0 200 400 600 800 1000 1200 1400 2000 01 02 03 04 05 06 07 08 09 Numberofaccidents Fatal Non-fatal
  • 14.
    14 Personal Flying AccidentRates 0 2 4 6 8 10 12 14 2000 2001 2002 2003 2004 2005 2006 2007 2008 2009 AccidentRatesPercentageper100khours Fatal Total
  • 15.
    15 Personal Flying, 2007-2009 25 34 45 63 75 250 050 100 150 200 250 300 Fuel Management System/Component Failure - Non-… Unintended Flight into IMC System/Component Failure - Powerplant Controlled Flight into Terrain Loss of Control in Flight Number of Fatal Accidents Total accidents - loss of control in flight and on the ground and power plant failure were the most common defining events. Loss of control in flight accounted for the greatest proportion of the fatal personal flying accidents.
  • 16.
    16 Alfred Sheinwold “Learn allyou can from the mistakes of others. You won’t have time to make them all yourself”
  • 17.
    17 Accident Chain-of-Events • Anaccident is typically the end of a sequence of events • Interruption of this chain-of-events could eliminate the accident • Look for opportunities to break the chain
  • 18.
  • 19.
    19 Loss of ControlIn-flight • Accident #LAX08FA300 • Beechcraft A36 • Approach to KCRQ, Carlsbad CA airport, 331 ft msl • One person onboard, fatal • Weather – 100 ft ceiling, ¼ mi visibility, wind 280 degrees at 5 kt • ILS 24 minimums 200 ft ceiling, ¾ mi visibility
  • 20.
    20 Loss of ControlIn-flight • Pilot – Private certificate – Instrument rating 2 months prior – Nine hundred hours total time – No instrument training in accident aircraft • Aircraft – No apparent malfunctions – Adequate fuel
  • 21.
    21 Loss of ControlIn-flight • Accident sequence – ATC cleared for ILS approach RW 24 – Tower issued “low altitude alert” and advised pilot he was south of localizer – Two minutes later pilot stated he was “aborting” the approach – One minute later pilot stated “I’m in trouble”
  • 22.
    22 Loss of ControlIn-flight • Radar tracks – Two miles from approach end RW24 airplane crossed LOC at 800 ft heading south – Track started tight left-hand turns – Altitude fluctuated between 600 and 1100 ft msl – Last radar return showed airplane at 900 ft msl and 56 kt ground speed • Wreckage confined to initial impact area
  • 23.
    23 Loss of ControlIn-flight Probable Cause The pilot’s failure to maintain control during the instrument approach and attempted go-around
  • 24.
  • 25.
    25 Controlled Flight intoTerrain • Accident NYC08FA138 • Cirrus SR22 • Night IFR Departure Front Royal Virginia, KFRR, 709 ft msl • Two fatalities – pilot & son • Weather – Winchester, KOKV, 15 mi S – Wind 340 deg at 4 kt – 3 mi visibility in rain – Broken 2,400 ft, overcast 3,000 ft
  • 26.
    26 Controlled Flight intoTerrain • Pilot – Private Certificate, Instrument rating – Estimated total time – 193 hours • Aircraft – Airplane total time less than 300 hrs – No apparent malfunctions – Flight data extracted from PFD system
  • 27.
    27 Controlled Flight intoTerrain • Accident sequence – IFR clearance – direct COGAN intersection, climb and maintain 4,000, expect 5,000 10 minutes after departure – Prior to takeoff, Desired Course set to 050 deg, approximate direct course to COGAN – Airplane departed RW27 – GPS waypoint COGAN selected during takeoff roll – Aircraft path continued west, consistent with GPSS not selected
  • 28.
    28 Controlled Flight intoTerrain • Flight path – Total time of flight 80 seconds – First 40 sec, runway heading, climbing 900 to 1,000 fpm – 25 sec, vertical speed decreased to 0 fpm, – then up 2200 fpm, – then decreased to 700 – 750 fpm up – Airplane reached 2,200 ft msl and 140 kt ias – Last 6 sec, steep descending turn to left, roll to 95 deg and pitch to 27 deg down
  • 29.
    29 Controlled Flight intoTerrain Probable Cause The pilot’s failure to maintain clearance from rising mountainous terrain, and his failure to turn toward his assigned course during initial climb. Contributing to the accident were the low ceiling, reduced visibility, dark night conditions and rising mountainous terrain
  • 30.
  • 31.
    31 System Failure -Powerplant • Accident ERA09FA093 • Beechcraft 36 • Night IFR approach, Bowman Field, KLOU, Louisville, KY • One fatality – pilot • Weather – Winds 330 degrees at 3 kts – Ceiling overcast at 800 ft – Visibility 6 miles in mist
  • 32.
    32 System Failure -Powerplant • Pilot – Commercial Certificate, SEL/MEL – Flight Instructor rating, SEL – Instrument rating – Approximately 2300 hrs total flight time • Airplane – Total airframe time – 6274 hours – Engine IO 520, 58 hours since overhaul – Pilot observed oil pressure problem – Mechanic advised to have problem checked
  • 33.
    33 System Failure -Powerplant • Accident sequence – Prior to night departure from MDW, pilot noted problem with airplane – Maintenance not available until morning – After several attempts, pilot managed to get engine started and departed for KLOU at about 0220 – Nine miles out on RNAV approach to KLOU pilot declared “Emergency” due to engine failure
  • 34.
    34 System Failure -Powerplant • Aircraft right wing struck tree at height of about 30 ft along side a golf course • Aircraft came to rest inverted approximately 175 ft from tree • Front section of cabin roof crushed in • Fuel recovered from left tank, right tank separated from aircraft • Initial examination revealed engine would not rotate
  • 35.
    35 System Failure -Powerplant • Engine teardown – Crankshaft and counterweight assembly fractured through at forward fillet radius of #2 main bearing journal – #2 main bearing journal showed scoring consistent with bearing rotation – #3 main bearing journal fractured at rear fillet area
  • 36.
    36 System Failure -Powerplant • NTSB Materials Lab found presence of silk thread patterns and gasket making material on sealing surfaces of the main bearing bosses • Material not part of engine manufacturer maintenance documentation, TCM SIL 99-2B • #2 main bearing boss severely damaged on both halves, including rotation mechanical gouging and deformation of the boss area behind the bearing, including mushrooming deformation of the boss
  • 37.
    37 System Failure -Powerplant Probable Cause The pilot’s continued operation of the aircraft with known deficiencies. Contributing to the accident was the improper sealing of the engine case during overhaul
  • 38.
  • 39.
    39 Unintended Flight intoIMC • Accident DEN08FA141 • Cessna 182T • Four fatalities – pilot and 3 passengers • VFR flight from Steamboat Springs Colorado to Brenham Texas • No record of weather briefing or flight plan • Impacted terrain on Mt Guyot, near Georgia Pass, Park County, Colorado • Weather – IMC in general area
  • 40.
    40 Unintended Flight intoIMC • Pilot – Private Certificate, SEL & MEL – Instrument rating – Total flight time – 1576 hours – Instrument time – 154 actual, 40 simulated • Airplane – Garmin 1000 with XM weather & stormscope – 1492 hours total time – No evidence of pre-impact anomalies in engine or airplane systems
  • 41.
    41 Unintended Flight intoIMC • Accident flight – NTSB meteorology analysis – At departure marginal VMC with overcast above and scattered clouds at and below flight level – Weather at accident site deteriorated rapidly after departure – Pilot likely encountered level 2 thunderstorm – Lost control and impacted terrain • Approximately 55 degrees nose down • Wings level – Wreckage located at 12,300 ft msl
  • 42.
    42 Unintended Flight intoTerrain Probable Cause The pilot’s failure to maintain aircraft control after inadvertently encountering instrument meteorological conditions. Contributing to the accident were the pilot’s failure to obtain a weather brief and the severe weather conditions.
  • 43.
  • 44.
    44 Fuel Management • AccidentERA09FA289 • Beechcraft A36 • Pilot & fwd passenger – fatal; two aft passengers received minor injuries • IFR flight plan; VMC conditions • Flight from Destin, FL to Newnan GA • Accident location was Beauregard, AL • Weather – scattered at 3,900 ft, 10 mile visibility, winds 120 degree at 5 kts
  • 45.
    45 Fuel Management • Pilot –Private Certificate, SEL – Instrument rating – Total flight time – 1,618 hours – Instrument time – 110 actual, 26 simulated • Airplane – Recently turbonormalized engine – Osborne Tip tanks (approx 10 gal per tank) – 752 hours total time – No evidence of pre-impact anomalies
  • 46.
    46 Fuel Management • Accidentsequence – Second leg of trip – Picked up 3 passengers at intermediate airport – In cruise at 7,000 ft, engine lost power – Restarted, but subsequently lost power again – Forced landing approach to pasture – Collided with trees and large rolled bale of hay
  • 47.
    47 Fuel Management • Postaccident investigation – Fuel selector to right tank – 1 qt fuel present – Right tip tank breached but contained 4 ½ gal – Left fuel tank separated from airplane – Left tip tank breached but contained ½ gal – Before trip • 74 gal usable in main tanks • 20 gal usable in combined tip tanks • 25.4 gal drained to make weight & CG
  • 48.
    48 Fuel Management • Attakeoff for 2nd flight leg, about 48.6 gal in mains and 20 gal in tip tanks • Performance calculations indicated that more than 48.6 gal would have been used by point of initial loss of power • Likely used all main fuel but not tip fuel
  • 49.
    49 Fuel Management Probable Cause Thepilot’s improper fuel management, which resulted in a total loss of engine power due to fuel starvation.
  • 50.
    50 Summary • Pilot proficiency –Launch into hard IMC with new instrument rating and no instrument instruction in airplane – System operational confusion on IFR departure – Fuel system mismanagement leading to forced landing • Airworthiness – Takeoff night IFR with known deficiency
  • 51.
    51 Summary • Preparation &planning – Launch into weather with destination forecast to be below minimums – Launch VFR into IMC conditions with no IFR flight plan or recorded weather briefing • Decision making – Numerous points where a different decision would have lead to a different outcome
  • 52.
    52 You can trythis at home • NTSB accident files are on-line • Many recent accident Dockets are on-line – Factual reports, – Interviews – Photographs • www.ntsb.gov http://www.ntsb.gov/doclib/reports/2011/ARA1101.pdf
  • 53.
    53 Douglas Adams “Human beings,who are almost unique in having ability to learn from the experience of others, are also remarkable for their apparent disinclination to do so.”
  • 54.
    54 A Personal Decision Theequipment we fly is capable of much greater safety than many pilots achieve. At what accident rate do you want to operate by yourself or with family and friends; down with the Corporate and Business operators or at the Personal level? It’s your choice! 0.0 1.0 2.0 3.0 2000 2002 2004 2006 2008 FatalAccidents per100khours All GA Corporate Business Instructional Personal
  • 55.

Editor's Notes

  • #4 What is the issue? U.S. hasn’t had a fatal large commercial aviation accident since February 2009 but different in the world of GAEach year, hundreds of people -450 in 2010- are killed in GA, and thousands more are injuredHighest aviation accident rates within civil aviation: about 6 times higher than small commuter and air taxi operations and over 40 times higher than larger transport category operationsMost distressing element of these statistics is that the causes of accidents are almost always a repeat of the circumstances of previous accidents
  • #6 A declining trend in both total and fatal GA accidents is evident across the decade despite the diversity of flying that is represented by these data.
  • #7 This chart plots total and fatal GA accident rates across all segments of GA. The flatness of these curves across the decade suggests that the modestly decreasing trend in annual accident numbers was primarily due to a reduction in flying.
  • #8 These are the top defining accident events in fatal business, instructional, and personal flying accidents.
  • #12 Defining accident events for fatal business flying accidents.
  • #13 Defining accident events in fatal instructional flying accidents.
  • #16 Defining accident events in fatal personal flying accidents.