Downloaded 15 times
![NSA (Use In Maintenance) Presented by Mohd Rafie KAMARUZAMAN Final Year Student of Mechanical Engineering (BEng) Hons Cardiff University [email_address] http://mohdrafie.co.uk/nsa](https://image.slidesharecdn.com/nsa4mohdrafie-1-100202151806-phpapp02/85/NSA-Use-in-Maintenance-Oral-Presentation-1-320.jpg)
![NSA (Use In Maintenance) Presented by Mohd Rafie KAMARUZAMAN Final Year Student of Mechanical Engineering (BEng) Hons Cardiff University [email_address] http://mohdrafie.co.uk/nsa](https://image.slidesharecdn.com/nsa4mohdrafie-1-100202151806-phpapp02/75/NSA-Use-in-Maintenance-Oral-Presentation-1-2048.jpg)


![NSA (Use In Maintenance) Presented by Mohd Rafie KAMARUZAMAN Final Year Student of Mechanical Engineering (BEng) Hons Cardiff University [email_address] http://mohdrafie.co.uk/nsa](https://image.slidesharecdn.com/nsa4mohdrafie-1-100202151806-phpapp02/85/NSA-Use-in-Maintenance-Oral-Presentation-25-320.jpg)

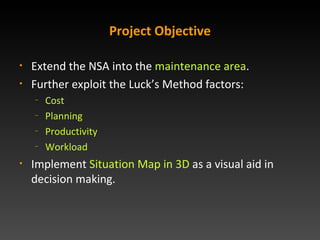
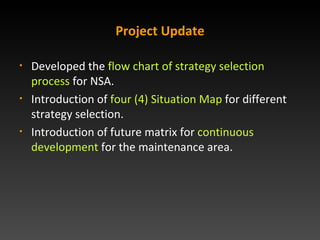
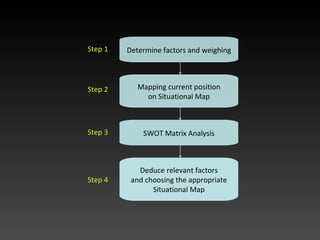
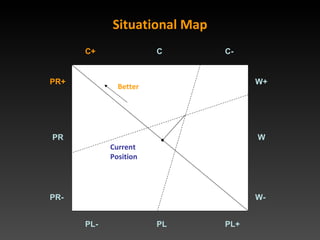
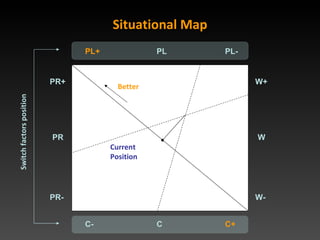
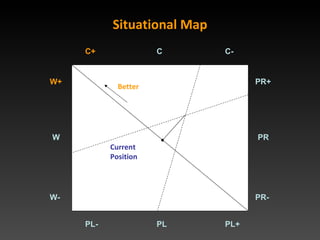
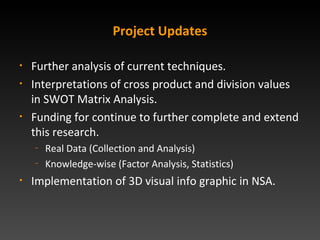
The document presents a project by Mohd Rafie Kamaruzaman on extending Numerical Situation Analysis (NSA) into maintenance areas, including the development of situational maps and the SWOT matrix analysis for strategic decision making. It updates on various methodologies including strategy selection processes, mapping factors like cost and productivity, and implementation of 2D/3D visual aids for analysis. The project aims for further research and real data collection to enhance decision-making tools in maintenance practices.