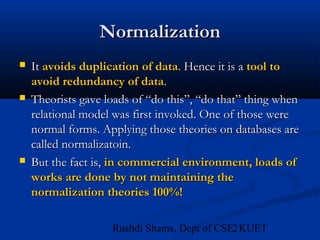
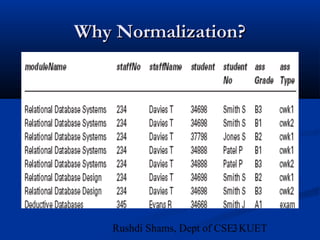
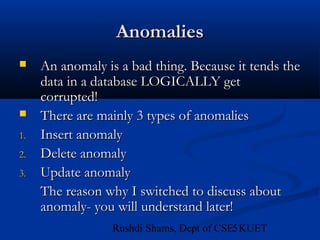
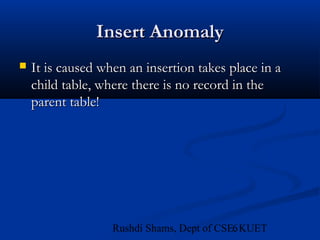
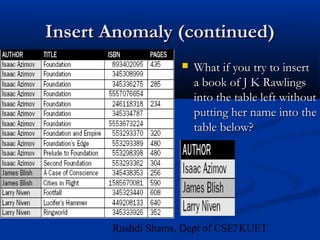
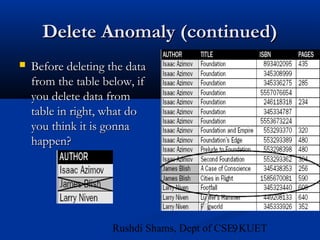
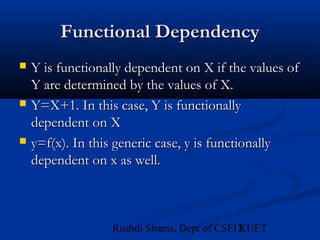
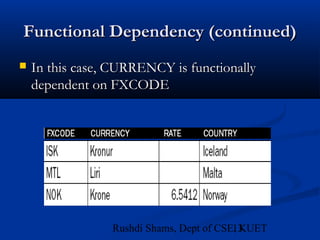
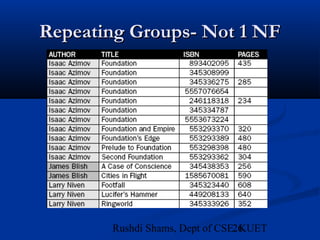
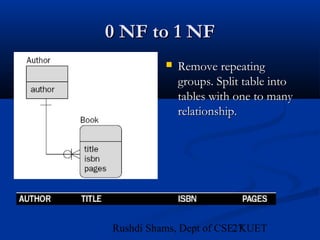
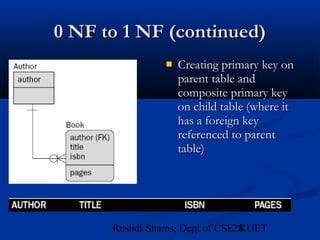
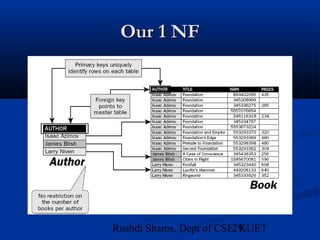
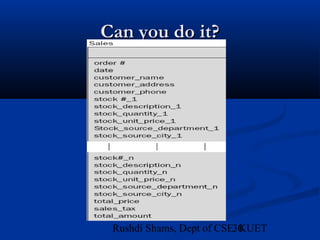
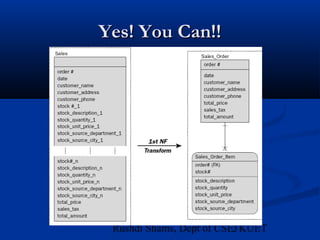
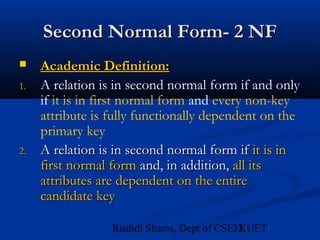
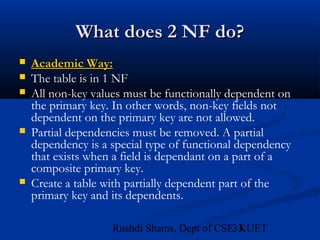
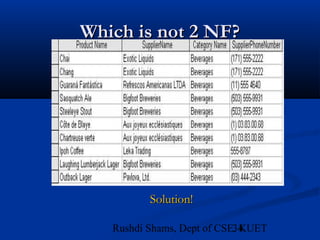
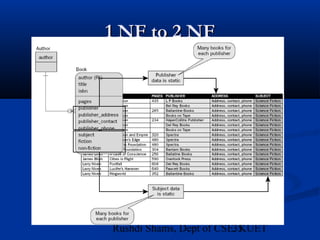
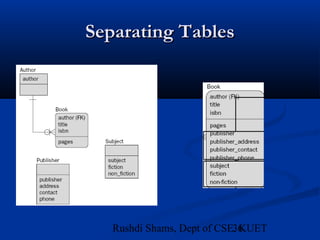
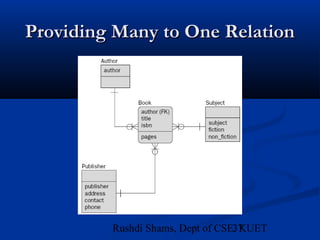
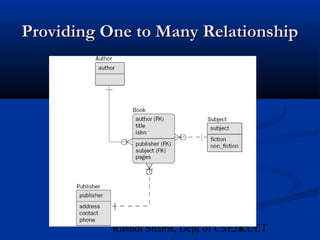
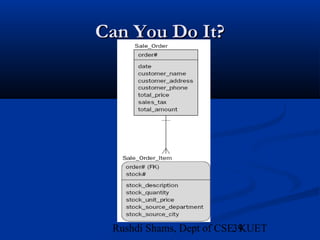
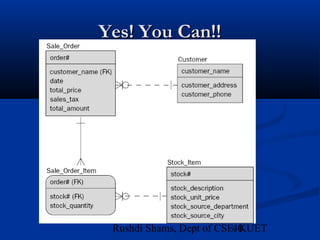
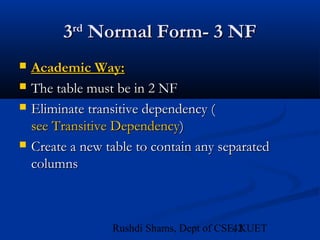
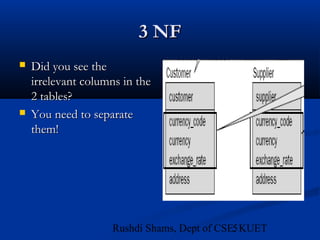
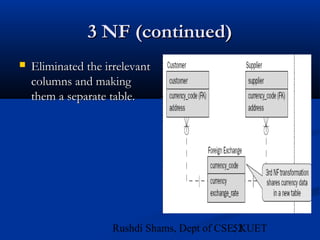
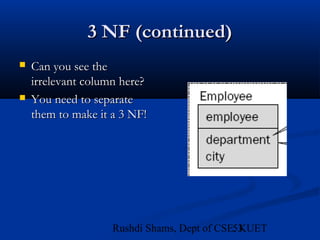
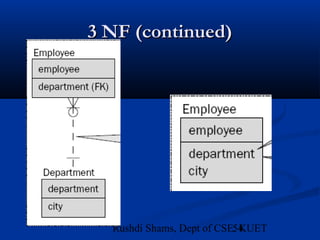
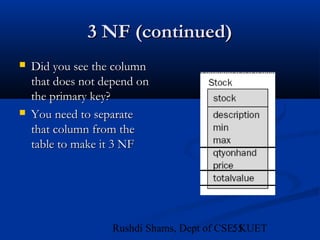
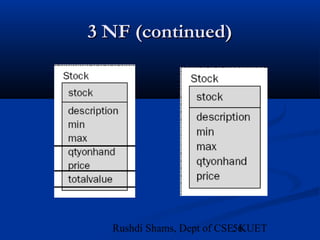
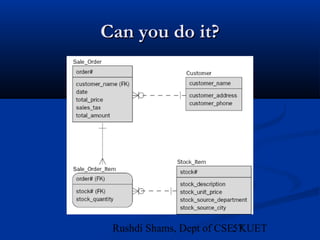
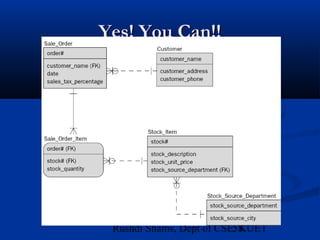
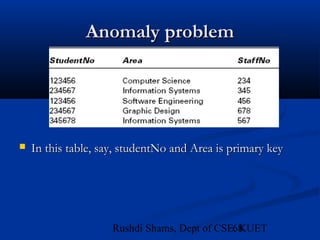
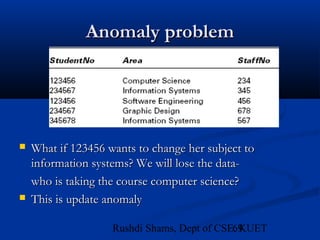
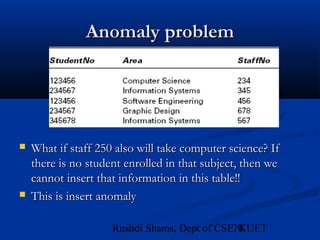
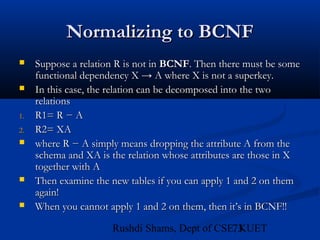
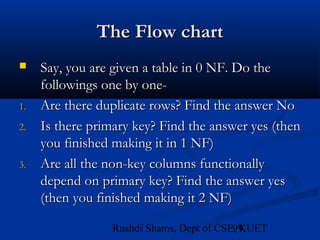
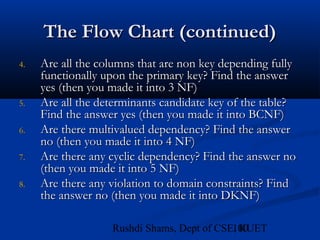
This document provides an overview of database normalization and different normal forms. It defines key terms like functional dependency, determinant, anomalies, candidate keys, and normal forms including 1NF, 2NF and 3NF. The document explains how to normalize a database by removing repeating groups and updating table structures to eliminate anomalies based on functional dependencies between attributes. Examples are provided to illustrate transitions between normal forms by separating tables to remove partial and transitive dependencies.
Methodological Mistakes and Econometric ConsequencesAsad Zaman
Logical Postivism is a mistaken understanding of science, that science is about looking for patterns in the data. This misunderstanding was adopted as the basis for data analysis, leading to a fundamentally flawed methodology for econometrics. The mistake is explained and illustrated, and remedies are suggested
Le développement du Web et des réseaux sociaux ou les numérisations massives de documents contribuent à un renouvellement des Sciences Humaines et Sociales, des études des patrimoines littéraires ou culturels, ou encore de la façon dont est exploitée la littérature scientifique en général.
Les humanités numériques, qui croisent diverses disciplines avec l’informatique, posent comme centrales les questions du volume des données, de leur diversité, de leur origine, de leur véracité ou de leur représentativité. Les informations sont véhiculées au sein de « documents » textuels (livres, pages Web, tweets...), audio, vidéo ou multimédia. Ils peuvent comporter des illustrations ou des graphiques.
Appréhender de telles ressources nécessite le développement d'approches informatiques robustes, capables de passer à l’échelle et adaptées à la nature fondamentalement ambiguë et variée des informations manipulées (langage naturel ou images à interpréter, points de vue multiples…).
Si les approches d’apprentissage statistique sont monnaie courante pour des tâches de classification ou d’extraction d’information, elles doivent faire face à des espaces vectoriels creux et de dimension très élevées (plusieurs millions), être en mesure d’exploiter des ressources (par exemple des lexiques ou des thesaurus) et tenir compte ou produire des annotations sémantiques qui devront pouvoir être réutilisées.
Pour faire face à ces enjeux, des infrastructures ont été créées telle HumaNum à l’échelle nationale, DARIAH ou CLARIN à l’échelle européenne et des recommandations établies à l’échelle mondiale telle que la TEI (Text Encoding Initiative). Des plateformes au service de l’information scientifique comme l’équipement d’excellence OpenEdition.org sont une autre brique essentielle pour la préservation et l’accès aux « Big Digital Humanities » mais aussi pour favoriser la reproductibilité et la compréhension des expérimentations et des résultats obtenus.
Score Week 5 Correlation and RegressionCorrelation and Regres.docxkenjordan97598
Score: Week 5 Correlation and RegressionCorrelation and RegressionCorrelation and Regression
<1 point> 1. Create a correlation table for the variables in our data set. (Use analysis ToolPak or StatPlus:mac LE function Correlation.)Create a correlation table for the variables in our data set. (Use analysis ToolPak or StatPlus:mac LE function Correlation.)Create a correlation table for the variables in our data set. (Use analysis ToolPak or StatPlus:mac LE function Correlation.)Create a correlation table for the variables in our data set. (Use analysis ToolPak or StatPlus:mac LE function Correlation.)Create a correlation table for the variables in our data set. (Use analysis ToolPak or StatPlus:mac LE function Correlation.)Create a correlation table for the variables in our data set. (Use analysis ToolPak or StatPlus:mac LE function Correlation.)Create a correlation table for the variables in our data set. (Use analysis ToolPak or StatPlus:mac LE function Correlation.)Create a correlation table for the variables in our data set. (Use analysis ToolPak or StatPlus:mac LE function Correlation.)Create a correlation table for the variables in our data set. (Use analysis ToolPak or StatPlus:mac LE function Correlation.)
a. Reviewing the data levels from week 1, what variables can be used in a Pearson's Correlation table (which is what Excel produces)?Reviewing the data levels from week 1, what variables can be used in a Pearson's Correlation table (which is what Excel produces)?Reviewing the data levels from week 1, what variables can be used in a Pearson's Correlation table (which is what Excel produces)?Reviewing the data levels from week 1, what variables can be used in a Pearson's Correlation table (which is what Excel produces)?Reviewing the data levels from week 1, what variables can be used in a Pearson's Correlation table (which is what Excel produces)?Reviewing the data levels from week 1, what variables can be used in a Pearson's Correlation table (which is what Excel produces)?Reviewing the data levels from week 1, what variables can be used in a Pearson's Correlation table (which is what Excel produces)?Reviewing the data levels from week 1, what variables can be used in a Pearson's Correlation table (which is what Excel produces)?Reviewing the data levels from week 1, what variables can be used in a Pearson's Correlation table (which is what Excel produces)?
b. Place table here (C8):b. Place table here (C8):b. Place table here (C8):
c. Using r = approximately .28 as the signicant r value (at p = 0.05) for a correlation between 50 values, what variables areUsing r = approximately .28 as the signicant r value (at p = 0.05) for a correlation between 50 values, what variables areUsing r = approximately .28 as the signicant r value (at p = 0.05) for a correlation between 50 values, what variables areUsing r = approximately .28 as the signicant r value (at p = 0.05) for a correlation between 50 values, what variables areUsing r = approxi.
BUS308 – Week 1 Lecture 2 Describing Data Expected Out.docxcurwenmichaela
BUS308 – Week 1 Lecture 2
Describing Data
Expected Outcomes
After reading this lecture, the student should be familiar with:
1. Basic descriptive statistics for data location
2. Basic descriptive statistics for data consistency
3. Basic descriptive statistics for data position
4. Basic approaches for describing likelihood
5. Difference between descriptive and inferential statistics
What this lecture covers
This lecture focuses on describing data and how these descriptions can be used in an
analysis. It also introduces and defines some specific descriptive statistical tools and results.
Even if we never become a data detective or do statistical tests, we will be exposed and
bombarded with statistics and statistical outcomes. We need to understand what they are telling
us and how they help uncover what the data means on the “crime,” AKA research question/issue.
How we obtain these results will be covered in lecture 1-3.
Detecting
In our favorite detective shows, starting out always seems difficult. They have a crime,
but no real clues or suspects, no idea of what happened, no “theory of the crime,” etc. Much as
we are at this point with our question on equal pay for equal work.
The process followed is remarkably similar across the different shows. First, a case or
situation presents itself. The heroes start by understanding the background of the situation and
those involved. They move on to collecting clues and following hints, some of which do not pan
out to be helpful. They then start to build relationships between and among clues and facts,
tossing out ideas that seemed good but lead to dead-ends or non-helpful insights (false leads,
etc.). Finally, a conclusion is reached and the initial question of “who done it” is solved.
Data analysis, and specifically statistical analysis, is done quite the same way as we will
see.
Descriptive Statistics
Week 1 Clues
We are interested in whether or not males and females are paid the same for doing equal
work. So, how do we go about answering this question? The “victim” in this question could be
considered the difference in pay between males and females, specifically when they are doing
equal work. An initial examination (Doc, was it murder or an accident?) involves obtaining
basic information to see if we even have cause to worry.
The first action in any analysis involves collecting the data. This generally involves
conducting a random sample from the population of employees so that we have a manageable
data set to operate from. In this case, our sample, presented in Lecture 1, gave us 25 males and
25 females spread throughout the company. A quick look at the sample by HR provided us with
assurance that the group looked representative of the company workforce we are concerned with
as a whole. Now we can confidently collect clues to see if we should be concerned or not.
As with any detective, the first issue is to understand the.
Fuzzy Querying Based on Relational DatabaseIOSR Journals
The traditional query in relational database is unable to satisfy the needs for dealing with fuzzy
linguistic values. In this paper, a new data query technique composed of fuzzy theory and MS-SQL is provided.
Here, the query can be implemented for fuzzy linguistic variables query via an interface to Microsoft ASP.NET.
It is being applied to an realistic instance i.e. questions could be expressed by fuzzy linguistic values such as
young age, high blood pressure, average heart beat etc in Patients’ relational database. This could be widely
used to realize the other fuzzy query based on database.
Using Topological Data Analysis on your BigDataAnalyticsWeek
Synopsis:
Topological Data Analysis (TDA) is a framework for data analysis and machine learning and represents a breakthrough in how to effectively use geometric and topological information to solve 'Big Data' problems. TDA provides meaningful summaries (in a technical sense to be described) and insights into complex data problems. In this talk, Anthony will begin with an overview of TDA and describe the core algorithm that is utilized. This talk will include both the theory and real world problems that have been solved using TDA. After this talk, attendees will understand how the underlying TDA algorithm works and how it improves on existing “classical” data analysis techniques as well as how it provides a framework for many machine learning algorithms and tasks.
Speaker:
Anthony Bak, Senior Data Scientist, Ayasdi
Prior to coming to Ayasdi, Anthony was at Stanford University where he did a postdoc with Ayasdi co-founder Gunnar Carlsson, working on new methods and applications of Topological Data Analysis. He completed his Ph.D. work in algebraic geometry with applications to string theory at the University of Pennsylvania and ,along the way, he worked at the Max Planck Institute in Germany, Mount Holyoke College in Germany, and the American Institute of Mathematics in California.
In this playlist
https://youtube.com/playlist?list=PLT...
I'll illustrate algorithms and data structures course, and implement the data structures using java programming language.
the playlist language is arabic.
The Topics:
--------------------
1- Arrays
2- Linear and Binary search
3- Linked List
4- Recursion
5- Algorithm analysis
6- Stack
7- Queue
8- Binary search tree
9- Selection sort
10- Insertion sort
11- Bubble sort
12- merge sort
13- Quick sort
14- Graphs
15- Hash table
16- Binary Heaps
Reference : Object-Oriented Data Structures Using Java - Third Edition by NELL DALE, DANEIEL T.JOYCE and CHIP WEIMS
Slides is owned by College of Computing & Information Technology
King Abdulaziz University, So thanks alot for these great materials
DoW #6 TVs and Life ExpectanciesFor this weeks DoW, you wi.docxkanepbyrne80830
DoW #6: TVs and Life Expectancies
For this week's DoW, you will explore the question:
Is there a relationship between life expectancy and the number of people per TV for a country?
The Excel file,
TV Life
contains data for the variables
Life Expectancy
and
People per TV
for a sample of 22 countries. We will analyze and interpret this data throughout this week’s investigations.
In Investigation 1
, you will
post your responses to Exercise B4 by Wednesday, 10PM EST
, and
follow-up by Friday, 10 PM EST
.
In Investigation 2,
you will
post your responses to Exercise E5 by Saturday 10 PM EST,
and
follow-up by Sunday, 10 PM EST.
Investigation 1: Measuring Association
In this investigation, we look at the concept of
association
– the relationship between the two variables – and ways to identify and measure the relationship in quantitative bivariate data. We will look at scatterplots and the correlation coefficient.
Inv 1, Activity A: Seeing the AssociationExercise A1
: Complete Annenberg Series for
Session 7, Parts A, B, and C.
(We will complete Part D in Investigation 2, but you can do it here if you prefer.)
Reflect on the following questions in your journal:
How does the contingency table (also called a two-way table) show the relationship seen in the scatter plot?
The height=armspan line is also called the
y=x
line (height is the
y-axis
variable, armspan is the
x-axis
variable). What does it mean if a point is above this line? below this line?
Exercise A2:
Analyze the data for DoW #6 in your calculator or on an applet. Record your answers in your journal:
What are the variables? Are they quantitative or categorical?
Create a scatterplot for the data in DoW #6, with the variable
People Per TV
on the x-axis.
Describe the relationship you see in the data (if any).
Are there any points on the scatterplot that do not seem to follow the general trend of the data? If so, what are they and why do they seem “different”?
Inv 1, Activity B: Describing Association
We use the term
association
to refer to a relationship between two variables which would reveal information about one variable from information about the other variable. In this investigation we will look at the association between two quantitative variables.
Associations can be positive or negative, and they can be strong or weak.
Two variables have a:
Positive association
If larger values of one variable tend to occur with larger values of the other variable. So, the two variables tend to increase (or decrease) together.
Negative association
If larger values of one variable tend to occur with smaller values of the other variable. So, as one variable tends to increase, the other tends to decrease.
Two variables have a:
Strong
associationI
I
f observations tend to closely follow the pattern (of positive association or of negative association). With a stronger association, one could more accurately use one variable to “predict” va.
Everything we see is distributed on some scale. Some people are tall, some short and some are neither tall nor short. Once we find out how many are tall, short or middle heighted we get to know how people are distributed when it comes to height. This distribution can also be of chances. For example, we throw, 100 times, an unbalanced dice and find out how many times 1,2,3,4,5 or 6 appeared on top. This knowledge of distribution plays an important role in empirical work.
International Journal of Engineering Research and Applications (IJERA) is an open access online peer reviewed international journal that publishes research and review articles in the fields of Computer Science, Neural Networks, Electrical Engineering, Software Engineering, Information Technology, Mechanical Engineering, Chemical Engineering, Plastic Engineering, Food Technology, Textile Engineering, Nano Technology & science, Power Electronics, Electronics & Communication Engineering, Computational mathematics, Image processing, Civil Engineering, Structural Engineering, Environmental Engineering, VLSI Testing & Low Power VLSI Design etc.
This lecture talks about parsing. Briefly gives overview on lexicon, categorization, grammar rules, syntactic tree, word senses and various challenges of natural language processing
UiPath Test Automation using UiPath Test Suite series, part 4DianaGray10
Welcome to UiPath Test Automation using UiPath Test Suite series part 4. In this session, we will cover Test Manager overview along with SAP heatmap.
The UiPath Test Manager overview with SAP heatmap webinar offers a concise yet comprehensive exploration of the role of a Test Manager within SAP environments, coupled with the utilization of heatmaps for effective testing strategies.
Participants will gain insights into the responsibilities, challenges, and best practices associated with test management in SAP projects. Additionally, the webinar delves into the significance of heatmaps as a visual aid for identifying testing priorities, areas of risk, and resource allocation within SAP landscapes. Through this session, attendees can expect to enhance their understanding of test management principles while learning practical approaches to optimize testing processes in SAP environments using heatmap visualization techniques
What will you get from this session?
1. Insights into SAP testing best practices
2. Heatmap utilization for testing
3. Optimization of testing processes
4. Demo
Topics covered:
Execution from the test manager
Orchestrator execution result
Defect reporting
SAP heatmap example with demo
Speaker:
Deepak Rai, Automation Practice Lead, Boundaryless Group and UiPath MVP
Transcript: Selling digital books in 2024: Insights from industry leaders - T...BookNet Canada
The publishing industry has been selling digital audiobooks and ebooks for over a decade and has found its groove. What’s changed? What has stayed the same? Where do we go from here? Join a group of leading sales peers from across the industry for a conversation about the lessons learned since the popularization of digital books, best practices, digital book supply chain management, and more.
Link to video recording: https://bnctechforum.ca/sessions/selling-digital-books-in-2024-insights-from-industry-leaders/
Presented by BookNet Canada on May 28, 2024, with support from the Department of Canadian Heritage.
The Art of the Pitch: WordPress Relationships and SalesLaura Byrne
Clients don’t know what they don’t know. What web solutions are right for them? How does WordPress come into the picture? How do you make sure you understand scope and timeline? What do you do if sometime changes?
All these questions and more will be explored as we talk about matching clients’ needs with what your agency offers without pulling teeth or pulling your hair out. Practical tips, and strategies for successful relationship building that leads to closing the deal.
Essentials of Automations: Optimizing FME Workflows with ParametersSafe Software
Are you looking to streamline your workflows and boost your projects’ efficiency? Do you find yourself searching for ways to add flexibility and control over your FME workflows? If so, you’re in the right place.
Join us for an insightful dive into the world of FME parameters, a critical element in optimizing workflow efficiency. This webinar marks the beginning of our three-part “Essentials of Automation” series. This first webinar is designed to equip you with the knowledge and skills to utilize parameters effectively: enhancing the flexibility, maintainability, and user control of your FME projects.
Here’s what you’ll gain:
- Essentials of FME Parameters: Understand the pivotal role of parameters, including Reader/Writer, Transformer, User, and FME Flow categories. Discover how they are the key to unlocking automation and optimization within your workflows.
- Practical Applications in FME Form: Delve into key user parameter types including choice, connections, and file URLs. Allow users to control how a workflow runs, making your workflows more reusable. Learn to import values and deliver the best user experience for your workflows while enhancing accuracy.
- Optimization Strategies in FME Flow: Explore the creation and strategic deployment of parameters in FME Flow, including the use of deployment and geometry parameters, to maximize workflow efficiency.
- Pro Tips for Success: Gain insights on parameterizing connections and leveraging new features like Conditional Visibility for clarity and simplicity.
We’ll wrap up with a glimpse into future webinars, followed by a Q&A session to address your specific questions surrounding this topic.
Don’t miss this opportunity to elevate your FME expertise and drive your projects to new heights of efficiency.
Accelerate your Kubernetes clusters with Varnish CachingThijs Feryn
A presentation about the usage and availability of Varnish on Kubernetes. This talk explores the capabilities of Varnish caching and shows how to use the Varnish Helm chart to deploy it to Kubernetes.
This presentation was delivered at K8SUG Singapore. See https://feryn.eu/presentations/accelerate-your-kubernetes-clusters-with-varnish-caching-k8sug-singapore-28-2024 for more details.
Encryption in Microsoft 365 - ExpertsLive Netherlands 2024Albert Hoitingh
In this session I delve into the encryption technology used in Microsoft 365 and Microsoft Purview. Including the concepts of Customer Key and Double Key Encryption.
Key Trends Shaping the Future of Infrastructure.pdfCheryl Hung
Keynote at DIGIT West Expo, Glasgow on 29 May 2024.
Cheryl Hung, ochery.com
Sr Director, Infrastructure Ecosystem, Arm.
The key trends across hardware, cloud and open-source; exploring how these areas are likely to mature and develop over the short and long-term, and then considering how organisations can position themselves to adapt and thrive.
FIDO Alliance Osaka Seminar: The WebAuthn API and Discoverable Credentials.pdf
Normal forms
1. Rushdi Shams, Dept of CSE, KUET 1
Database SystemsDatabase Systems
Normal FormsNormal Forms
Version 1.0Version 1.0
2. 2Rushdi Shams, Dept of CSE, KUET
NormalizationNormalization
ItIt avoids duplication of dataavoids duplication of data. Hence it is a. Hence it is a tool totool to
avoid redundancy of dataavoid redundancy of data..
Theorists gave loads of “do this”, “do that” thing whenTheorists gave loads of “do this”, “do that” thing when
relational model was first invoked. One of those wererelational model was first invoked. One of those were
normal forms. Applying those theories on databases arenormal forms. Applying those theories on databases are
called normalizatoin.called normalizatoin.
But the fact is,But the fact is, in commercial environment, loads ofin commercial environment, loads of
works are done by not maintaining theworks are done by not maintaining the
normalization theories 100%!normalization theories 100%!
4. 4Rushdi Shams, Dept of CSE, KUET
Why Normalization? (continued)Why Normalization? (continued)
What if we want to delete the student no 34668?What if we want to delete the student no 34668?
Alas! We will lose information about DEDUCTIVEAlas! We will lose information about DEDUCTIVE
DATABASE, its lecturer name and many more!DATABASE, its lecturer name and many more!
What if we want to update the lecturer to NICKWhat if we want to update the lecturer to NICK
WHITTAKER? We will have to put staff name as wellWHITTAKER? We will have to put staff name as well
as staff no for that!as staff no for that!
What if we want to insert a new student with numberWhat if we want to insert a new student with number
38989? We cannot insert any student who does not38989? We cannot insert any student who does not
have any assessment criteria!have any assessment criteria!
5. 5Rushdi Shams, Dept of CSE, KUET
AnomaliesAnomalies
An anomaly is a bad thing. Because it tends theAn anomaly is a bad thing. Because it tends the
data in a database LOGICALLY getdata in a database LOGICALLY get
corrupted!corrupted!
There are mainly 3 types of anomaliesThere are mainly 3 types of anomalies
1.1. Insert anomalyInsert anomaly
2.2. Delete anomalyDelete anomaly
3.3. Update anomalyUpdate anomaly
The reason why I switched to discuss aboutThe reason why I switched to discuss about
anomaly- you will understand later!anomaly- you will understand later!
6. 6Rushdi Shams, Dept of CSE, KUET
Insert AnomalyInsert Anomaly
It is caused when an insertion takes place in aIt is caused when an insertion takes place in a
child table, where there is no record in thechild table, where there is no record in the
parent table!parent table!
7. 7Rushdi Shams, Dept of CSE, KUET
Insert Anomaly (continued)Insert Anomaly (continued)
What if you try to insertWhat if you try to insert
a book of J K Rawlingsa book of J K Rawlings
into the table left withoutinto the table left without
putting her name into theputting her name into the
table below?table below?
8. 8Rushdi Shams, Dept of CSE, KUET
Delete AnomalyDelete Anomaly
Caused when a data in the parent table is deletedCaused when a data in the parent table is deleted
before deleting all the related data from its childbefore deleting all the related data from its child
(ren) table(s).(ren) table(s).
Well, if you prefer a cascaded deletion, no oneWell, if you prefer a cascaded deletion, no one
would mind!would mind!
9. 9Rushdi Shams, Dept of CSE, KUET
Delete Anomaly (continued)Delete Anomaly (continued)
Before deleting the dataBefore deleting the data
from the table below, iffrom the table below, if
you delete data fromyou delete data from
table in right, what dotable in right, what do
you think it is gonnayou think it is gonna
happen?happen?
10. 10Rushdi Shams, Dept of CSE, KUET
Update AnomalyUpdate Anomaly
It is kind of like delete anomaly. Both the parentIt is kind of like delete anomaly. Both the parent
table and child(ren) table(s) should get updatedtable and child(ren) table(s) should get updated
concurrently!concurrently!
11. 11Rushdi Shams, Dept of CSE, KUET
More JargonsMore Jargons
Well, before starting with normalizations, youWell, before starting with normalizations, you
must need to know some jargons. You alreadymust need to know some jargons. You already
are aware of anomalies. Let’s get into someare aware of anomalies. Let’s get into some
more!more!
12. 12Rushdi Shams, Dept of CSE, KUET
Functional DependencyFunctional Dependency
Y is functionally dependent on X if the values ofY is functionally dependent on X if the values of
Y are determined by the values of X.Y are determined by the values of X.
Y=X+1. In this case, Y is functionallyY=X+1. In this case, Y is functionally
dependent on Xdependent on X
y=f(x). In this generic case, y is functionallyy=f(x). In this generic case, y is functionally
dependent on x as well.dependent on x as well.
13. 13Rushdi Shams, Dept of CSE, KUET
Functional Dependency (continued)Functional Dependency (continued)
In this case, CURRENCY is functionallyIn this case, CURRENCY is functionally
dependent on FXCODEdependent on FXCODE
14. 14Rushdi Shams, Dept of CSE, KUET
DeterminantDeterminant
If X determines the values of Y, then X will beIf X determines the values of Y, then X will be
called the determinant of Ycalled the determinant of Y
Y=X+1. In this case, X is determinant of Y.Y=X+1. In this case, X is determinant of Y.
y=f(x). In this case, x is determinant of y as well.y=f(x). In this case, x is determinant of y as well.
15. 15Rushdi Shams, Dept of CSE, KUET
Determinant (continued)Determinant (continued)
In this case, FXCODE is determinant ofIn this case, FXCODE is determinant of
CURRENCY.CURRENCY.
16. 16Rushdi Shams, Dept of CSE, KUET
Transitive DependencyTransitive Dependency
If the value of Z is determined by Y and theIf the value of Z is determined by Y and the
value of Y is determined by X, then there is avalue of Y is determined by X, then there is a
transitive dependency between X and Z.transitive dependency between X and Z.
This dependency thus states the indirectThis dependency thus states the indirect
dependency.dependency.
BackBack
17. 17Rushdi Shams, Dept of CSE, KUET
Transitive Dependency (continued)Transitive Dependency (continued)
In this case, RATE is dependent onIn this case, RATE is dependent on
CURRENCY. CURRENCY is dependent onCURRENCY. CURRENCY is dependent on
COUNTRY. So, RATE is transitively dependentCOUNTRY. So, RATE is transitively dependent
on COUNTRY.on COUNTRY.
18. 18Rushdi Shams, Dept of CSE, KUET
Candidate keyCandidate key
It is theIt is the minimal setminimal set of super key.of super key.
Say, from this example, you only can have super keysSay, from this example, you only can have super keys
as followings (though you may have otheras followings (though you may have other
combinations, but just shorten that this time)-combinations, but just shorten that this time)-
{roll, name}, {roll, name, dept}, {roll, name, year,{roll, name}, {roll, name, dept}, {roll, name, year,
semester}semester}
In this case, the candidate key is {roll, name}!In this case, the candidate key is {roll, name}!
RollRoll NameName DeptDept YearYear SemestSemest
erer
19. 19Rushdi Shams, Dept of CSE, KUET
Full Functional DependencyFull Functional Dependency
If X determines Y but X with combination of ZIf X determines Y but X with combination of Z
does not determine Y- then, there is a fulldoes not determine Y- then, there is a full
functional dependency between X and Y.functional dependency between X and Y.
So, X cannot be a composite key.So, X cannot be a composite key.
Nb. If you make a key with 2 or more columns,Nb. If you make a key with 2 or more columns,
then that is called a composite key.then that is called a composite key.
20. 20Rushdi Shams, Dept of CSE, KUET
Full Functional DependencyFull Functional Dependency
(continued)(continued)
In this case,In this case,
POPULATION dependsPOPULATION depends
on COUNTRY not onon COUNTRY not on
the combination ofthe combination of
RATE andRATE and
COUNTRY. So,COUNTRY. So,
POPULATION is fullyPOPULATION is fully
functional dependent onfunctional dependent on
COUNTRY and also youCOUNTRY and also you
can say that,can say that,
POPULATION is notPOPULATION is not
fully functionalfully functional
dependent on RATE anddependent on RATE and
COUNTRY!COUNTRY!
21. 21Rushdi Shams, Dept of CSE, KUET
11stst
Normal Form: 1NFNormal Form: 1NF
Academic Definitions:Academic Definitions:
1. Eliminate repeating groups such that all
records in all tables can be identified uniquely
by a primary key in each table. In other words,
all fields other than the primary key must
depend on the primary key.
2. A relation is in first normal form if and only if
every non-key attribute is functionally
dependent upon the primary key
22. 22Rushdi Shams, Dept of CSE, KUET
1 NF (continued)1 NF (continued)
3. A relation is in first normal form if the
domains on which its attributes are defined are
scalar
BackBack
23. 23Rushdi Shams, Dept of CSE, KUET
1 NF (continued)1 NF (continued)
Easy Definition:Easy Definition:
1 NF is a process of removing repeating groups1 NF is a process of removing repeating groups
from a table by creating a new tablefrom a table by creating a new table
They are linked by a one to many relationshipThey are linked by a one to many relationship
Create primary keys on both tablesCreate primary keys on both tables
The child table will have a composite primaryThe child table will have a composite primary
key (one of its own, other is its foreign key fromkey (one of its own, other is its foreign key from
its parent table)its parent table)
24. 24Rushdi Shams, Dept of CSE, KUET
What does 1 NF do?What does 1 NF do?
Academic Way:Academic Way:
Eliminates repeating groupsEliminates repeating groups
Defines primary keysDefines primary keys
No duplicate entry allowedNo duplicate entry allowed
All fields other than primary key depend on primaryAll fields other than primary key depend on primary
keykey
All columns must contain a single value (seeAll columns must contain a single value (see
Definition 3Definition 3))
All values in a column must have the same data typeAll values in a column must have the same data type
Create a table to move repeating data from the currentCreate a table to move repeating data from the current
tabletable
26. 26Rushdi Shams, Dept of CSE, KUET
Repeating Groups- Not 1 NFRepeating Groups- Not 1 NF
27. 27Rushdi Shams, Dept of CSE, KUET
0 NF to 1 NF0 NF to 1 NF
Remove repeatingRemove repeating
groups. Split table intogroups. Split table into
tables with one to manytables with one to many
relationship.relationship.
28. 28Rushdi Shams, Dept of CSE, KUET
0 NF to 1 NF (continued)0 NF to 1 NF (continued)
Creating primary key onCreating primary key on
parent table andparent table and
composite primary keycomposite primary key
on child table (where iton child table (where it
has a foreign keyhas a foreign key
referenced to parentreferenced to parent
table)table)
32. 32Rushdi Shams, Dept of CSE, KUET
Second Normal Form- 2 NFSecond Normal Form- 2 NF
Academic Definition:Academic Definition:
1. A relation is in second normal form if and only
if it is in first normal form and every non-key
attribute is fully functionally dependent on the
primary key
2.2. A relation is in second normal form ifA relation is in second normal form if it is init is in
first normal formfirst normal form and, in addition,and, in addition, all itsall its
attributes are dependent on the entireattributes are dependent on the entire
candidate keycandidate key
33. 33Rushdi Shams, Dept of CSE, KUET
What does 2 NF do?What does 2 NF do?
Academic Way:Academic Way:
The table is in 1 NFThe table is in 1 NF
All non-key values must be functionally dependent on
the primary key. In other words, non-key fields not
dependent on the primary key are not allowed.
Partial dependencies must be removed. A partial
dependency is a special type of functional dependency
that exists when a field is dependant on a part of a
composite primary key.
Create a table with partially dependent part of the
primary key and its dependents.
34. 34Rushdi Shams, Dept of CSE, KUET
Which is not 2 NF?Which is not 2 NF?
Solution!Solution!
41. 41Rushdi Shams, Dept of CSE, KUET
Remember Me? I was not 2 NF!!Remember Me? I was not 2 NF!!
See Me!See Me!
42. 42Rushdi Shams, Dept of CSE, KUET
33rdrd
Normal Form- 3 NFNormal Form- 3 NF
Academic Way:Academic Way:
The table must be in 2 NFThe table must be in 2 NF
Eliminate transitive dependency (Eliminate transitive dependency (
see Transitive Dependencysee Transitive Dependency))
Create a new table to contain any separatedCreate a new table to contain any separated
columnscolumns
43. 43Rushdi Shams, Dept of CSE, KUET
3 NF3 NF
Easy Way:Easy Way:
Meet the requirements by 1 NF and 2 NFMeet the requirements by 1 NF and 2 NF
Remove columns that are not fully dependentRemove columns that are not fully dependent
on the primary keyon the primary key
44. 44Rushdi Shams, Dept of CSE, KUET
3 NF (case study)3 NF (case study)
Imagine we have a table that contains theImagine we have a table that contains the
following columns-following columns-
1.1. Order numberOrder number
2.2. Customer numberCustomer number
3.3. Unit priceUnit price
4.4. QuantityQuantity
5.5. TotalTotal
45. 45Rushdi Shams, Dept of CSE, KUET
3 NF (case study): Checking if it is in3 NF (case study): Checking if it is in
1 NF1 NF
1.1. Order numberOrder number
2.2. Customer numberCustomer number
3.3. Unit priceUnit price
4.4. QuantityQuantity
5.5. TotalTotal
Are there duplicate columns? No!Are there duplicate columns? No!
Do we have a primary key? Yes, the order number!Do we have a primary key? Yes, the order number!
Fine, it is in 1 NF then!!Fine, it is in 1 NF then!!
46. 46Rushdi Shams, Dept of CSE, KUET
3 NF (case study): Checking if it is in3 NF (case study): Checking if it is in
2 NF2 NF
1.1. Order numberOrder number
2.2. Customer numberCustomer number
3.3. Unit priceUnit price
4.4. QuantityQuantity
5.5. TotalTotal
Are there any static of data that apply toAre there any static of data that apply to
multiple rows? No!multiple rows? No!
Fine, we are in 2 NF then!!Fine, we are in 2 NF then!!
47. 47Rushdi Shams, Dept of CSE, KUET
3 NF (case study): Checking if it is in3 NF (case study): Checking if it is in
3 NF3 NF
1.1. Order numberOrder number
2.2. Customer numberCustomer number
3.3. Unit priceUnit price
4.4. QuantityQuantity
5.5. TotalTotal
Are all of the columns fully depend on theAre all of the columns fully depend on the
primary key (order number)?primary key (order number)?
48. 48Rushdi Shams, Dept of CSE, KUET
3 NF (case study): Checking if it is in3 NF (case study): Checking if it is in
3 NF (continued)3 NF (continued)
The customer number varies with the order numberThe customer number varies with the order number
and it doesn't appear to depend upon any of the otherand it doesn't appear to depend upon any of the other
fieldsfields
What about the unit price? This field could beWhat about the unit price? This field could be
dependent upon the customer number in a situationdependent upon the customer number in a situation
where we charged each customer a set price. However,where we charged each customer a set price. However,
looking at the data above, it appears we sometimeslooking at the data above, it appears we sometimes
charge the same customer different prices. Therefore,charge the same customer different prices. Therefore,
the unit price is fully dependent upon the order numberthe unit price is fully dependent upon the order number
49. 49Rushdi Shams, Dept of CSE, KUET
3 NF (case study): Checking if it is in3 NF (case study): Checking if it is in
3 NF (continued)3 NF (continued)
The quantity of items also varies from order toThe quantity of items also varies from order to
order, so we're OK there.order, so we're OK there.
What about the total? It looks like we might beWhat about the total? It looks like we might be
in trouble here. The total can be derived byin trouble here. The total can be derived by
multiplying the unit price by the quantity,multiplying the unit price by the quantity,
therefore it's not fully dependent upon thetherefore it's not fully dependent upon the
primary key. We must remove it from the tableprimary key. We must remove it from the table
to comply with the third normal form.to comply with the third normal form.
50. 50Rushdi Shams, Dept of CSE, KUET
3 NF (case study): Making it a 3 NF3 NF (case study): Making it a 3 NF
1.1. Order numberOrder number
2.2. Customer numberCustomer number
3.3. Unit priceUnit price
4.4. QuantityQuantity
Now, the table is in 3 NF. What about total?Now, the table is in 3 NF. What about total?
Well, there is no need to put it on a separateWell, there is no need to put it on a separate
table! You can make a select command to grabtable! You can make a select command to grab
the total by multiplying unit price withthe total by multiplying unit price with
quantity- can’t you?quantity- can’t you?
51. 51Rushdi Shams, Dept of CSE, KUET
3 NF3 NF
Did you see theDid you see the
irrelevant columns in theirrelevant columns in the
2 tables?2 tables?
You need to separateYou need to separate
them!them!
52. 52Rushdi Shams, Dept of CSE, KUET
3 NF (continued)3 NF (continued)
Eliminated the irrelevantEliminated the irrelevant
columns and makingcolumns and making
them a separate table.them a separate table.
53. 53Rushdi Shams, Dept of CSE, KUET
3 NF (continued)3 NF (continued)
Can you see theCan you see the
irrelevant column here?irrelevant column here?
You need to separateYou need to separate
them to make it a 3 NF!them to make it a 3 NF!
55. 55Rushdi Shams, Dept of CSE, KUET
3 NF (continued)3 NF (continued)
Did you see the columnDid you see the column
that does not depend onthat does not depend on
the primary key?the primary key?
You need to separateYou need to separate
that column from thethat column from the
table to make it 3 NFtable to make it 3 NF
59. 59Rushdi Shams, Dept of CSE, KUET
Be warned!Be warned!
3 NF is said to be the most crucial and most3 NF is said to be the most crucial and most
ambiguous, most complex part of normalization!ambiguous, most complex part of normalization!
60. 60Rushdi Shams, Dept of CSE, KUET
Bad thing of too much normalizationBad thing of too much normalization
Did you take a look at the number of tableDid you take a look at the number of table
increased from 0 NF to 3 NF? If it is a bigincreased from 0 NF to 3 NF? If it is a big
enterprise database, then can you imagine howenterprise database, then can you imagine how
far this can go?far this can go?
Too many tables lead us to too many joinsToo many tables lead us to too many joins
Joins are one of the complex codings and timeJoins are one of the complex codings and time
consuming subtle entities in database systemsconsuming subtle entities in database systems
So, try to normalize, but don’t normalize in aSo, try to normalize, but don’t normalize in a
way that you have 1000 tables!way that you have 1000 tables!
61. 61Rushdi Shams, Dept of CSE, KUET
Beyond 3 NFBeyond 3 NF
Most software development firms dealing withMost software development firms dealing with
database systems do not go beyond 3 NF anddatabase systems do not go beyond 3 NF and
many of them even try not to reach 3 NF!!many of them even try not to reach 3 NF!!
62. 62Rushdi Shams, Dept of CSE, KUET
Boyce Codd Normal Form (BCNF)Boyce Codd Normal Form (BCNF)
It is a variation of 3 NFIt is a variation of 3 NF
In a 3NF table, all attributes are dependent on a key, aIn a 3NF table, all attributes are dependent on a key, a
whole key and nothing but a keywhole key and nothing but a key
A table is said to be in BCNF if and only if it is in 3NFA table is said to be in BCNF if and only if it is in 3NF
and every non-trivial, left-irreducible functionaland every non-trivial, left-irreducible functional
dependency has a candidate key as its determinantdependency has a candidate key as its determinant
In more informal terms, a table is in BCNF if it is inIn more informal terms, a table is in BCNF if it is in
3NF and the only determinants are the candidate keys3NF and the only determinants are the candidate keys
64. 64Rushdi Shams, Dept of CSE, KUET
BCNF (continued)BCNF (continued)
Primary key is product category and productPrimary key is product category and product
subcategorysubcategory
The table is in 3NF, for each of its non-key attributes isThe table is in 3NF, for each of its non-key attributes is
non-transitively dependent on the full key (Productnon-transitively dependent on the full key (Product
Category, Product Subcategory).Category, Product Subcategory).
65. 65Rushdi Shams, Dept of CSE, KUET
BCNF (continued)BCNF (continued)
Yet the table has redundant data. Look at column 1,Yet the table has redundant data. Look at column 1,
column 3 and column 4 for the last 4 rows!column 3 and column 4 for the last 4 rows!
66. 66Rushdi Shams, Dept of CSE, KUET
BCNF (continued)BCNF (continued)
Indeed, Range Code is dictated by the combination of ProductIndeed, Range Code is dictated by the combination of Product
Category and Stock CategoryCategory and Stock Category
Is stock category a candidate key? NO! Then it is not in BCNF!!Is stock category a candidate key? NO! Then it is not in BCNF!!
67. 67Rushdi Shams, Dept of CSE, KUET
BCNF (continued)BCNF (continued)
The point about BCNF is that a candidate key is, by
definition, a unique key, and thus a potential primary
key.
If a table contains more than one candidate key
(primary key), it has a problem according to BCNF. I
disagree!
BCNF divides a table up into multiple tables to ensure
that no single table has more than one potential primary
key
BCNF prohibits a table from having two possible
primary keys.
68. 68Rushdi Shams, Dept of CSE, KUET
Anomaly problemAnomaly problem
In this table, say, studentNo and Area is primary keyIn this table, say, studentNo and Area is primary key
69. 69Rushdi Shams, Dept of CSE, KUET
Anomaly problemAnomaly problem
What if 123456 wants to change her subject toWhat if 123456 wants to change her subject to
information systems? We will lose the data-information systems? We will lose the data-
who is taking the course computer science?who is taking the course computer science?
This is update anomalyThis is update anomaly
70. 70Rushdi Shams, Dept of CSE, KUET
Anomaly problemAnomaly problem
What if staff 250 also will take computer science? IfWhat if staff 250 also will take computer science? If
there is no student enrolled in that subject, then wethere is no student enrolled in that subject, then we
cannot insert that information in this table!!cannot insert that information in this table!!
This is insert anomalyThis is insert anomaly
71. 71Rushdi Shams, Dept of CSE, KUET
Anomaly problemAnomaly problem
What if 123456 wants to withdraw from the courseWhat if 123456 wants to withdraw from the course
Software Engineering? We will lose the data-Software Engineering? We will lose the data-
Who will take the course Software Engineering!!Who will take the course Software Engineering!!
This is delete anomalyThis is delete anomaly
72. 72Rushdi Shams, Dept of CSE, KUET
Why anomaly?Why anomaly?
The anomalies occurred because, there are twoThe anomalies occurred because, there are two
overlapping candidate keys- student number andoverlapping candidate keys- student number and
area!area!
73. 73Rushdi Shams, Dept of CSE, KUET
Normalizing to BCNFNormalizing to BCNF
Suppose a relation R is not inSuppose a relation R is not in BCNFBCNF. Then there must be some. Then there must be some
functional dependency X → A where X is not a superkey.functional dependency X → A where X is not a superkey.
In this case, the relation can be decomposed into the twoIn this case, the relation can be decomposed into the two
relationsrelations
1.1. R1= R − AR1= R − A
2.2. R2= XAR2= XA
where R − A simply means dropping the attribute A from thewhere R − A simply means dropping the attribute A from the
schema and XA is the relation whose attributes are those in Xschema and XA is the relation whose attributes are those in X
together with Atogether with A
Then examine the new tables if you can apply 1 and 2 on themThen examine the new tables if you can apply 1 and 2 on them
again!again!
When you cannot apply 1 and 2 on them, then it’s in BCNF!!When you cannot apply 1 and 2 on them, then it’s in BCNF!!
74. 74Rushdi Shams, Dept of CSE, KUET
BCNF ExampleBCNF Example
Product category+stock category determines range code.Product category+stock category determines range code.
So, make two tables.So, make two tables.
1.1. Product category, product subcategory, stock category, rangeProduct category, product subcategory, stock category, range
subcodesubcode
2.2. Product category, stock category, range codeProduct category, stock category, range code
75. 75Rushdi Shams, Dept of CSE, KUET
BCNF example (continued)BCNF example (continued)
76. 76Rushdi Shams, Dept of CSE, KUET
BCNF example (continued)BCNF example (continued)
Now, observe this new table. In it, the range subcodeNow, observe this new table. In it, the range subcode
depends on stock category and product subcategory.depends on stock category and product subcategory.
So, make two tables.So, make two tables.
1.1. Product category, product subcategory, stock categoryProduct category, product subcategory, stock category
2.2. Product subcategory, stock category, range subcodeProduct subcategory, stock category, range subcode
77. 77Rushdi Shams, Dept of CSE, KUET
BCNF example (continued)BCNF example (continued)
79. 79Rushdi Shams, Dept of CSE, KUET
Fourth Normal Form (4 NF)Fourth Normal Form (4 NF)
A table must be in 3 NF or BCNF with 3 NFA table must be in 3 NF or BCNF with 3 NF
Multi-valued dependencies must be transformed into functional
dependencies. This implies that one value and not multiple
values are dependent on a primary key.
Eliminate multiple sets of multiple valued or multi-valued
dependencies, sometimes described as non-trivial multi-valued
dependencies.
NF and has no multiple sets of multi-valued dependencies. In
other words, 4NF states that no entity can have more than a
single one-to-many relationship within an entity if the one-to-
many attributes are independent of each other.
80. 80Rushdi Shams, Dept of CSE, KUET
4 NF Example4 NF Example
In this table, there are 3In this table, there are 3
columns. Employee, skillcolumns. Employee, skill
and skilllanguageand skilllanguage
Employee is the primaryEmployee is the primary
keykey
The table is in BCNFThe table is in BCNF
with 3NFwith 3NF
81. 81Rushdi Shams, Dept of CSE, KUET
4 NF Example4 NF Example
The record for employeeThe record for employee
number 0122443 can benumber 0122443 can be
written also in the form-written also in the form-
0122443: Typing,0122443: Typing,
Dictation: English,Dictation: English,
French in the formFrench in the form
employee: skill:employee: skill:
skilllanguageskilllanguage
82. 82Rushdi Shams, Dept of CSE, KUET
4 NF Example4 NF Example
So, the multivaluedSo, the multivalued
dependency is on skilldependency is on skill
column and skilllanguagecolumn and skilllanguage
column!column!
To make it in 4 NF, youTo make it in 4 NF, you
will have to simply splitwill have to simply split
them into separate table,them into separate table,
nothing else!!nothing else!!
84. 84Rushdi Shams, Dept of CSE, KUET
Solving one, creates anotherSolving one, creates another
problem!problem!
Can you say, what is the problem still with theCan you say, what is the problem still with the
tables?tables?
There are still 2 entries for the same employee!!There are still 2 entries for the same employee!!
85. 85Rushdi Shams, Dept of CSE, KUET
Fifth Normal Form (5 NF)Fifth Normal Form (5 NF)
Personally, I really hate this form!!Personally, I really hate this form!!
The table must have to be in 4 NF (same oldThe table must have to be in 4 NF (same old
dialogue!)dialogue!)
The table should not contain any cyclicThe table should not contain any cyclic
dependency!dependency!
Cyclic dependency is like say your table has 3Cyclic dependency is like say your table has 3
columns. Column 1 depends on 2, 2 on 3 and 3columns. Column 1 depends on 2, 2 on 3 and 3
on 1!!on 1!!
Also known as PJNF (Projection Normal Form)Also known as PJNF (Projection Normal Form)
86. 86Rushdi Shams, Dept of CSE, KUET
5 NF (continued)5 NF (continued)
Try begin with creating a table EmployeesTry begin with creating a table Employees
All the 3 columns are primary key (kind of weird, isn’tAll the 3 columns are primary key (kind of weird, isn’t
it?? We can call it composite primary key)it?? We can call it composite primary key)
87. 87Rushdi Shams, Dept of CSE, KUET
5 NF (continued)5 NF (continued)
Let’s insert some data in Employees table then.Let’s insert some data in Employees table then.
88. 88Rushdi Shams, Dept of CSE, KUET
5 NF (continued)5 NF (continued)
Employees table now look like this!Employees table now look like this!
There is no multivalued dependency, so, the table is inThere is no multivalued dependency, so, the table is in
4 NF (of course also in 1-2-3-BC NF!!)4 NF (of course also in 1-2-3-BC NF!!)
89. 89Rushdi Shams, Dept of CSE, KUET
5 NF (continued)5 NF (continued)
Now, let’s play with the basic table Employees. We willNow, let’s play with the basic table Employees. We will
split the table into three tables. WHY? I will say yousplit the table into three tables. WHY? I will say you
later.later.
We are making three tables- project_employee,We are making three tables- project_employee,
project_manager, manager_employeeproject_manager, manager_employee
90. 90Rushdi Shams, Dept of CSE, KUET
Detail of project_employeeDetail of project_employee
91. 91Rushdi Shams, Dept of CSE, KUET
Detail of project_managerDetail of project_manager
92. 92Rushdi Shams, Dept of CSE, KUET
Detail of manager_employeeDetail of manager_employee
93. 93Rushdi Shams, Dept of CSE, KUET
The Fun!The Fun!
Now, we will query the initial table Employees! It will show usNow, we will query the initial table Employees! It will show us
the whole tablethe whole table
94. 94Rushdi Shams, Dept of CSE, KUET
The Fun Continues!The Fun Continues!
Now, we will join the three new tables and will get theNow, we will join the three new tables and will get the
same answer!!same answer!!
95. 95Rushdi Shams, Dept of CSE, KUET
So, what is the fun for?So, what is the fun for?
The fun is, if you have a table in 4 NF but withThe fun is, if you have a table in 4 NF but with
cyclic dependency, if you can split it into xcyclic dependency, if you can split it into x
number of tables and then while joining those xnumber of tables and then while joining those x
number of tables, it will give you back the initialnumber of tables, it will give you back the initial
table, you then made it 5 NF while splitting!table, you then made it 5 NF while splitting!
Phew!!Phew!!
96. 96Rushdi Shams, Dept of CSE, KUET
Domain Key Normal Form (DKNF)Domain Key Normal Form (DKNF)
Please god, help us! There are loads of normalPlease god, help us! There are loads of normal
forms! I cannot go beyond that! Well, folks, thisforms! I cannot go beyond that! Well, folks, this
one is the last- I promise!!one is the last- I promise!!
Domain/key normal form (DKNF) is a normalDomain/key normal form (DKNF) is a normal
used in database normalization which requiresused in database normalization which requires
that the database contains no constraints otherthat the database contains no constraints other
than domain constraints and key constraints.than domain constraints and key constraints.
97. 97Rushdi Shams, Dept of CSE, KUET
DKNF (continued)DKNF (continued)
This table violates the rules for being DKNFThis table violates the rules for being DKNF
If Wealthy person type is Eccentric Millionaire/ evil millionaire,If Wealthy person type is Eccentric Millionaire/ evil millionaire,
then the Net Worth in Dollars must be 1,000,000 to 999,999,999then the Net Worth in Dollars must be 1,000,000 to 999,999,999
inclusive and if that is Evil Billionaire/ Eccentric Billionaire, theninclusive and if that is Evil Billionaire/ Eccentric Billionaire, then
it should be 1,000,000,000 or higher.it should be 1,000,000,000 or higher.
98. 98Rushdi Shams, Dept of CSE, KUET
So, what to do?So, what to do?
Nothing serious, the violation on domain can be solvedNothing serious, the violation on domain can be solved
easily by changing the domain of Wealthy Person Typeeasily by changing the domain of Wealthy Person Type
to Eccentric and Evil- forget about Millionaire andto Eccentric and Evil- forget about Millionaire and
Billionaire!!Billionaire!!
It is then in DKNF!!It is then in DKNF!!
99. 99Rushdi Shams, Dept of CSE, KUET
The Flow chartThe Flow chart
Say, you are given a table in 0 NF. Do theSay, you are given a table in 0 NF. Do the
followings one by one-followings one by one-
1.1. Are there duplicate rows? Find the answer NoAre there duplicate rows? Find the answer No
2.2. Is there primary key? Find the answer yes (thenIs there primary key? Find the answer yes (then
you finished making it in 1 NF)you finished making it in 1 NF)
3.3. Are all the non-key columns functionallyAre all the non-key columns functionally
depend on primary key? Find the answer yesdepend on primary key? Find the answer yes
(then you finished making it 2 NF)(then you finished making it 2 NF)
100. 100Rushdi Shams, Dept of CSE, KUET
The Flow Chart (continued)The Flow Chart (continued)
4.4. Are all the columns that are non key depending fullyAre all the columns that are non key depending fully
functionally upon the primary key? Find the answerfunctionally upon the primary key? Find the answer
yes (then you made it into 3 NF)yes (then you made it into 3 NF)
5.5. Are all the determinants candidate key of the table?Are all the determinants candidate key of the table?
Find the answer yes (then you made it into BCNF)Find the answer yes (then you made it into BCNF)
6.6. Are there multivalued dependency? Find the answerAre there multivalued dependency? Find the answer
no (then you made it into 4 NF)no (then you made it into 4 NF)
7.7. Are there any cyclic dependency? Find the answer noAre there any cyclic dependency? Find the answer no
(then you made it into 5 NF)(then you made it into 5 NF)
8.8. Are there any violation to domain constraints? FindAre there any violation to domain constraints? Find
the answer no (then you made it into DKNF)the answer no (then you made it into DKNF)
101. 101Rushdi Shams, Dept of CSE, KUET
ReferencesReferences
Designing Effective Database Systems byDesigning Effective Database Systems by
Rebecca M. Riordan, Addison WesleyRebecca M. Riordan, Addison Wesley
Professional, 2005Professional, 2005
Database Systems by Paul Beynon-Devies,Database Systems by Paul Beynon-Devies,
Palgrave Macmillan, 2004Palgrave Macmillan, 2004
www.wikipedia.orgwww.wikipedia.org
Beginning Database Design by GavinBeginning Database Design by Gavin
Powell, Wrox Publications, 2005Powell, Wrox Publications, 2005
102. 102Rushdi Shams, Dept of CSE, KUET
References (continued)References (continued)
www.techtarget.comwww.techtarget.com
http://http://databases.about.comdatabases.about.com
Databases –Normalization by GordonDatabases –Normalization by Gordon
Royle, Department of Computer Science &Royle, Department of Computer Science &
Software Engineering University ofSoftware Engineering University of
Western AustraliaWestern Australia
Database Management Systems by Prof.Database Management Systems by Prof.
Holowczak, Zicklin School of Business,Holowczak, Zicklin School of Business,
Baruch College, City University of NewBaruch College, City University of New
YorkYork