Download to read offline

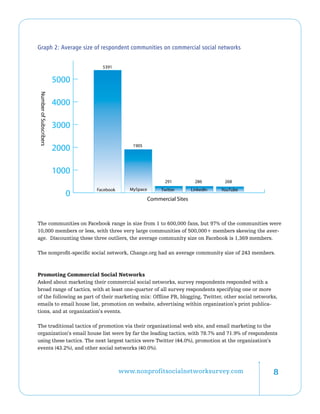
![House Community Size
When queried about the size of their house communities, three-quarters (74.4%) of survey respon-
dents specify 2,500 or less registered members, 12.2% have 2,501 to 10,000 members, and another
13.5% have more than 10,000.
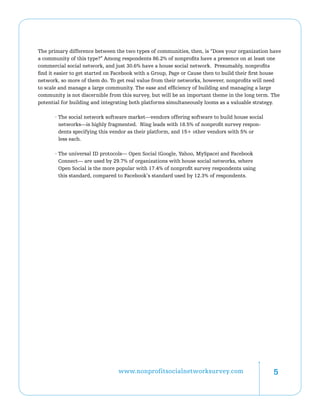
Marketing House Communities
Nonprofit survey respondents are using more traditional channels most often to promote their house
social networks to prospective community members—nearly three-quarters (74.7%) of respondents
say they market their house community via their web site. Seventy-two percent (72.1%) of survey
respondents use email marketing to the organization’s email house list to promote their house social
network, and 61.7% use promotion at organizational events.
Social media channels are used less often by survey respondents to promote their house social net-
works with other social networks (40.9%) , blogging (38.3%), and Twitter (35.7%) [JM4] among the
most commonly used in this emerging promotional category.
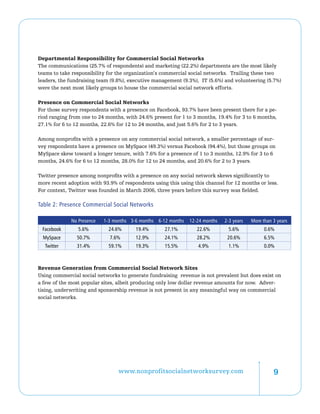
Departmental Ownership
Communications, marketing and executive management are the top three owning departments of an
organization’s house social networks with 22.2%, 14.6% and 13.3%, respectively of survey respon-
dents citing these as the department with primary responsibility for the management and mainte-
nance of these sites.
Community Duration
The duration—how long since you launched your house social network—skews to more recent
launches but includes more than one-quarter of survey respondents that launched their communities
two or more years ago.
Of the survey respondents with house social networks roughly four in ten survey respondents (41.4%)
launched their house networks one to 6 months ago, 31.2%) launched their sites 6 months to 2 years
ago, and 27.4% have had house social networks in place for more than two years.
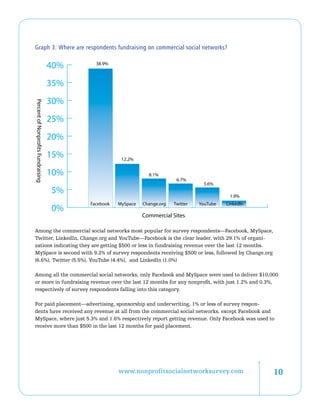
Revenue Generation from House Social Networks
Very few nonprofit survey respondents are generating substantive revenue from their house social
networks. Among survey respondents ,74.7% are not fundraising at all on their house social net-
works. Of the remaining quarter of survey respondents fundraising on their community sites, one-
third (35.0%) raised $10,000 or more over the last 12 months.
Paid placement—advertising, underwriting and sponsorship—on house social networks is used by
14.8%) of respondents, with 5.8% indicating they brought in $1,000 or less over the last 12 months.
The other 9% spanned the range of $1,000 to $100,000+ in paid placement over the preceding year.
www.nonprofitsocialnetworksurvey.com 13](https://image.slidesharecdn.com/nonprofitsocialnetworksurveyreport-130119120606-phpapp01/85/Nonprofit-socialnetworksurveyreport-13-320.jpg)

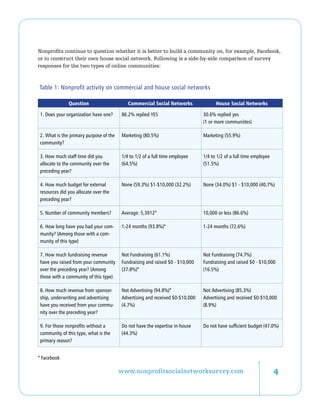
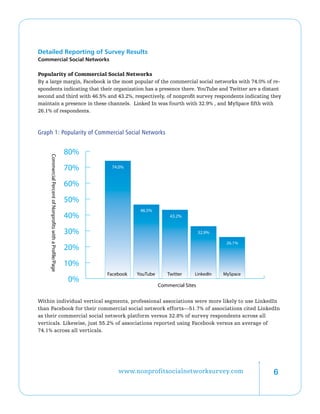
The survey found that commercial social networks, especially Facebook, are popular among nonprofits but community sizes remain small on average. Most nonprofits have been using these networks for less than two years. While staff time and budgets dedicated to social networks are real, they remain relatively small. Nonprofits prefer traditional marketing over social media to promote their networks. Fundraising revenue from social networks is limited, with most raising $500 or less annually on Facebook. House social networks are less common, with similar community sizes and tenure, but some generate more substantial fundraising revenue.


