Downloaded 675 times


![Chapter 1 – Burden: mortality, morbidity and risk factors
43) Chobanian AV et al. The seventh report of the Joint National Committee on Prevention, Detection,
Evaluation, and Treatment of High Blood Pressure: the JNC 7 report. JAMA, 2003, 289:2560–2572.
44) Williams B et al. British Hypertension Society guidelines for hypertension management (BHS-IV):
summary. BMJ, 2004, 328:634–640.
45) Danaei G et al. National, regional, and global trends in systolic blood pressure since 1980: systematic
analysis of health examination surveys and epidemiological studies with 786 country-years and 5·4
million participants. The Lancet, 2011; 377(9765):568–577.
46) The world health report 2002: Reducing risks, promoting healthy life. Geneva, World Health Organization,
2002.
47) Obesity: preventing and managing the global epidemic: report of a WHO Consultation. Geneva, World
Health Organization, 2000 (WHO Technical Report Series, 894).
48) Finucane MM et al. National, regional, and global trends in body-mass index since 1980: systematic
analysis of health examination surveys and epidemiological studies with 960 country-years and 9.1
million participants. The Lancet, 2011; 337(9765):557–567.
49) Sobal J, Stunkard AJ. Socioeconomic status and obesity: a review of the literature. Psychological
Bulletin, 1989, 105:260–275.
50) Martinez JA et al. Variables independently associated with self-reported obesity in the European Union.
Public Health Nutrition, 1999, 2:125–133.
51) van Lenthe FJ et al. Investigating explanations of socioeconomic inequalities in health: the Dutch
GLOBE study. European Journal of Public Health, 2004, 14:63–70.
52) Gutierrez-Fisac JL et al. The size of obesity differences associated with educational level in Spain, 1987
and 1995/97. Journal of Epidemiology and Community Health, 2002, 56:457–460.
53) Sundquist J, Johansson SE. The influence of socioeconomic status, ethnicity and lifestyle on body mass
index in a longitudinal study. International Journal of Epidemiology, 1998, 27:57–63.
54) Obesity: third report of session 2003–2004. Volume 1: Report, together with formal minutes. London,
House of Commons, 2004. (Document HC 23-1).
55) McMurray RG et al. The influence of physical activity, socioeconomic status, and ethnicity on the weight
status of adolescents. Obesity Research, 2000, 8:130–139.
56) Wang Y. Cross-national comparison of childhood obesity: the epidemic and the relationship between
obesity and socioeconomic status. International Journal of Epidemiology, 2001, 30:1129–1136.
57) Ezzati M et al. Selected major risk factors and global and regional burden of disease. The Lancet, 2002,
360:1347–1360.
58) Law MR, Wald NJ, Thompson SG. By how much and how quickly does reduction in serum cholesterol
concentration lower risk of ischaemic heart disease? British Medical Journal, 1994, 308:367–372.
59) Farzadfar F et al. National, regional, and global trends in serum total cholesterol since 1980: systematic
analysis of health examination surveys and epidemiological studies with 321 country-years and 3.0
million participants. The Lancet, 2011, 337(9765):578–586.
60) Bouvard V et al. on behalf of the WHO International Agency for Research on Cancer Monograph
Working Group. Special report: Policy. A review of human carcinogens—part B: Biological agents. The
Lancet Oncology, 2009, 10:321–322.
61) Hepatitis viruses. Lyon, International Agency for Research on Cancer, 1994.
62) Human papillomaviruses. Lyon, International Agency for Research on Cancer, 2007
63) Schistosomes, liver flukes and helicobacter pylori. Lyon, International Agency for Research on Cancer,
1994.
64) Franceschi S. Gaps in knowledge and needed research directions [abstract]. EUROGIN Congress, 2010.
65) Cogliano V et al. Preventable causes of human cancers. Journal of National Cancer Institute (submitted
for publication).
66) A review of human carcinogens. Part D: Radiation. Lyon, International Agency for Research on Cancer
(in press).
67) UNSCEAR 2000 Report to the General Assembly on the effects of atomic radiation, with scientific
annexes Volume I: SOURCES. Vienna, United Nations Scientific Committee, 2000.
68) Berrington De González A, Darby S. Risk of cancer from diagnostic X-rays: estimates for the UK and
14 other countries. The Lancet, 2004, 363: 345–351.
30](https://image.slidesharecdn.com/noncommunicablediseases-130107084453-phpapp01/85/Noncommunicable-diseases-42-320.jpg)


![56
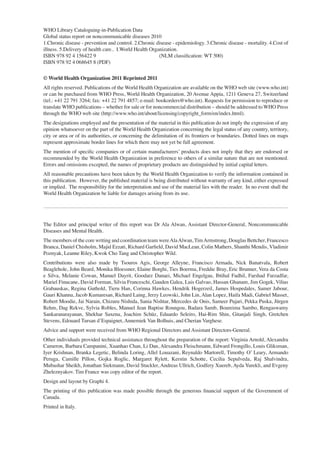
Table 1. Interventions to tackle non-communicable disease risk factors: identifying ‘best buys’
Risk factor Interventions / actions Avoidable burden Cost-effectiveness b Implementation cost Feasibility
( US$ per DALY prevented) (US$ per capita) (health system
(DALYs, in millions; (* core set of ‘best buys’, (DALYs averted, [Very = < GDP per person; [Very low = < US$0.50
constraints)
a millions) Quite = < 3xGDP per person Quite low = < US$ 1
% global burden) Others are ‘good buys’)
Less = >3xGDP per person] Higher = > US$ 1]
Protect people from tobacco smoke * Combined effect:
Tobacco use 25-30 m DALYs Highly feasible; strong
Warn about the dangers of tobacco * Very cost-effective Very low cost
Enforce bans on tobacco advertising * averted framework (FCTC)
(> 50m DALYs;
Raise taxes on tobacco * (> 50% tobacco
3.7% global burden)
Offer counselling to smokers burden) Quite cost-effective Quite low cost Feasible (primary care)
Harmful use of Restrict access to retailed alcohol *
Enforce bans on alcohol advertising * Combined effect: Very cost-effective Very low cost Highly feasible
alcohol
Raise taxes on alcohol * 5-10 m DALYs averted
(> 50m DALYs; Enforce drink-driving laws (breath-testing) (10-20% alcohol burden) Intersectoral action
Quite cost-effective Quite low cost
4.5% global burden) Offer brief advice for hazardous drinking Feasible (primary care)
Reduce salt intake *
Replace trans-fat with polyunsaturated fat * Effect of salt reduction: Very cost-effective Very low cost Highly feasible
Promote public awareness about diet * +
5 m DALYs averted
Unhealthy diet
Restrict marketing of food and beverages to children Other interventions: Very cost-effective
(15-30m DALYs; Replace saturated fat with unsaturated fat Not yet assessed Very low cost Highly feasible
c Manage food taxes and subsidies globally (more studies needed)
1-2% global burden)
Offer counselling in primary care Quite cost-effective Higher cost Feasible (primary care)
Provide health education in worksites
Less cost-effective Quite low cost Highly feasible
Chapter 4 – Reducing risks and preventing disease: population-wide interventions
Promote healthy eating in schools
Promote physical activity (mass media) * + Very cost-effective Very low cost Highly feasible
Physical inactivity Promote physical activity (communities)
Not assessed globally Not assessed globally Intersectoral action
Support active transport strategies Not yet assessed
(> 30m DALYs; Offer counselling in primary care globally Feasible (primary care)
Quite cost-effective
2.1% global burden) Promote physical activity in worksites Higher cost
Promote physical activity in schools Less cost-effective Highly feasible
Infection Prevent liver cancer via hepatitis B vaccination * Not yet assessed globally Very cost-effective Very low cost Feasible (primary care)
a
DALYs (or disability-adjusted life years) are widely used as a measure of premature mortality and ill-health - one DALY can be thought of as one lost year of healthy life.
b
Main data sources for globally applicable cost-effectiveness estimates are the Disease Control Priorities project (www.DCP2.org) and the WHO-CHOICE project (www.who.int/choice)
c
This estimate is based on the combined burden of low fruit and vegetable intake, high cholesterol, overweight and obesity, high blood glucose, high blood pressure - all diet related - and low physical activity.
(m=millions)
+ Considered a best buy when the two interventions are implemented together.](https://image.slidesharecdn.com/noncommunicablediseases-130107084453-phpapp01/85/Noncommunicable-diseases-68-320.jpg)


![Chapter 4 – Reducing risks and preventing disease: population-wide interventions
47) Skeaff CM. Feasibility of recommending certain replacement or alternative fats. European Journal of
Clinical Nutrition, 2009, 63:S34–S49.
48) L’Abbé MR et al. Approaches to removing trans fats from the food supply in industrialized and
developing countries. European Journal of Clinical Nutrition, 2009, 63(Suppl):S50–S67.
49) A review of nutrition policies. Geneva, World Health Organization, 2011.
50) Nutrition labels and health claims: the global regulatory environment. Geneva, World Health
Organization, 2004.
51) Evidence on the long-term effects of breastfeeding: systematic review and meta-analyses. Geneva,
World Health Organization, 2007.
52) Global strategy for infant and young child feeding. Geneva, World Health Organization, 2003.
53) Planning guide for national implementation of the Global Strategy for Infant and Young Child Feeding.
Geneva, World Health Organization, 2007
54) Fats and fatty acids in human nutrition. Report of an expert consultation. Rome, Food and Agriculture
Organization of the United Nations, 2010.
55) Paulweber B et al. for the Writing Group, on behalf of the IMAGE Study Group. A European Evidence-
Based Guideline for the Prevention of Type 2 Diabetes. Hormone and Metabolic Research, 2010; 42
(Suppl.1): S3–S36.
56) Greaves CJ et al. for the IMAGE Study Group. Systematic review of reviews of intervention
components associated with increased effectiveness in dietary and physical activity interventions.
BioMed Central Public Health, 2011, 11:119.
57) Cecchini M et al. Tackling of unhealthy diets, physical inactivity, and obesity: health effects and cost
effectiveness. The Lancet, 2010, 376:1775–1784.
58) Hastings G et al. Review of research on the effects of food promotion to children. London, Food
Standards Agency, 2003.
59) The extent, nature and effects of food promotion to children: a review of the evidence to December
2008. Geneva, World Health Organization, 2009.
60) The extent, nature and effects of food promotion to children: a review of the evidence. Geneva, World
Health Organization, 2006.
61) McGinnis JM, Gootman JA, Kraak VI, eds. Food marketing to children and youth: threat or
opportunity? Washington, DC, National Academies Press, 2006.
62) Hawkes C, Lobstein T. Regulating the commercial promotion of food to children: a survey of actions
worldwide. International Journal of Pediatric Obesity, 2010. [Epub ahead of print]
63) Changes in food and drink advertising and promotion to children. A report outlining the changes in
the nature and balance of food and drink advertising and promotion to children, from January 2003 to
December 2007. London, Department of Health UK, 2008.
64) Marketing of food and non-alcoholic beverages to children. Resolution WHA63.14 of the Sixty-third
World Health Assembly. Geneva, World Health Organization, 2010.
65) Guo X et al. Food price policy can favorably alter macronutrient intake in China. Journal of Nutrition,
1999, 129:994–1001.
66) Suhrcke M et al. Economic consequences of chronic diseases and the economic rationale for public
and private intervention. London, Oxford Health Alliance, 2005.
67) Economic nutrition policy tools–useful in the challenge to combat obesity and poor nutrition? Lyngby,
Danish Academy of Technical Sciences, 2007.
68) Breast cancer screening. Lyon, International Agency for Research on Cancer, 2002 (IARC Handbooks
of Cancer Prevention, Vol. 7).
69) Cervix Cancer Screening. Lyon, International Agency for Research on Cancer, 2005 (IARC Handbooks
of Cancer Prevention, Vol. 10).
70) Cancer control: knowledge into action: WHO guide for effective programmes module 2. Geneva, World
Health Organization, 2007.
71) National cancer control programmes: policies and managerial guidelines. 2nd ed. Geneva, World
Health Organization. 2002
72) Ginsberg GM et al. Screening, prevention and treatment of cervical cancer -- a global and regional
generalized cost-effectiveness analysis. Vaccine, 2009; 27:6060–6079.
59](https://image.slidesharecdn.com/noncommunicablediseases-130107084453-phpapp01/85/Noncommunicable-diseases-71-320.jpg)


![68
Table 2. Health care interventions to tackle noncommunicable diseases: identifying ‘best buys’
Disease Interventions / actions Avoidable burden Cost–effectiveness b Implementation cost Feasibility
(DALYs averted, ( US$ per DALY prevented) (US$ per capita)
(% global burden; (* core set of ‘best buys’) millions) [Very = < GDP per person; [Very low = < US$ 0.50; (health system constraints)
DALYs a) Quite = < 3* GDP per person Quite low = < US$ 1
Less = >3* GDP per person] Higher = > US$ 1]
Counselling and multidrug therapy (including
glycaemic control for diabetes mellitus) for 60 m DALYs averted
people (≥30 years), with 10-year risk of fatal or Very cost-effective Quite low cost Feasible (primary care)
Cardiovascular (35% CVD burden)
nonfatal cardiovascular events ≥ 30% * c
disease (CVD)
and diabetes 4 m DALYs averted Very cost-effective Quite low cost
Aspirin therapy for acute myocardial (2% CVD burden)
infarction *
(170 m DALYs;
Counselling and multidrug therapy (including.
11.3% global burden)
glyceamic control for diabetes mellitus) for 70 m DALYs averted Quite cost-effective Higher cost
people ( ≥ 30 years), with a 10-year risk of fatal
Chapter 5 – Improving health care: individual interventions
(40% CVD burden)
and nonfatal cardiovascular events ≥ 20%
Cervical cancer screening (VIA), and 5 m DALYs averted Very cost-effective Very low cost Feasible (primary care)
treatment of pre-cancerous lesions to prevent (6% cancer burden) Treatment may require referral
cervical cancer*
Cancer
Breast cancer – treatment of stage I 3 m DALYs averted Quite cost-effective
Breast cancer – early case-finding through (4% cancer burden) Higher cost Not feasible in primary care
(78 m DALYs; Quite cost-effective
biennial mammographic screening (50–70 years) 15 m DALYs averted Higher cost
5.1% global burden)
and treatment of all stages (19% cancer burden)
Colorectal cancer-screening at age 50 and 7 m DALYs averted Quite cost-effective Quite low cost
treatment (9% cancer burden)
Oral cancer – early detection and treatment Not established globally Not assessed globally Not assessed
Respiratory Treatment of persistent asthma with inhaled Not established globally Quite cost-effective Very low cost Feasible (primary care)
corticosteroids and beta-2 agonists (expected to be small)
disease
(60 m DALYs;
3.9% global burden)
a
DALYs (or disability-adjusted life years) are widely used as a measure of premature mortality and ill-health - one DALY can be thought of as one lost year of healthy life.
b
Prevention and control of NCDs: priorities for investment. Discussion paper for the First Global Ministerial Conference on Healthy Lifestyles and Noncommunicable Disease Control. Geneva, World Health Organization, 2011.
c
Includes prevention of recurrent vascular events in people with established coronary heart disease and cerebrovascular disease.](https://image.slidesharecdn.com/noncommunicablediseases-130107084453-phpapp01/85/Noncommunicable-diseases-80-320.jpg)


The report provides an overview of the global burden of noncommunicable diseases (NCDs) such as cardiovascular diseases, cancers, diabetes, and chronic respiratory diseases. It finds that NCDs killed 36 million people in 2008, with nearly 80% of NCD deaths occurring in low- and middle-income countries. Risk factors like tobacco use, unhealthy diet, physical inactivity, and harmful alcohol use are major contributors to the NCD burden. The report analyzes population-wide and individual interventions that can effectively reduce NCD mortality and morbidity, and calls for urgent action to address the growing NCD epidemic globally.


