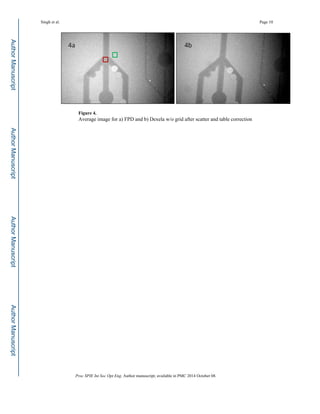
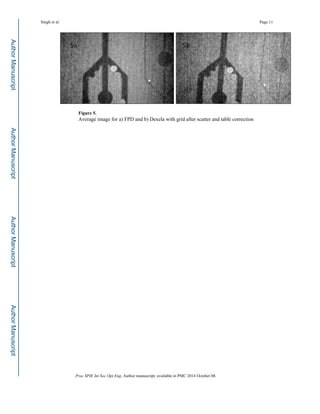
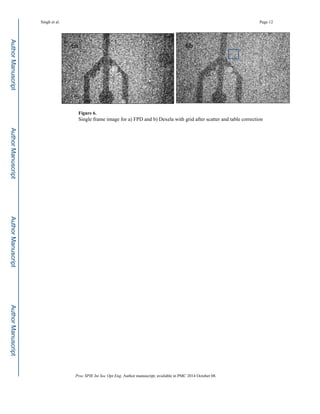
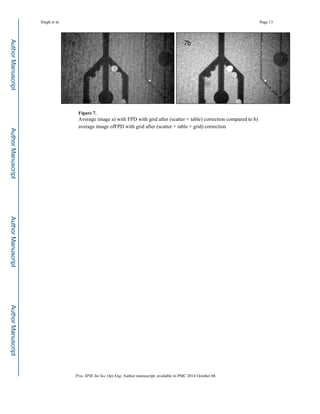
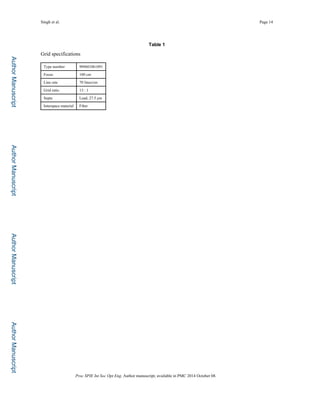
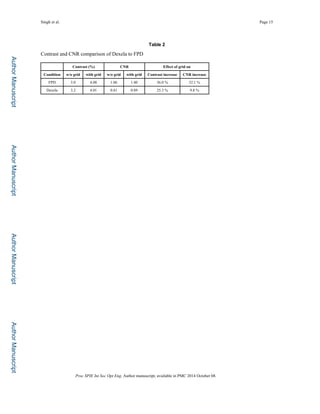
1) An experiment compared the effectiveness of an anti-scatter grid when used with a high-resolution CMOS detector (Dexela 1207 with 75 micron pixels) versus a flat panel detector (FPD, Paxscan 2020 with 194 micron pixels).
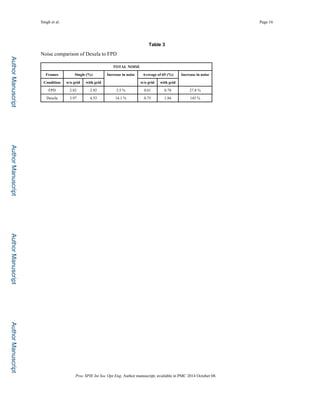
2) When the grid was used, contrast improved for both detectors but the contrast-to-noise ratio (CNR) did not increase as much for the Dexela due to a substantial increase in total noise compared to the FPD.
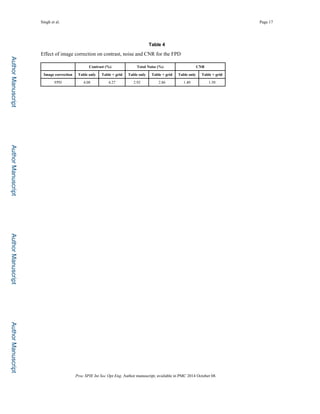
3) The increased noise for the Dexela was caused by higher fixed pattern noise from the grid lines, as the quantum noise increase from radiation attenuation should have been similar for both detectors. Without
Smart Noise Cancellation Processing: New Level of Clarity in Digital RadiographyCarestream
Smart Noise Cancellation significantly reduces noise in diagnostic images while retaining fine spatial detail –there is no degradation of anatomical sharpness. When SNC is applied, it produces images that are significantly clearer than with standard processing. It also provides better contrast-to-noise ratio for images acquired at a broad range of exposures.
Whitepaper: Image Quality Impact of SmartGrid Processing in Bedside Chest Ima...Carestream
Scattered radiation is known to degrade image quality in
diagnostic X-ray imaging. A new image processing tool, SmartGrid, has been developed that compensates for the effects of X-ray scatter in an image, and produces results comparable to those of a physical antiscatter grid. Read the white paper to learn more.
Digital Tomosynthesis: Theory of OperationCarestream
Digital Tomosynthesis (DT) is a new radiographic imaging technique that is revived from the nearly century-old traditional film-screen tomography. This rejuvenation is all made possible by the recent advances in high frame-rate, high-sensitivity flat-panel digital radiographic detector, rapid pulsed-exposure sequence-capable high-frequency x-ray generator, the widely available and low-cost computer GPU processing power, and the precision motion controls built in the digital radiography system hardware. Read the white paper.
EVP Plus Software delivers state-of-the-art image processing for CR and DR sy...Carestream
Radiographic technologists expect a high degree of
automation and efficiency in the technology they use in their
daily workflow, which means they expect minimal interaction
with the technology’s modality software. At the same time,
radiologists also need the flexibility to specify their site’s
individualized diagnostic viewing preferences. The CARESTREAM DirectView EVP Plus Software successfully
overcomes this challenge for digital-projection radiography.
EVP Plus automatically processes and delivers diagnostic-quality DR and CR images to PACS, based on look preferences that can be uniquely specified by each site.
Image Quality, Artifacts and it's Remedies in CT-Avinesh ShresthaAvinesh Shrestha
CT is one of the frequently used diagnostic imaging modalities in Radiology. Knowledge about image quality and artifacts is essential when diagnosing a patient with the help of CT images. Moreover, Radiology Technologist's should be very well aware about the ways to identify and eliminate or minimize the artifacts in CT for better image quality.
Tube and Line and Pneumothorax Visualization SoftwareCarestream
Carestream has implemented companion views in its digital
radiography systems. A companion view is designed to
complement the standard processed radiographic image
delivered from the digital radiography capture modality to
PACS, to provide an additional rendering tailored for the visual
interpretation needed for a specific diagnostic or clinical
purpose. Two companion views are available in Carestream
products for chest radiography: one for the optimal
visualization of tubes and lines in chest radiographs
(CARESTREAM Tube & Line Visualization Software), and the
other for enhancing the conspicuity of a pneumothorax
(CARESTREAM Pneumothorax Visualization Software).
Bone Suppression for Chest Radiographic ImagesCarestream
Learn about Carestream's Bone Suppression Software and how it's used to aid in the detection of lung diseases.
For more information on Carestream's software solutions, please visit http://carestream.com/software
Rician Noise Reduction with SVM and Iterative Bilateral Filter in Different T...IJMERJOURNAL
ABSTRACT: Parallel magnetic resonance imaging (pMRI) techniques can speed up MRI scan through a multi-channel coil array receiving signal simultaneously. Nevertheless, noise amplification and aliasing artifacts are serious in pMRI reconstructed images at high accelerations. Image Denoising is one of the most challenging task because image denoising techniques not only poised some technical difficulties, but also may result in the destruction of the image (i.e. making it blur) if not effectively and adequately applied to image. This study presents a patch-wise de-noising method for pMRI by exploiting the rank deficiency of multi-Channel coil images and sparsity of artifacts. For each processed patch, similar patches a researched in spatial domain and through-out all coil elements, and arranged in appropriate matrix forms. Then, noise and aliasing artifacts are removed from the structured Matrix by applying sparse and low rank matrix decomposition method. The proposed method has been validated using both phantom and in vivo brain data sets, producing encouraging results. Specifically, the method can effectively remove both noise and residual aliasing artifact from pMRI reconstructed noisy images, and produce higher peak signal noise rate (PSNR) and structural similarity index matrix (SSIM) than other state-of-the-art De-noising methods. We propose image de-noising using low rank matrix decomposition (LMRD) and Support vector machine (SVM). The aim of Low Rank Matrix approximation based image enhancement is that it removes the various types of noises in the contaminated image simultaneously. The main contribution is to explore the image denoising low-rank property and the applications of LRMD for enhanced image Denoising, Then support vector machine is applied over the result.
Filtering Techniques to reduce Speckle Noise and Image Quality Enhancement me...IOSR Journals
Abstract: Noise in images is the vital factor which degrades the quality of the images. Reducing noise from the
satellite images, medical images etc., is a challenge for the researchers in digital image processing. Several
approaches are there for noise reduction. Generally speckle noise is commonly found in Synthetic Aperture
Radar (SAR) satellite images and medical images. This research paper put forward some of the filtering
techniques for the removal of speckle noise from the satellite images, which enhances the quality of the images.
Although many filters are available for speckle reduction, some filters are best suited for SAR images are used
for which the statistical parameters are calculated for the output images obtained from all the filters. The
statistical measures SNR, PSNR, RMSE and CoC are compared. The output images corresponding to the best
statistical values are displayed along with the filters name and corresponding values of the statistical measures.
Keywords: Filters, Speckle noise reduction, Image enhancement, Satellite images, Statistical measures.
Shadow Detection and Removal using Tricolor Attenuation Model Based on Featur...ijtsrd
Presently present TAM FD, a novel expansion of tricolor constriction model custom fitted for the difficult issue of shadow identification in pictures. Past strategies for shadow discovery center on learning the neighborhood appearance of shadow areas, while utilizing restricted nearby setting thinking as pairwise possibilities in a Conditional Random Field. Interestingly, the proposed methodology can display more elevated amount connections and worldwide scene attributes. We train a shadow locator that relates to the generator of a restrictive TAM, and expand its shadow precision by consolidating the run of the mill TAM misfortune with an information misfortune term utilizing highlight descriptor. Shadows happen when articles impede direct light from a wellspring of enlightenment, which is generally the sun. As indicated by the rule of arrangement, shadows can be separated into cast shadow and self shadow. Cast shadow is planned by the projection of articles toward the light source self shadow alludes to the piece of the item that isnt enlightened. For a cast shadow, the piece of it where direct light is totally hindered by an article is named the umbra, while the part where direct light is mostly blocked is named the obscuration. On account of the presence of an obscuration, there wont be an unequivocal limit among shadowed and non shadowed regions the shadows cause incomplete or all out loss of radiometric data in the influenced zones, and therefore, they make errands like picture elucidation, object identification and acknowledgment, and change recognition progressively troublesome or even inconceivable. SDI record improves by 1.76 . Shading segment record for safeguard shading difference during evacuation of shadow procedure is improved by 9.75 . Standardize immersion esteem discovery file NSVDI is improve by 1.89 for distinguish shadow pixel. Rakesh Dangi | Anjana Nigam ""Shadow Detection and Removal using Tricolor Attenuation Model Based on Feature Descriptor"" Published in International Journal of Trend in Scientific Research and Development (ijtsrd), ISSN: 2456-6470, Volume-3 | Issue-4 , June 2019, URL: https://www.ijtsrd.com/papers/ijtsrd25127.pdf
Paper URL: https://www.ijtsrd.com/engineering/computer-engineering/25127/shadow-detection-and-removal-using-tricolor-attenuation-model-based-on-feature-descriptor/rakesh-dangi
Image Denoising Using Earth Mover's Distance and Local HistogramsCSCJournals
In this paper an adaptive range and domain filtering is presented. In the proposed method local histograms are computed to tune the range and domain extensions of bilateral filter. Noise histogram is estimated to measure the noise level at each pixel in the noisy image. The extensions of range and domain filters are determined based on pixel noise level. Experimental results show that the proposed method effectively removes the noise while preserves the details. The proposed method performs better than bilateral filter and restored test images have higher PSNR than those obtained by applying popular Bayesshrink wavelet denoising method.
Bandwidth density optimization of misaligned optical interconnectsIJECEIAES
In this paper, the bandwidth density of misaligned free space optical interconnects (FSOIs) system with and without coding under a fixed bit error rate is considered. In particular, we study the effect of using error correction codes of various codeword lengths on the bandwidth density and misalignment tolerance of the FSOIs system in the presence of higher order modes. Moreover, the paper demonstrates the use of the fill factor of the detector array as a design parameter to optimize the bandwidth density of the communication. The numerical results demonstrate that the bandwidth density improves significantly with coding and the improvement is highly dependent on the used codeword length and code rate. In addition, the results clearly show the optimum fill factor values that achieve the maximum bandwidth density and misalignment tolerance of the system.
An Ultrasound Image Despeckling Approach Based on Principle Component AnalysisCSCJournals
An approach based on principle component analysis (PCA) to filter out multiplicative noise from ultrasound images is presented in this paper. An image with speckle noise is segmented into small dyadic lengths, depending on the original size of the image, and the global covariance matrix is found. A projection matrix is then formed by selecting the maximum eigenvectors of the global covariance matrix. This projection matrix is used to filter speckle noise by projecting each segment into the signal subspace. The approach is based on the assumption that the signal and noise are independent and that the signal subspace is spanned by a subset of few principal eigenvectors. When applied on simulated and real ultrasound images, the proposed approach has outperformed some popular nonlinear denoising techniques such as 2D wavelets, 2D total variation filtering, and 2D anisotropic diffusion filtering in terms of edge preservation and maximum cleaning of speckle noise. It has also showed lower sensitivity to outliers resulting from the log transformation of the multiplicative noise.
Image Filtering Using all Neighbor Directional Weighted Pixels: Optimization ...sipij
In this paper a novel approach for de noising images corrupted by random valued impulses has been proposed. Noise suppression is done in two steps. The detection of noisy pixels is done using all neighbor directional weighted pixels (ANDWP) in the 5 x 5 window. The filtering scheme is based on minimum variance of the four directional pixels. In this approach, relatively recent category of stochastic global optimization technique i.e., particle swarm optimization (PSO) has also been used for searching the parameters of detection and filtering operators required for optimal performance. Results obtained shows better de noising and preservation of fine details for highly corrupted images.
COMPUTATIONALLY EFFICIENT TWO STAGE SEQUENTIAL FRAMEWORK FOR STEREO MATCHINGijfcstjournal
Almost all the existing stereo algorithms fall under a common assumption that corresponding color or
intensity values will be similar like one another. On the other hand, it is also not that true in practice
where the image color or intensity values are regularly affected by different radiometric factors like
illumination direction, change in image device, illuminant color and so on. For this issue, the information
about the raw color of the images which is recorded by the camera should not depend on it totally, and
also the common assumptions on color consistency doesn’t influence good (great) between the stereo
images in real scenario. Therefore, most of the conventional stereo algorithms can be seriously degraded
in terms of performance under radiometric variations. In this work, we intend to develop a new stereo
matching algorithm which will be insensitive to change in radiometric conditions between stereo pairs i.e.
left image as well as right image. Unlike the other stereo algorithms, we propose a computationally
efficient two stage sequential framework for stereo matching which can handle the various radiometric
variations between the stereo pairs.Experimental results proves that the proposed method outperforms
extremely well compare to other state of the art stereo methods under change in various radiometric
conditions for a given stereo pair and it is also found from the results that the execution time is less
compare to existing methods.
A Study of Total-Variation Based Noise-Reduction Algorithms For Low-Dose Cone...CSCJournals
In low-dose cone-beam computed tomography, the reconstructed image is contaminated with
excessive quantum noise. In this work, we examined the performance of two popular noisereduction
algorithms—total-variation based on the split Bregman (TVSB) and total-variation based
on Nesterov’s method (TVN)—on noisy imaging data from a computer-simulated Shepp–Logan
phantom, a physical CATPHAN phantom and head-and-neck patient. Up to 15% Gaussian noise
was added to the Shepp–Logan phantom. The CATPHAN phantom was scanned by a Varian OBI
system with scanning parameters 100 kVp, 4 ms, and 20 mA. Images from the head-and-neck
patient were generated by the same scanner, but with a 20-ms pulse time. The 4-ms low-dose
image of the head-and-neck patient was simulated by adding Poisson noise to the 20-ms image.
The performance of these two algorithms was quantitatively compared by computing the peak
signal-to-noise ratio (PSNR), contrast-to-noise ratio (CNR) and the total computational time. For
CATPHAN, PSNR improved by 2.3 dB and 3.1 dB with respect to the low-dose noisy image for the
TVSB and TVN based methods, respectively. The maximum enhancement ratio of CNR for
CATPHAN was 4.6 and 4.8 for TVSB and TVN respectively. For data for head-and-neck patient,
the PSNR improvement was 2.7 dB and 3.4 dB for TVSB and TVN respectively. Convergence
speed for the TVSB-based method was comparatively slower than TVN method. We conclude that
TVN algorithm has more desirable properties than TVSB for image denoising.
CHAPTER 1 SEMESTER V PREVENTIVE-PEDIATRICS.pdfSachin Sharma
This content provides an overview of preventive pediatrics. It defines preventive pediatrics as preventing disease and promoting children's physical, mental, and social well-being to achieve positive health. It discusses antenatal, postnatal, and social preventive pediatrics. It also covers various child health programs like immunization, breastfeeding, ICDS, and the roles of organizations like WHO, UNICEF, and nurses in preventive pediatrics.
Explore our infographic on 'Essential Metrics for Palliative Care Management' which highlights key performance indicators crucial for enhancing the quality and efficiency of palliative care services.
This visual guide breaks down important metrics across four categories: Patient-Centered Metrics, Care Efficiency Metrics, Quality of Life Metrics, and Staff Metrics. Each section is designed to help healthcare professionals monitor and improve care delivery for patients facing serious illnesses. Understand how to implement these metrics in your palliative care practices for better outcomes and higher satisfaction levels.
How many patients does case series should have In comparison to case reports.pdfpubrica101
Pubrica’s team of researchers and writers create scientific and medical research articles, which may be important resources for authors and practitioners. Pubrica medical writers assist you in creating and revising the introduction by alerting the reader to gaps in the chosen study subject. Our professionals understand the order in which the hypothesis topic is followed by the broad subject, the issue, and the backdrop.
https://pubrica.com/academy/case-study-or-series/how-many-patients-does-case-series-should-have-in-comparison-to-case-reports/
CRISPR-Cas9, a revolutionary gene-editing tool, holds immense potential to reshape medicine, agriculture, and our understanding of life. But like any powerful tool, it comes with ethical considerations.
Unveiling CRISPR: This naturally occurring bacterial defense system (crRNA & Cas9 protein) fights viruses. Scientists repurposed it for precise gene editing (correction, deletion, insertion) by targeting specific DNA sequences.
The Promise: CRISPR offers exciting possibilities:
Gene Therapy: Correcting genetic diseases like cystic fibrosis.
Agriculture: Engineering crops resistant to pests and harsh environments.
Research: Studying gene function to unlock new knowledge.
The Peril: Ethical concerns demand attention:
Off-target Effects: Unintended DNA edits can have unforeseen consequences.
Eugenics: Misusing CRISPR for designer babies raises social and ethical questions.
Equity: High costs could limit access to this potentially life-saving technology.
The Path Forward: Responsible development is crucial:
International Collaboration: Clear guidelines are needed for research and human trials.
Public Education: Open discussions ensure informed decisions about CRISPR.
Prioritize Safety and Ethics: Safety and ethical principles must be paramount.
CRISPR offers a powerful tool for a better future, but responsible development and addressing ethical concerns are essential. By prioritizing safety, fostering open dialogue, and ensuring equitable access, we can harness CRISPR's power for the benefit of all. (2998 characters)
One of the most developed cities of India, the city of Chennai is the capital of Tamilnadu and many people from different parts of India come here to earn their bread and butter. Being a metropolitan, the city is filled with towering building and beaches but the sad part as with almost every Indian city
Telehealth Psychology Building Trust with Clients.pptxThe Harvest Clinic
Telehealth psychology is a digital approach that offers psychological services and mental health care to clients remotely, using technologies like video conferencing, phone calls, text messaging, and mobile apps for communication.
CHAPTER 1 SEMESTER V - ROLE OF PEADIATRIC NURSE.pdfSachin Sharma
Pediatric nurses play a vital role in the health and well-being of children. Their responsibilities are wide-ranging, and their objectives can be categorized into several key areas:
1. Direct Patient Care:
Objective: Provide comprehensive and compassionate care to infants, children, and adolescents in various healthcare settings (hospitals, clinics, etc.).
This includes tasks like:
Monitoring vital signs and physical condition.
Administering medications and treatments.
Performing procedures as directed by doctors.
Assisting with daily living activities (bathing, feeding).
Providing emotional support and pain management.
2. Health Promotion and Education:
Objective: Promote healthy behaviors and educate children, families, and communities about preventive healthcare.
This includes tasks like:
Administering vaccinations.
Providing education on nutrition, hygiene, and development.
Offering breastfeeding and childbirth support.
Counseling families on safety and injury prevention.
3. Collaboration and Advocacy:
Objective: Collaborate effectively with doctors, social workers, therapists, and other healthcare professionals to ensure coordinated care for children.
Objective: Advocate for the rights and best interests of their patients, especially when children cannot speak for themselves.
This includes tasks like:
Communicating effectively with healthcare teams.
Identifying and addressing potential risks to child welfare.
Educating families about their child's condition and treatment options.
4. Professional Development and Research:
Objective: Stay up-to-date on the latest advancements in pediatric healthcare through continuing education and research.
Objective: Contribute to improving the quality of care for children by participating in research initiatives.
This includes tasks like:
Attending workshops and conferences on pediatric nursing.
Participating in clinical trials related to child health.
Implementing evidence-based practices into their daily routines.
By fulfilling these objectives, pediatric nurses play a crucial role in ensuring the optimal health and well-being of children throughout all stages of their development.
Global launch of the Healthy Ageing and Prevention Index 2nd wave – alongside...ILC- UK
The Healthy Ageing and Prevention Index is an online tool created by ILC that ranks countries on six metrics including, life span, health span, work span, income, environmental performance, and happiness. The Index helps us understand how well countries have adapted to longevity and inform decision makers on what must be done to maximise the economic benefits that comes with living well for longer.
Alongside the 77th World Health Assembly in Geneva on 28 May 2024, we launched the second version of our Index, allowing us to track progress and give new insights into what needs to be done to keep populations healthier for longer.
The speakers included:
Professor Orazio Schillaci, Minister of Health, Italy
Dr Hans Groth, Chairman of the Board, World Demographic & Ageing Forum
Professor Ilona Kickbusch, Founder and Chair, Global Health Centre, Geneva Graduate Institute and co-chair, World Health Summit Council
Dr Natasha Azzopardi Muscat, Director, Country Health Policies and Systems Division, World Health Organisation EURO
Dr Marta Lomazzi, Executive Manager, World Federation of Public Health Associations
Dr Shyam Bishen, Head, Centre for Health and Healthcare and Member of the Executive Committee, World Economic Forum
Dr Karin Tegmark Wisell, Director General, Public Health Agency of Sweden
ICH Guidelines for Pharmacovigilance.pdfNEHA GUPTA
The "ICH Guidelines for Pharmacovigilance" PDF provides a comprehensive overview of the International Council for Harmonisation of Technical Requirements for Pharmaceuticals for Human Use (ICH) guidelines related to pharmacovigilance. These guidelines aim to ensure that drugs are safe and effective for patients by monitoring and assessing adverse effects, ensuring proper reporting systems, and improving risk management practices. The document is essential for professionals in the pharmaceutical industry, regulatory authorities, and healthcare providers, offering detailed procedures and standards for pharmacovigilance activities to enhance drug safety and protect public health.
2. scanning-beams or moving grids which have additional implementation complexity in real-
time imaging. Also the static grid enables adequate control of scatter without increasing
geometric un-sharpness as in the case of air-gap techniques and hence they are widely used
in projection x-ray radiography to reduce scattered radiation and improve image contrast.
Unfortunately, stationary anti-scatter grids can leave grid-line shadows (grid-line artifact)
and moiré patterns4 on the image, depending upon line density of the grid and the sampling
frequency of the x-ray detector, which may still degrade the image quality and mask the
small details in the image.
Besides cutting down the scattered radiation, the grid also attenuates the primary radiation
and this causes an increase in the noise which also could decrease the contrast to noise ratio
(CNR) and consequently could impair the visibility of low contrast objects. Therefore, the
effectiveness of an anti-scatter grid demands that there be an increase in both the image
contrast and the CNR. This implies that the increase in both the quantum and the structured
noise level due to introduction of the grid should be such that the overall CNR will
nevertheless improve.
2. METHODS AND MATERIALS
The study was done by analyzing images of the simulated artery block phantom (Nuclear
Associates, Stenosis/Aneurysm Artery Block 76-705) taken with the frontal head equivalent
phantom5, 6 used as the scattering source. The artery phantom was an acrylic block (15 × 45
× 2.5 cm thick) that contained three iodine-filled simulated arteries whose widths were 1, 2
and 4 mm in one half of the block while the other half has no features (see Fig. 1a). Each
artery included stenoses and aneurysms that are one-fourth, one-half and three-fourths of the
artery's width. The iodine concentration is 15mg/ml. The slot located in the middle of the
frontal head equivalent phantom (see Fig. 1b) allows the artery block to slide into the
phantom when the artery features are to be evaluated (see Fig. 1c and 1d).
A Toshiba Infinix C-arm imaging system was used to image the phantom for a field of view
(FOV) of approximately (15 cm × 15 cm) at the detector plane with a high-resolution
detector, Dexela 1207 CMOS X-ray detector (pixel size 75 μ and sensitive area 11.5 cm ×
6.5 cm), and the flat panel detector (FPD), Paxscan 2020 (pixel size 194 μ and sensitive area
19.8 cm × 19.8 cm), without (w/o) and with a grid. The Dexela was placed almost in the
center of the FOV to simulate a high-resolution detector with a large sensitive area. In this
way even though this specific Dexela detector could not image the full 15x15 cm FOV, a
future detector with the same high resolution as this detector but with a larger FOV and
exhibiting the scatter of such a larger FOV could be simulated.
The Smit Roentgen X-ray grid (Smit Roentgen, Best, Netherlands) used was the same one
normally used with the FPD system. Table 1 shows the relevant specifications.
The experimental set-up is shown in the Fig. 2. The detector and the grid respectively are 6.7
cm and 3.7 cm above the top end of the whole phantom (frontal head equivalent phantom
with artery block in the slot).
Singh et al. Page 2
Proc SPIE Int Soc Opt Eng. Author manuscript; available in PMC 2014 October 08.
Author
Manuscript
Author
Manuscript
Author
Manuscript
Author
Manuscript
3. The images of the artery block were taken with the table at 84 kVp in angiography mode
without (w/o) the grid (‘object w/o grid’) and with the grid (‘object with grid’). Scatter-free
images of the table w/o the grid (‘table w/o grid’) and with the grid (‘table with grid’) and
the flat-fields of the detectors were taken with the featureless part of the artery block in the
slot (to keep the filtration of the x-ray beam the same) while keeping the whole phantom far
from the detector and close to the source. In this study, wherever an average is mentioned it
is the average of 65 single frames. All the images were flat-field and offset corrected for
both detectors.
Image Corrections
The ‘object w/o grid’ images were divided by the average (65 frames) of the ‘table w/o grid’
to eliminate the blotches due to the table in the images (table correction) and shown in Fig.3.
To correct for the effect of scatter, an estimate of the scatter component was obtained by
taking the difference in the mean value of a selected region between the average frame of
the ‘object w/o grid’ and the ‘table w/o grid’ and this was subtracted from the ‘object w/o
grid’ images; the result was then divided by the average of the ‘table w/o grid’ to correct for
table structure noise (scatter and table correction). The average of the ‘object w/o grid’
images corrected both for the scatter and the table is shown in the Fig. 4. Similarly, the
difference in the mean value of the same region in the average frame of both the ‘object with
grid’ and the ‘table with grid’ was subtracted from the ‘object with grid’ images and then
divided by the average of the ‘table w/o grid’ and the average of these is shown in the Fig. 5.
Contrast Calculation
The images shown in Fig. 4a and 5a were used to calculate contrast w/o and with the grid for
the FPD and images shown in Fig 4b and 5b were used for the Dexela for the contrast
calculation. An area was selected in the 4 mm thick artery to serve as signal and the same
size area is selected in the background in the central part of the image. The images shown in
Fig. 4a and 5a were used to calculate contrast w/o and with the grid for the FPD and images
shown in Fig 4b and 5b were used for the Dexela for the contrast calculation. An area was
selected in the 4 mm thick artery to serve as signal and the same size area is selected in the
background in the central part of the image. These selected regions are shown respectively
as red box and green box in the Fig. 4a in the case of the FPD. In the case of the Dexela, the
size of the each box was 51 × 51 pixels which is equivalent to almost 20 × 20 pixels for the
FPD to represent the same area. The difference in the average pixel intensity value of the
background and the signal was normalized with the average pixel intensity value of the
background to determine the contrast (refer to Table 2).
Noise Calculation
In order to characterize noise in a single frame for the images ‘object w/o grid’ and ‘object
with grid’ following the scatter and table correction, a blue box (twice the size of green box)
was selected in a single frame as shown in Fig.6b in the case of the Dexela. In the case of
Dexela the size of the blue box was 101 × 101 pixels which is equivalent to almost 40 × 40
pixels for the FPD to represent the same area. This blue box was further divided into 36
smaller overlapping sub-regions of 51 × 51 pixels in the case of Dexela and 25 smaller
overlapping sub-regions of 20 × 20 pixels in the case of FPD. The noise of a sub-region is
Singh et al. Page 3
Proc SPIE Int Soc Opt Eng. Author manuscript; available in PMC 2014 October 08.
Author
Manuscript
Author
Manuscript
Author
Manuscript
Author
Manuscript
4. defined as the ratio of the standard deviation of the pixel intensity by the average pixel
intensity value of the sub-region. The noise in a sub-region of the blue box varies a lot with
sub-region for the ‘object with grid’ images due to formation of moiré patterns and grid-line
artifacts which are clearly visible in the average frames (Fig. 5a and 5b); therefore, the
averaging over all the sub-regions in the blue box was done to calculate noise in the blue
box. It was found that the noise in the blue box varies also with frame so it was averaged
further over ten different frames and taken as noise in a single frame (refer Table 3).
CNR Calculation
The ratio of the contrast in the averaged image to the noise in the single frame was defined
as the contrast-to-noise ratio (CNR) (refer to Table 2). The noise in the average frame in
Table 3 refers to the noise in the blue box of the average frame.
3. RESULTS
Figures 3, 4, 5 and 6 show images of arteries of width 4 mm and 1 mm obtained with the
Dexela and FPD under various conditions. Fig. 3 shows images obtained after only the table
correction was applied and the residual blotches in the images are due to structure in the
table which could not be removed properly in the phantom images by just the table
correction because the image of the table alone used for the correction was scatter free while
the image of the object with the table included scatter. The scatter adds a constant to the
pixel values in the image for the same attenuation of the beam for the given filtration and the
effect cannot be eliminated by dividing it by the image obtained w/o scatter. This kind of
image with residual blotches was not suitable for doing contrast and noise analysis and
could skew the results and conclusions; therefore, the removal of the blotches was essential
to this analysis. To do this, an estimate of the added scatter was subtracted from the image.
The mean value of a selected region in the average frame of the ‘object w/o grid’ was higher
than the mean value of the same region in the average frame of the ‘table w/o grid’ which
was due to the addition of scatter. The blotches are removed when the difference of the
mean value was first subtracted from the ‘object w/o grid’ images and then divided by the
average of the ‘table w/o grid’ (scatter and table correction) (see Fig. 4). Similarly, this
exercise was repeated with the ‘object with grid’ to remove the blotches and increase the
visibility of grid artifacts and moiré pattern (see Fig. 5).
Table 2 shows that the contrast improves for both detectors when the grid is introduced but
improvement in the CNR is much higher in case of the FPD compared to the Dexela. Table
3 shows that the total noise level for a single frame increases after introducing the grid for
both detectors but the increase is higher for the Dexela (14.1 %) compared to the FPD (3.5
%). There are two factors responsible for the increase in the total noise after introducing the
grid: the first is the increase in the quantum noise due to attenuation of radiation reaching
the detector plane and the second is the line artifacts caused by the grid (fixed pattern noise).
The combined effect is much worse in the case of Dexela which is evident from the fact that
the visibility of the artery of width 1 mm is clearer both in the single and the average frame
in the case of the FPD compared to the Dexela (Fig 5 and 6). The increase in quantum noise
due to introduction of the grid should be the same, therefore, the increase in the fixed pattern
Singh et al. Page 4
Proc SPIE Int Soc Opt Eng. Author manuscript; available in PMC 2014 October 08.
Author
Manuscript
Author
Manuscript
Author
Manuscript
Author
Manuscript
5. noise (grid line artifacts) in the case of the Dexela is much more compared to the FPD.
Table 3 also shows in the average frame, for which the quantum noise would be minimum,
that the increase in the total noise after introducing the grid, is very high in the case of the
Dexela (145 %) compared to the FPD (27.8 %). This rise in the total noise level is the reason
that improvement in the CNR is not very significant in the case of the Dexela compared to
the FPD.
4. DISCUSSION
The removal of blotches was important to characterize the contrast and the noise more
accurately. The idea that was used to remove the blotches from the images could also be
used to get rid of line artifacts from the ‘object with grid’ images. In order to achieve this,
the difference in the mean value between the same uniform region in the average frame of
the ‘object with grid’ and the ‘table with grid’ was subtracted from the ‘object with grid’
images and then divided by the average of the ‘table with grid’ instead of ‘table w/o grid’.
The average frame of the ‘object with grid’ without grid artifacts is compared to the same
average frame with grid artifacts in the case of the FPD only in Fig 7 (Fig. 5a and 7a are
identical). The visibility of the stenoses (white small circles) in the 1 mm thick artery
improves. The contrast and the CNR both improve very significantly as shown in Table 4.
This is a simple way compared to other more complex methods that rely on image
processing to get rid of grid line artifacts7, 8 and might be used in the case of a high
resolution detector where the problem is more severe as artifacts are more likely to be
visible even in a single frame; however, for the current study this was not implemented
pending the creation of an improved rigid support for the grid.
In reality, scatter is not a constant throughout the field but it is a very low spatial frequency
distribution so it was able to be represented by a constant number as a good approximation
here. In the case of the FPD, we selected a region in the central part of the image, where the
scatter was maximum, to apply this technique. This appeared to work well for the whole
image (Fig 7b). This technique could be implemented with a method for scatter to primary
ratio estimation.
5. CONCLUSIONS
The limitations of an anti-scatter grid of a design commonly used for FPD fluoroscopic
systems are investigated when applied to high resolution x-ray imaging detectors which are
important for neurovascular imaging procedures. We observe that the contrast improves
when the grid is used with the high resolution Dexela detector but the increase in the CNR is
not so significant compared to the case of the FPD. Assuming the quantum noise increases
similarly for both detectors when the grid is used (due to reduced photon fluence), it is the
substantial increase in the visualization of the grid's fixed pattern noise in the case of the
Dexela which degrades the CNR . It may be possible to ameliorate this problem either with a
grid of improved design or with additional image processing corrections to minimize the
structured grid-line artifacts. The latter was demonstrated for the FPD.
Singh et al. Page 5
Proc SPIE Int Soc Opt Eng. Author manuscript; available in PMC 2014 October 08.
Author
Manuscript
Author
Manuscript
Author
Manuscript
Author
Manuscript
6. ACKNOWLEDGEMENTS
This study was supported in part by NIH Grant 2R01 – EB002873 and an equipment grant from Toshiba Systems
Corp.
REFERENCES
1. Neitzel U. Grids or air gaps for scatter reduction in digital radiography: a model calculation.
Medical physics. 1992; 19(2):475–481. [PubMed: 1584148]
2. Barnes GT. Contrast and scatter in x-ray imaging. Radiographics : a review publication of the
Radiological Society of North America, Inc. 1991; 11(2):307–323.
3. Bednarek DR, Rudin S, Wong R. Artifacts produced by moving grids. Radiology. 1983; 147(1):
255–258. [PubMed: 6828740]
4. Gauntt DM, Barnes GT. Grid line artifact formation: A comprehensive theory. Medical physics.
2006; 33(6):1668–1677. [PubMed: 16872074]
5. Ionita CN, Dohatcu A, Jain A, Keleshis C, Hoffmann KR, Bednarek DR, Rudin S. Modification of
the NEMA XR21-2000 cardiac phantom for testing of imaging systems used in endovascular image
guided interventions. Proceedings - Society of Photo-Optical Instrumentation Engineers. 2009;
7258:72584R.
6. Ionita CN, Loughran B, Jain A, Swetadri Vasan SN, Bednarek DR, Levy E, Siddiqui AH, Snyder
KV, Hopkins LN, Rudin S. New head equivalent phantom for task and image performance
evaluation representative for neurovascular procedures occurring in the Circle of Willis.
Proceedings of SPIE. 2012; 8313:83130Q.
7. Lin CY, Lee WJ, Chen SJ, Tsai CH, Lee JH, Chang CH, Ching YT. A study of grid artifacts
formation and elimination in computed radiographic images. Journal of digital imaging. 2006;
19(4):351–361. [PubMed: 16763931]
8. Kim DS, Lee S. Grid artifact reduction for direct digital radiography detectors based on rotated
stationary grids with homomorphic filtering. Medical physics. 2013; 40(6):061905. [PubMed:
23718596]
Singh et al. Page 6
Proc SPIE Int Soc Opt Eng. Author manuscript; available in PMC 2014 October 08.
Author
Manuscript
Author
Manuscript
Author
Manuscript
Author
Manuscript
7. Figure 1.
Pictures of head phantom used in study a) artery block insert, b) side view of head phantom
with artery block inserted through center, c)top view of head phantom with uniform section
of artery block inserted, d) top view of head phantom with vascular section of artery
inserted.
Singh et al. Page 7
Proc SPIE Int Soc Opt Eng. Author manuscript; available in PMC 2014 October 08.
Author
Manuscript
Author
Manuscript
Author
Manuscript
Author
Manuscript
8. Figure 2.
The experimental setup to study the effect of the grid
Singh et al. Page 8
Proc SPIE Int Soc Opt Eng. Author manuscript; available in PMC 2014 October 08.
Author
Manuscript
Author
Manuscript
Author
Manuscript
Author
Manuscript
9. Figure 3.
Average image for a) FPD and b) Dexela w/ o grid after table correction
Singh et al. Page 9
Proc SPIE Int Soc Opt Eng. Author manuscript; available in PMC 2014 October 08.
Author
Manuscript
Author
Manuscript
Author
Manuscript
Author
Manuscript
10. Figure 4.
Average image for a) FPD and b) Dexela w/o grid after scatter and table correction
Singh et al. Page 10
Proc SPIE Int Soc Opt Eng. Author manuscript; available in PMC 2014 October 08.
Author
Manuscript
Author
Manuscript
Author
Manuscript
Author
Manuscript
11. Figure 5.
Average image for a) FPD and b) Dexela with grid after scatter and table correction
Singh et al. Page 11
Proc SPIE Int Soc Opt Eng. Author manuscript; available in PMC 2014 October 08.
Author
Manuscript
Author
Manuscript
Author
Manuscript
Author
Manuscript
12. Figure 6.
Single frame image for a) FPD and b) Dexela with grid after scatter and table correction
Singh et al. Page 12
Proc SPIE Int Soc Opt Eng. Author manuscript; available in PMC 2014 October 08.
Author
Manuscript
Author
Manuscript
Author
Manuscript
Author
Manuscript
13. Figure 7.
Average image a) with FPD with grid after (scatter + table) correction compared to b)
average image ofFPD with grid after (scatter + table + grid) correction
Singh et al. Page 13
Proc SPIE Int Soc Opt Eng. Author manuscript; available in PMC 2014 October 08.
Author
Manuscript
Author
Manuscript
Author
Manuscript
Author
Manuscript