Downloaded 139 times
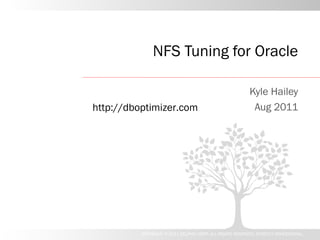


![NFS mount options
Forcedirectio
Rsize / wsize
Actimeo=0, noac
Sun Solaris rw,bg,hard,rsize=32768,wsize=32768,vers=3,[forcedirectio or llock],nointr,proto=tcp,suid
AIX rw,bg,hard,rsize=32768,wsize=32768,vers=3,cio,intr,timeo=600,proto=tcp
HPUX rw,bg,hard,rsize=32768,wsize=32768,vers=3,nointr,timeo=600,proto=tcp, suid, forcedirectio
Linux rw,bg,hard,rsize=32768,wsize=32768,vers=3,nointr,timeo=600,tcp,actimeo=0
http://dboptimizer.com](https://image.slidesharecdn.com/kylehaileynfs-130220133904-phpapp02/85/NFS-and-Oracle-41-320.jpg)


![dtrace
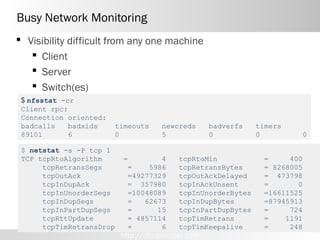
List the names of traceable probes:
dtrace –ln provider:module:function:name
• -l = list instead of enable probes
• -n = Specify probe name to trace or list
• -v = Set verbose mode
Example
dtrace –ln tcp:::send
$ dtrace -lvn tcp:::receive
5473 tcp ip tcp_output send
Argument Types
args[0]: pktinfo_t *
args[1]: csinfo_t *
args[2]: ipinfo_t *
args[3]: tcpsinfo_t *
args[4]: tcpinfo_t *
http://dboptimizer.com](https://image.slidesharecdn.com/kylehaileynfs-130220133904-phpapp02/85/NFS-and-Oracle-52-320.jpg)


![Dtrace
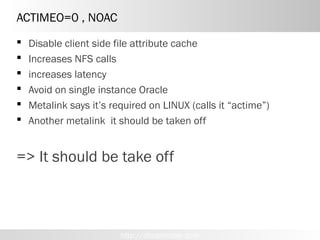
tcp:::send, tcp:::receive
{ delta= timestamp-walltime;
walltime=timestamp;
printf("%6d %6d %6d %8d %8s %8d %8d %8d %8d %d n",
args[3]->tcps_snxt - args[3]->tcps_suna ,
args[3]->tcps_rnxt - args[3]->tcps_rack,
delta/1000,
args[2]->ip_plength - args[4]->tcp_offset,
"",
args[3]->tcps_swnd,
args[3]->tcps_rwnd,
args[3]->tcps_cwnd,
args[3]->tcps_retransmit
);
}
tcp:::receive
{ delta=timestamp-walltime;
walltime=timestamp;
printf("%6d %6d %6d %8s / %-8d %8d %8d %8d %8d %d n",
args[3]->tcps_snxt - args[3]->tcps_suna ,
args[3]->tcps_rnxt - args[3]->tcps_rack,
delta/1000,
"",
args[2]->ip_plength - args[4]->tcp_offset,
args[3]->tcps_swnd,
args[3]->tcps_rwnd,
args[3]->tcps_cwnd,
args[3]->tcps_retransmit
);
}
http://dboptimizer.com](https://image.slidesharecdn.com/kylehaileynfs-130220133904-phpapp02/85/NFS-and-Oracle-55-320.jpg)

The document discusses tuning NFS for Oracle databases. It covers network topology issues like routers and switches that can increase latency. NFS configuration is also important, specifically MTU size for jumbo frames, TCP window size, and congestion window settings. Properly configuring these NFS and network settings is necessary to achieve best performance and avoid dropped packets or out of order delivery.


![Introducing Cach Efx Jan 08[Go]](https://cdn.slidesharecdn.com/ss_thumbnails/introducing-cach-efx-jan-08go-1202843953476499-4-thumbnail.jpg?width=640&height=640&fit=bounds)


![Oracle Open World 2014: Lies, Damned Lies, and I/O Statistics [ CON3671]](https://cdn.slidesharecdn.com/ss_thumbnails/thursday115ionfs-141107125307-conversion-gate02-thumbnail.jpg?width=640&height=640&fit=bounds)


