Downloaded 62 times

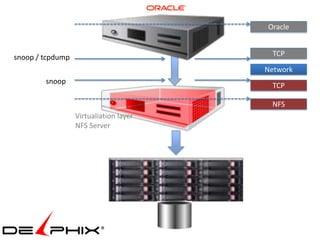
![Author : Dominic Giles
Version : 2.4.0.845
Results will be written to results.xml.
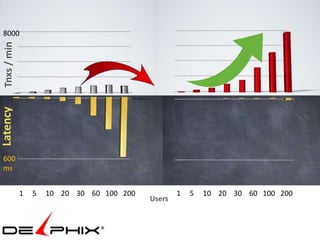
Time Users TPM TPS
3:11:51 PM [0/30] 0 0
3:11:52 PM [30/30] 49 49
3:11:53 PM [30/30] 442 393
3:11:54 PM [30/30] 856 414
3:11:55 PM [30/30] 1146 290
3:11:56 PM [30/30] 1355 209
3:11:57 PM [30/30] 1666 311
3:11:58 PM [30/30] 2015 349
3:11:59 PM [30/30] 2289 274
3:12:00 PM [30/30] 2554 265
3:12:01 PM [30/30] 2940 386
3:12:02 PM [30/30] 3208 268
3:12:03 PM [30/30] 3520 312
3:12:04 PM [30/30] 3835 315](https://image.slidesharecdn.com/collaboratevdbperformance-130410193620-phpapp01/85/Collaborate-vdb-performance-33-320.jpg)
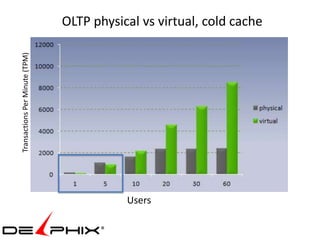
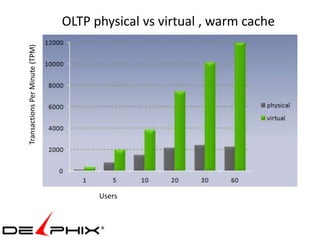
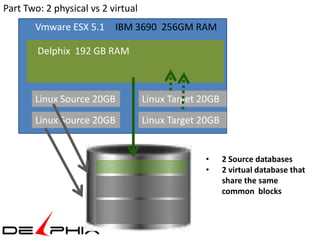
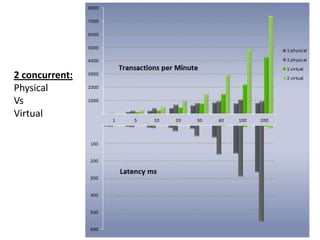
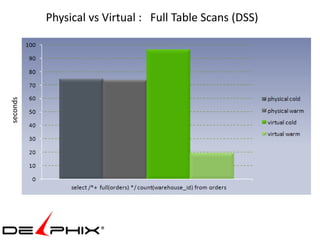
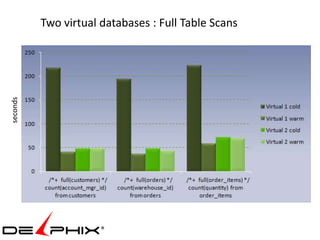
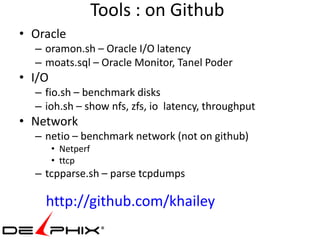
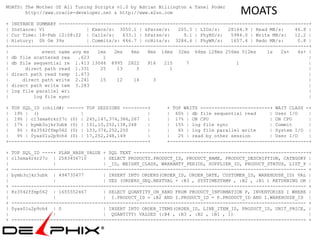
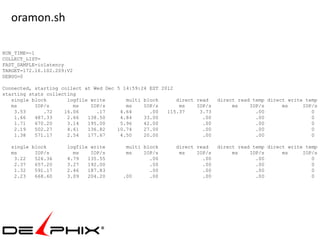
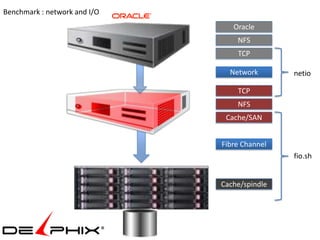
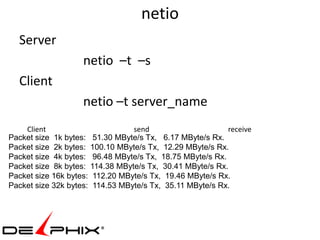
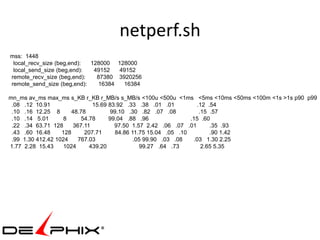
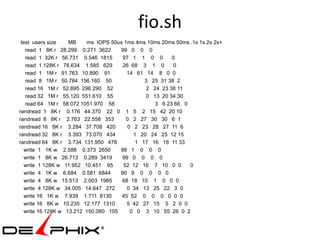
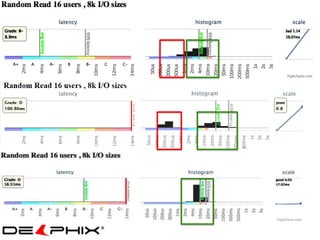
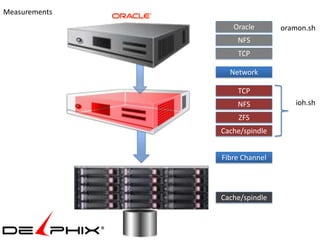
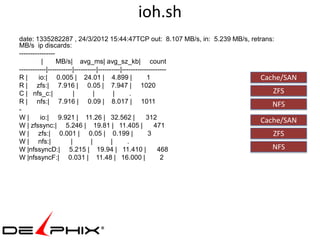
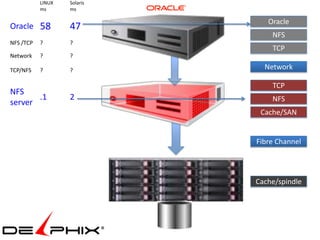
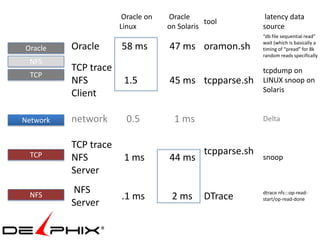
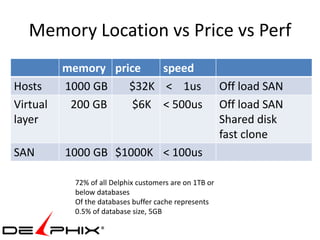
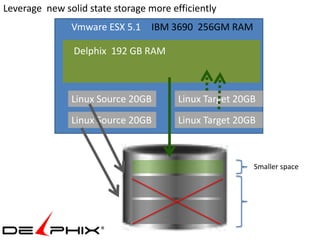
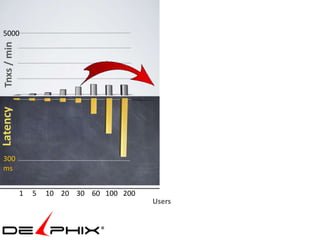
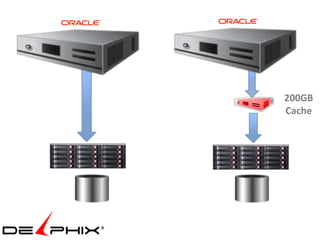
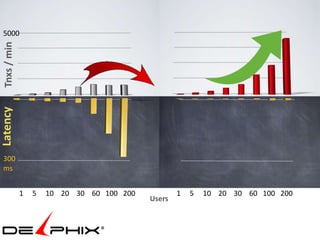
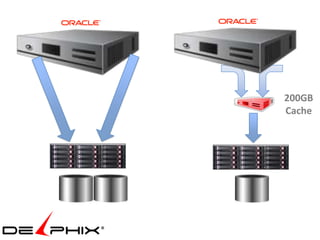

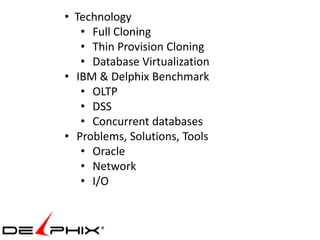
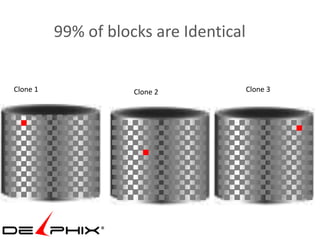
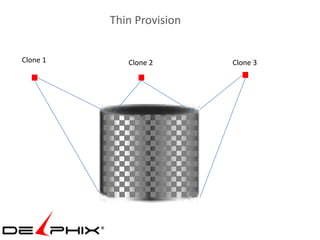
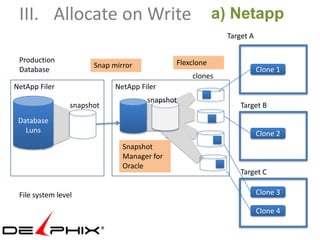
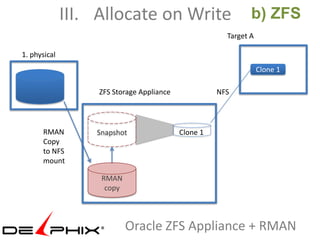
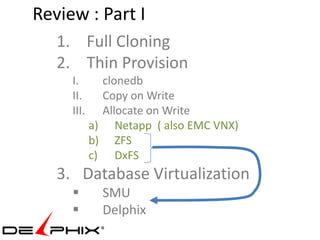
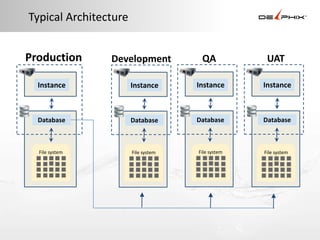
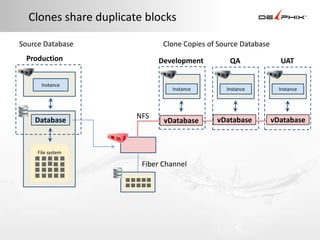
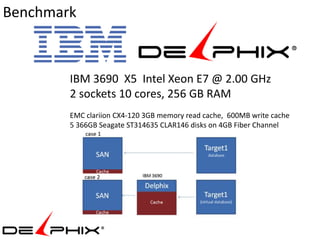
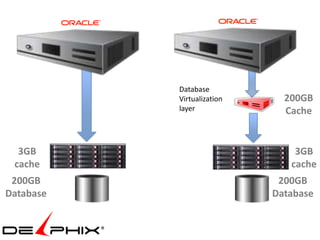
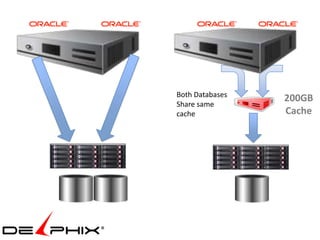
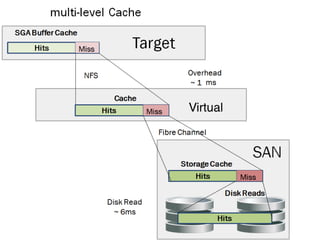
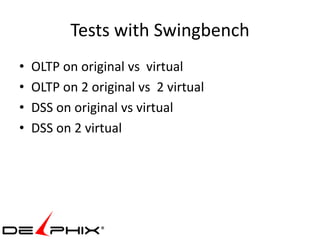
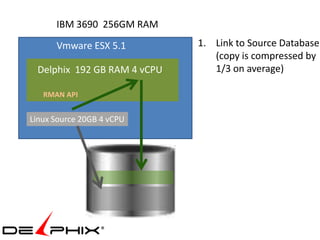
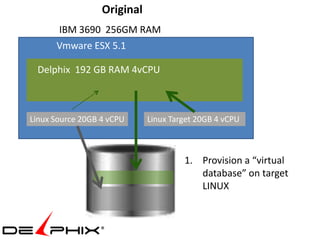
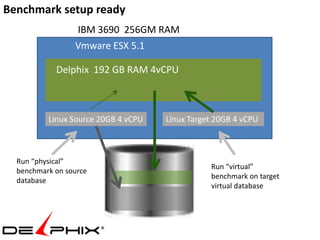
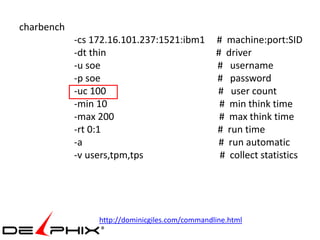
The document summarizes performance testing of database virtualization using Delphix. It describes: 1) Benchmarking OLTP and DSS workloads on original vs virtualized databases, finding similar performance. 2) Testing 2 concurrent original databases vs 2 virtualized databases sharing blocks, again with similar results. 3) Tools for monitoring database, storage, and network performance including scripts for Oracle I/O profiling (oramon.sh) and benchmarking disks and network throughput (fio.sh and netio).


![Oracle Open World 2014: Lies, Damned Lies, and I/O Statistics [ CON3671]](https://cdn.slidesharecdn.com/ss_thumbnails/thursday115ionfs-141107125307-conversion-gate02-thumbnail.jpg?width=640&height=640&fit=bounds)


