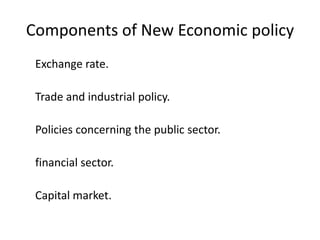
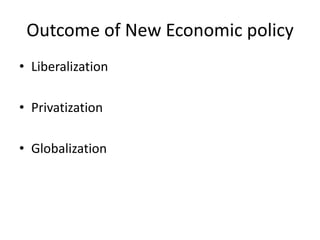
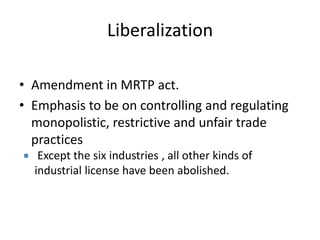
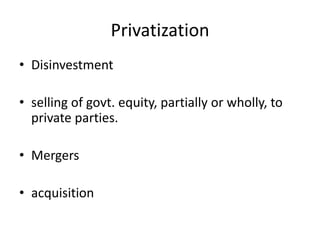
Is post 1991 economic
development in India
skewed ???
Presented By:-
Swapnilkumar Pawar (13253)
"When you're already
at the bottom of the pit,
all you can do is go
up."
Why new Economic Policy 1991 ?
• The Indian currency, the rupee, was
inconvertible and high tariffs and import
licensing prevented foreign goods reaching
the market.
• India also operated a system of central
planing for the economy, in which firms
required licenses to invest and develop.
• Restriction on Private Investment
• Socialism
• Mixed Economy
Internal debt liability increased to 53% of GDP.
Why new Economic Policy 1991
The Economic Indicators
• Since 1991, India's GDP has quadrupled, its forex reserves have surged
from $5.8 billion to $279 billion, and exports from $18 billion to $178
billion.
• The change in our lives and lifestyles is a lot more fascinating. Back in
1991, owning a Maruti 800 (Rs 1.48 lakh in Delhi) was a middle- class
status symbol.
• Scooters like Bajaj Chetak and Lambretta accounted for more than half of
the two-wheelers sold in the country.
• A bottle of soft drink, be it desi versions like Gold Spot or Thumps Up, cost
just Rs 4.50.
• Today, we are one of the consumption engines of the world as we are
guzzling colas, downloading music on our iPads and zipping around in our
sedans.
• The cola market is worth about Rs 10,000 cr, up from just Rs 200 cr in
1991.
Features of the new policy
• Integration with world economy with.
dismantling of tariff wall.
• Protection of foreign direct investment.
• upgrading the technology of production.
• Financial stability.
• Outward looking policies.
• Deregulation of domestic market.
Features of the new policy
– Correcting the disequilibrium in foreign exchange
market through demand reduction.
– Reform in trade policy
– Reduction in fiscal deficit
– Dismantling of barrier to free flow of capital.
– Depreciation of exchange rate.
The following steps were taken:
- In a brilliant political move, he instituted Dr Manmohan Singh (an economist rather than a
politician) as Finance Minister, and began India's Economic Reform (New India) by first
devaluing the Rupee
- Industrial de-licensing followed shortly afterward. Industrialists could finally breathe free of
the License Raj.
- The MRTP Act (that protected businesses from monopolies) was reformed and India could
finally be on the path to producing competitive and productive industries
- Gradual reduction of import duties followed, allowing foreign investments to slowly start
flowing in. More clearance was given to capital goods
- Slowly, taxes were lowered (income and corporate taxes) and Foreign Technology
Agreements started getting signed
- In cities where the population was less than a million, they didn't even need Government
permits for industries
- The threats of massive layoffs were avoided by legislating judiciously and exercising
regulations carefully
Components of New Economic policy
Exchange rate.
Trade and industrial policy.
Policies concerning the public sector.
financial sector.
Capital market.
Outcome of New Economic policy
• Liberalization
• Privatization
• Globalization
Liberalization
• Amendment in MRTP act.
• Emphasis to be on controlling and regulating
monopolistic, restrictive and unfair trade
practices
 Except the six industries , all other kinds of
industrial license have been abolished.
Privatization
• Disinvestment
• selling of govt. equity, partially or wholly, to
private parties.
• Mergers
• acquisition
Globalization
• Outsourcing
• Reduction in trade barriers.
• Free flow of technology
• Free movement of labor capital among different
countries.
Effect of new economic policy
(positive)
• Increase in GDP growth rate
• Increase in foreign direct investment
• Increase in foreign exchange
 Fulfilled a long-felt demand of the corporate sector
for declaring in very clear terms that licensing was
abolished for all industries except 18 industries
which included coal, petroleum, sugar, motor cars,
cigarettes, hazardous, chemicals, pharmaceuticals
and some luxury items
Effect of new economic policy
(positive)
• Increase in per capita income
• Increase in foreign
trade.(Import,Export,FDI,FII,Merger )
• Increase mobility of factor of production
• Outsourcing
Effect of new economic policy
(negative)
• Growing unemployment
• Neglect of agriculture
• Growing personal disparities
• Infrastructural inadequacies
• Wide spread poverty.
Effect of new economic policy
(negative)
• Demonstration effect (luxury goods)
• Indian small scale industries badly affected
 Failure of MRTP to break the monopolistic or
Oligopolistic character of the Indian market
The Negative side
• Faster growth has not reduced poverty as much as it should have done
• Growth has not created sufficient number of high quality jobs to satisfy the
aspirations of our increasingly educated youths.
• Growth has not been as regionally balanced as it should have been.
• The deficiencies in social development indicators such as primary
education, primary health care, safe drinking water, nutrition, sanitation,
etc., have also continued to exist.
• The low level of social development is affecting the country's economic
development.
• Woefully lacking in providing basic services such as healthcare, education,
safe drinking water, etc.
• The Gini coefficient, which measures income
inequality across households, has gone up from 25.8
in 1993-94 to 28.8 in 2009-10 in rural areas and from
31.9 in 1993.94 to 38.3 in 2009-10 in urban areas.
• The number of absolute poor in India has declined
only marginally from 404.9 m in 1993-94 to 397 m in
2009-10.
• The average rate of employment generation during
this period has been a meagre 1.3% per annum.
• During the last five years the rate of employment
growth has been the lowest at 0.2% .per annum
Share Of Services Sector In GDP
28.0
23.8 20.5
27.2
40.6 43.9
48.9
52.4
32.2 28.1
27.2 27.1
0
10
20
30
40
50
60
1990-91 1995-96 2000-01 2004-05
Agriculture Industry Services
Economic Scenario : Post Policy
India - One of the fastest growing economies in the world
• Average GDP growth (1995 -2005) : 6.2 % per annum
• Average annual growth (1995 - 2005)
Agriculture & Allied :+ 2.1 % per annum
Industry :+ 6.6 % per annum
Services : + 7.8 % per annum
• Average Per Capita Income growth (1995 - 2005): 3.8 % per annum
• Inflation down to a single digit level continuously for the last ten years
• Foreign exchange reserves increased from US $ 2 b (March 1991)
» to US $ 145 b (September 2005)
• Merchandise Exports : +20 % average rate of growth in last three years
• Booming Services Exports from US $ 4.6 b in 1990-91 to US $ 51.3 b in
» 2004-05
Economic Scenario : Post Policy
• Balance of Payments surplus (US $ 26 b in 2004 - 05)
• External Debt Service Ratio down from 26.2 % in 1995 to 6.2 % in
2005
• Foreign Direct Investment (FDI) : Average +US $ 5 b pa in the last
» five years.
• Foreign Portfolio Investment : US $ 11.4 b in 2003-04 and
» US $ 8.9 b in 2004-05
• Reforms continuing and have unleashed dynamic forces –
» putting the economy on a trajectory of unparalleled economic
» growth in the future
THANK YOU!

Is post 1991 Economic Development In India skewed?

  • 1.
    Is post 1991economic development in India skewed ??? Presented By:- Swapnilkumar Pawar (13253)
  • 2.
    "When you're already atthe bottom of the pit, all you can do is go up."
  • 3.
    Why new EconomicPolicy 1991 ? • The Indian currency, the rupee, was inconvertible and high tariffs and import licensing prevented foreign goods reaching the market. • India also operated a system of central planing for the economy, in which firms required licenses to invest and develop.
  • 4.
    • Restriction onPrivate Investment • Socialism • Mixed Economy Internal debt liability increased to 53% of GDP. Why new Economic Policy 1991
  • 5.
    The Economic Indicators •Since 1991, India's GDP has quadrupled, its forex reserves have surged from $5.8 billion to $279 billion, and exports from $18 billion to $178 billion. • The change in our lives and lifestyles is a lot more fascinating. Back in 1991, owning a Maruti 800 (Rs 1.48 lakh in Delhi) was a middle- class status symbol. • Scooters like Bajaj Chetak and Lambretta accounted for more than half of the two-wheelers sold in the country. • A bottle of soft drink, be it desi versions like Gold Spot or Thumps Up, cost just Rs 4.50. • Today, we are one of the consumption engines of the world as we are guzzling colas, downloading music on our iPads and zipping around in our sedans. • The cola market is worth about Rs 10,000 cr, up from just Rs 200 cr in 1991.
  • 6.
    Features of thenew policy • Integration with world economy with. dismantling of tariff wall. • Protection of foreign direct investment. • upgrading the technology of production. • Financial stability. • Outward looking policies. • Deregulation of domestic market.
  • 7.
    Features of thenew policy – Correcting the disequilibrium in foreign exchange market through demand reduction. – Reform in trade policy – Reduction in fiscal deficit – Dismantling of barrier to free flow of capital. – Depreciation of exchange rate.
  • 8.
    The following stepswere taken: - In a brilliant political move, he instituted Dr Manmohan Singh (an economist rather than a politician) as Finance Minister, and began India's Economic Reform (New India) by first devaluing the Rupee - Industrial de-licensing followed shortly afterward. Industrialists could finally breathe free of the License Raj. - The MRTP Act (that protected businesses from monopolies) was reformed and India could finally be on the path to producing competitive and productive industries - Gradual reduction of import duties followed, allowing foreign investments to slowly start flowing in. More clearance was given to capital goods - Slowly, taxes were lowered (income and corporate taxes) and Foreign Technology Agreements started getting signed - In cities where the population was less than a million, they didn't even need Government permits for industries - The threats of massive layoffs were avoided by legislating judiciously and exercising regulations carefully
  • 9.
    Components of NewEconomic policy Exchange rate. Trade and industrial policy. Policies concerning the public sector. financial sector. Capital market.
  • 10.
    Outcome of NewEconomic policy • Liberalization • Privatization • Globalization
  • 11.
    Liberalization • Amendment inMRTP act. • Emphasis to be on controlling and regulating monopolistic, restrictive and unfair trade practices  Except the six industries , all other kinds of industrial license have been abolished.
  • 12.
    Privatization • Disinvestment • sellingof govt. equity, partially or wholly, to private parties. • Mergers • acquisition
  • 13.
    Globalization • Outsourcing • Reductionin trade barriers. • Free flow of technology • Free movement of labor capital among different countries.
  • 14.
    Effect of neweconomic policy (positive) • Increase in GDP growth rate • Increase in foreign direct investment • Increase in foreign exchange  Fulfilled a long-felt demand of the corporate sector for declaring in very clear terms that licensing was abolished for all industries except 18 industries which included coal, petroleum, sugar, motor cars, cigarettes, hazardous, chemicals, pharmaceuticals and some luxury items
  • 15.
    Effect of neweconomic policy (positive) • Increase in per capita income • Increase in foreign trade.(Import,Export,FDI,FII,Merger ) • Increase mobility of factor of production • Outsourcing
  • 16.
    Effect of neweconomic policy (negative) • Growing unemployment • Neglect of agriculture • Growing personal disparities • Infrastructural inadequacies • Wide spread poverty.
  • 17.
    Effect of neweconomic policy (negative) • Demonstration effect (luxury goods) • Indian small scale industries badly affected  Failure of MRTP to break the monopolistic or Oligopolistic character of the Indian market
  • 18.
    The Negative side •Faster growth has not reduced poverty as much as it should have done • Growth has not created sufficient number of high quality jobs to satisfy the aspirations of our increasingly educated youths. • Growth has not been as regionally balanced as it should have been. • The deficiencies in social development indicators such as primary education, primary health care, safe drinking water, nutrition, sanitation, etc., have also continued to exist. • The low level of social development is affecting the country's economic development. • Woefully lacking in providing basic services such as healthcare, education, safe drinking water, etc.
  • 19.
    • The Ginicoefficient, which measures income inequality across households, has gone up from 25.8 in 1993-94 to 28.8 in 2009-10 in rural areas and from 31.9 in 1993.94 to 38.3 in 2009-10 in urban areas. • The number of absolute poor in India has declined only marginally from 404.9 m in 1993-94 to 397 m in 2009-10. • The average rate of employment generation during this period has been a meagre 1.3% per annum. • During the last five years the rate of employment growth has been the lowest at 0.2% .per annum
  • 20.
    Share Of ServicesSector In GDP 28.0 23.8 20.5 27.2 40.6 43.9 48.9 52.4 32.2 28.1 27.2 27.1 0 10 20 30 40 50 60 1990-91 1995-96 2000-01 2004-05 Agriculture Industry Services
  • 21.
    Economic Scenario :Post Policy India - One of the fastest growing economies in the world • Average GDP growth (1995 -2005) : 6.2 % per annum • Average annual growth (1995 - 2005) Agriculture & Allied :+ 2.1 % per annum Industry :+ 6.6 % per annum Services : + 7.8 % per annum • Average Per Capita Income growth (1995 - 2005): 3.8 % per annum • Inflation down to a single digit level continuously for the last ten years • Foreign exchange reserves increased from US $ 2 b (March 1991) » to US $ 145 b (September 2005) • Merchandise Exports : +20 % average rate of growth in last three years • Booming Services Exports from US $ 4.6 b in 1990-91 to US $ 51.3 b in » 2004-05
  • 22.
    Economic Scenario :Post Policy • Balance of Payments surplus (US $ 26 b in 2004 - 05) • External Debt Service Ratio down from 26.2 % in 1995 to 6.2 % in 2005 • Foreign Direct Investment (FDI) : Average +US $ 5 b pa in the last » five years. • Foreign Portfolio Investment : US $ 11.4 b in 2003-04 and » US $ 8.9 b in 2004-05 • Reforms continuing and have unleashed dynamic forces – » putting the economy on a trajectory of unparalleled economic » growth in the future
  • 27.