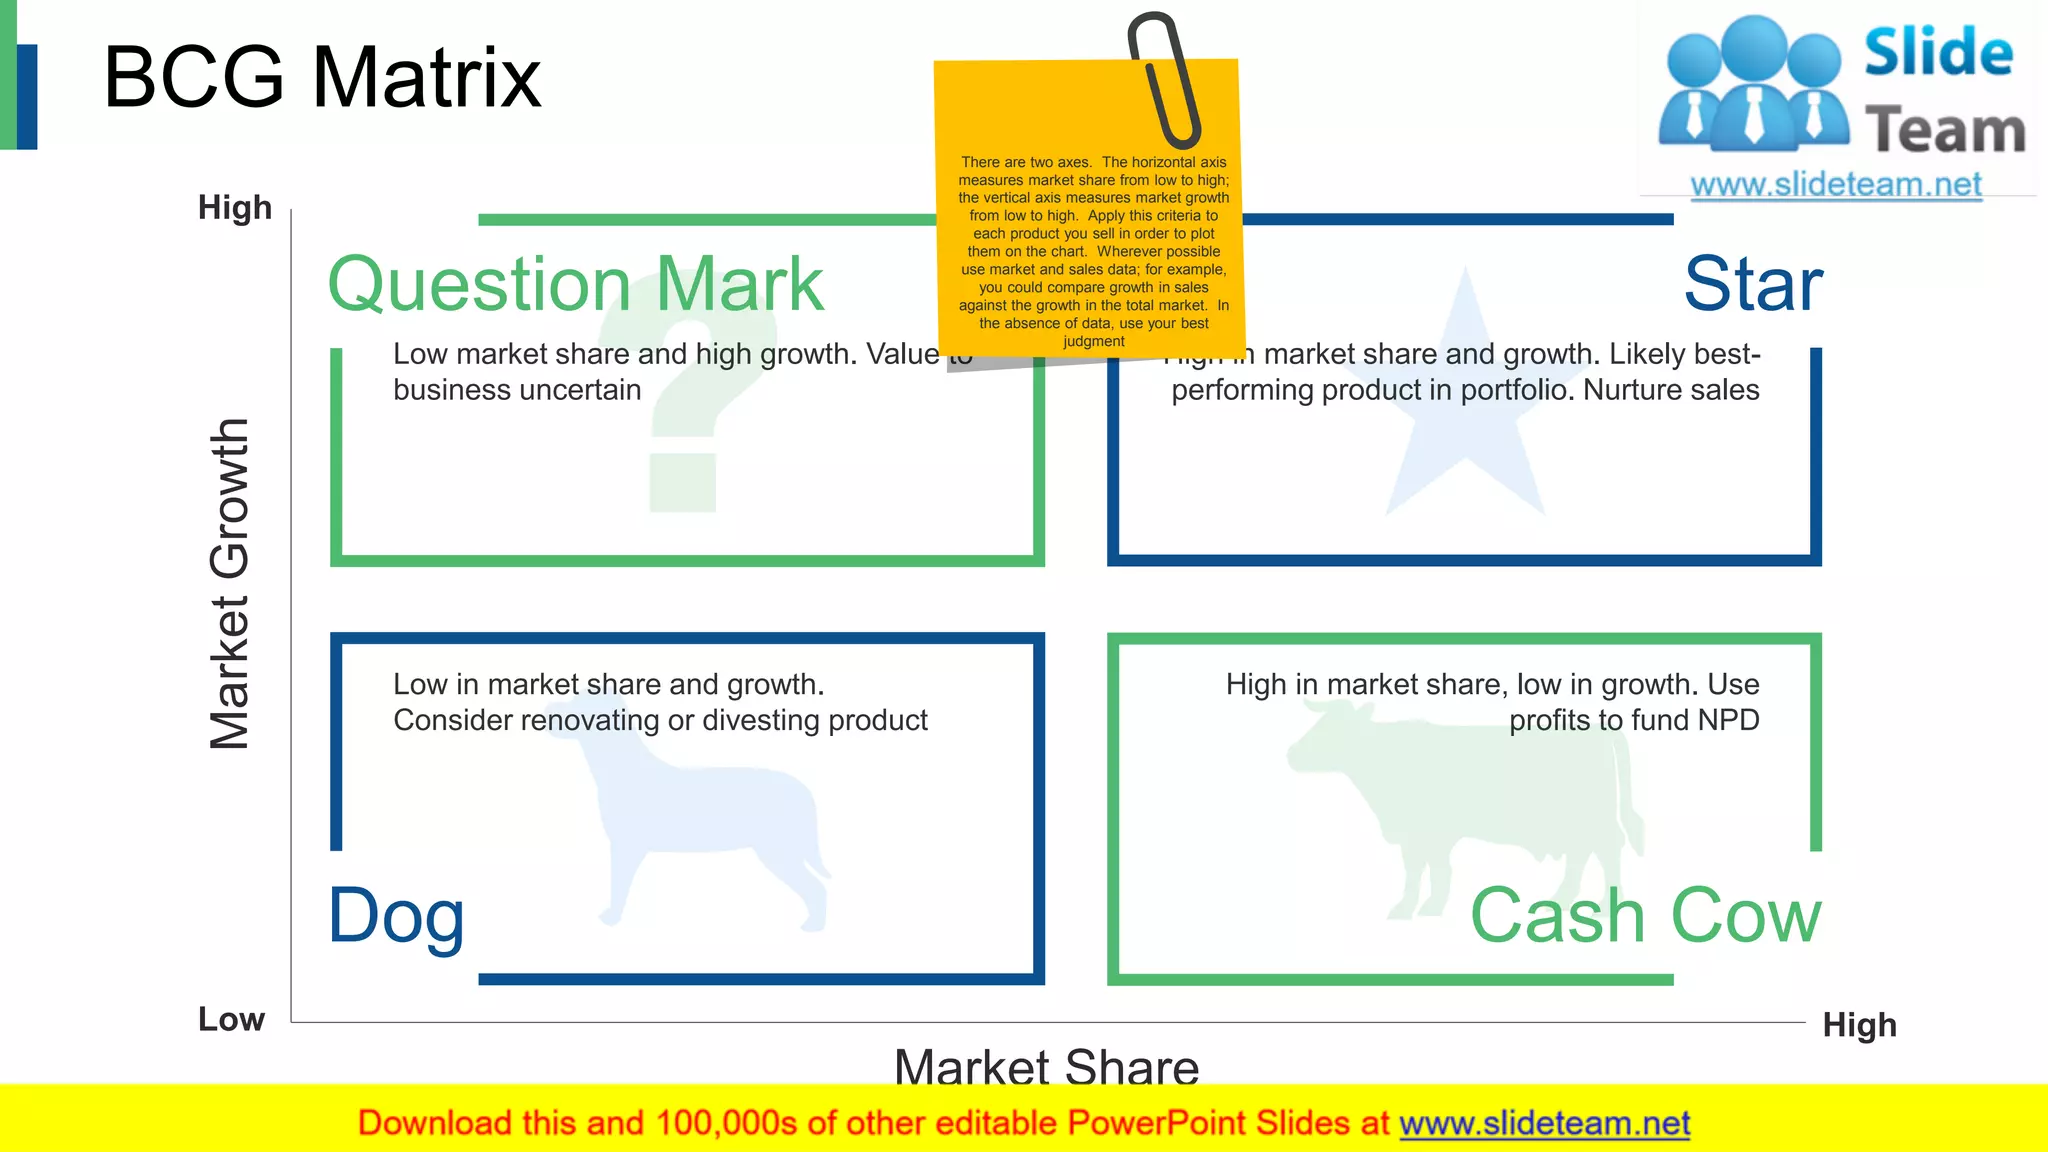
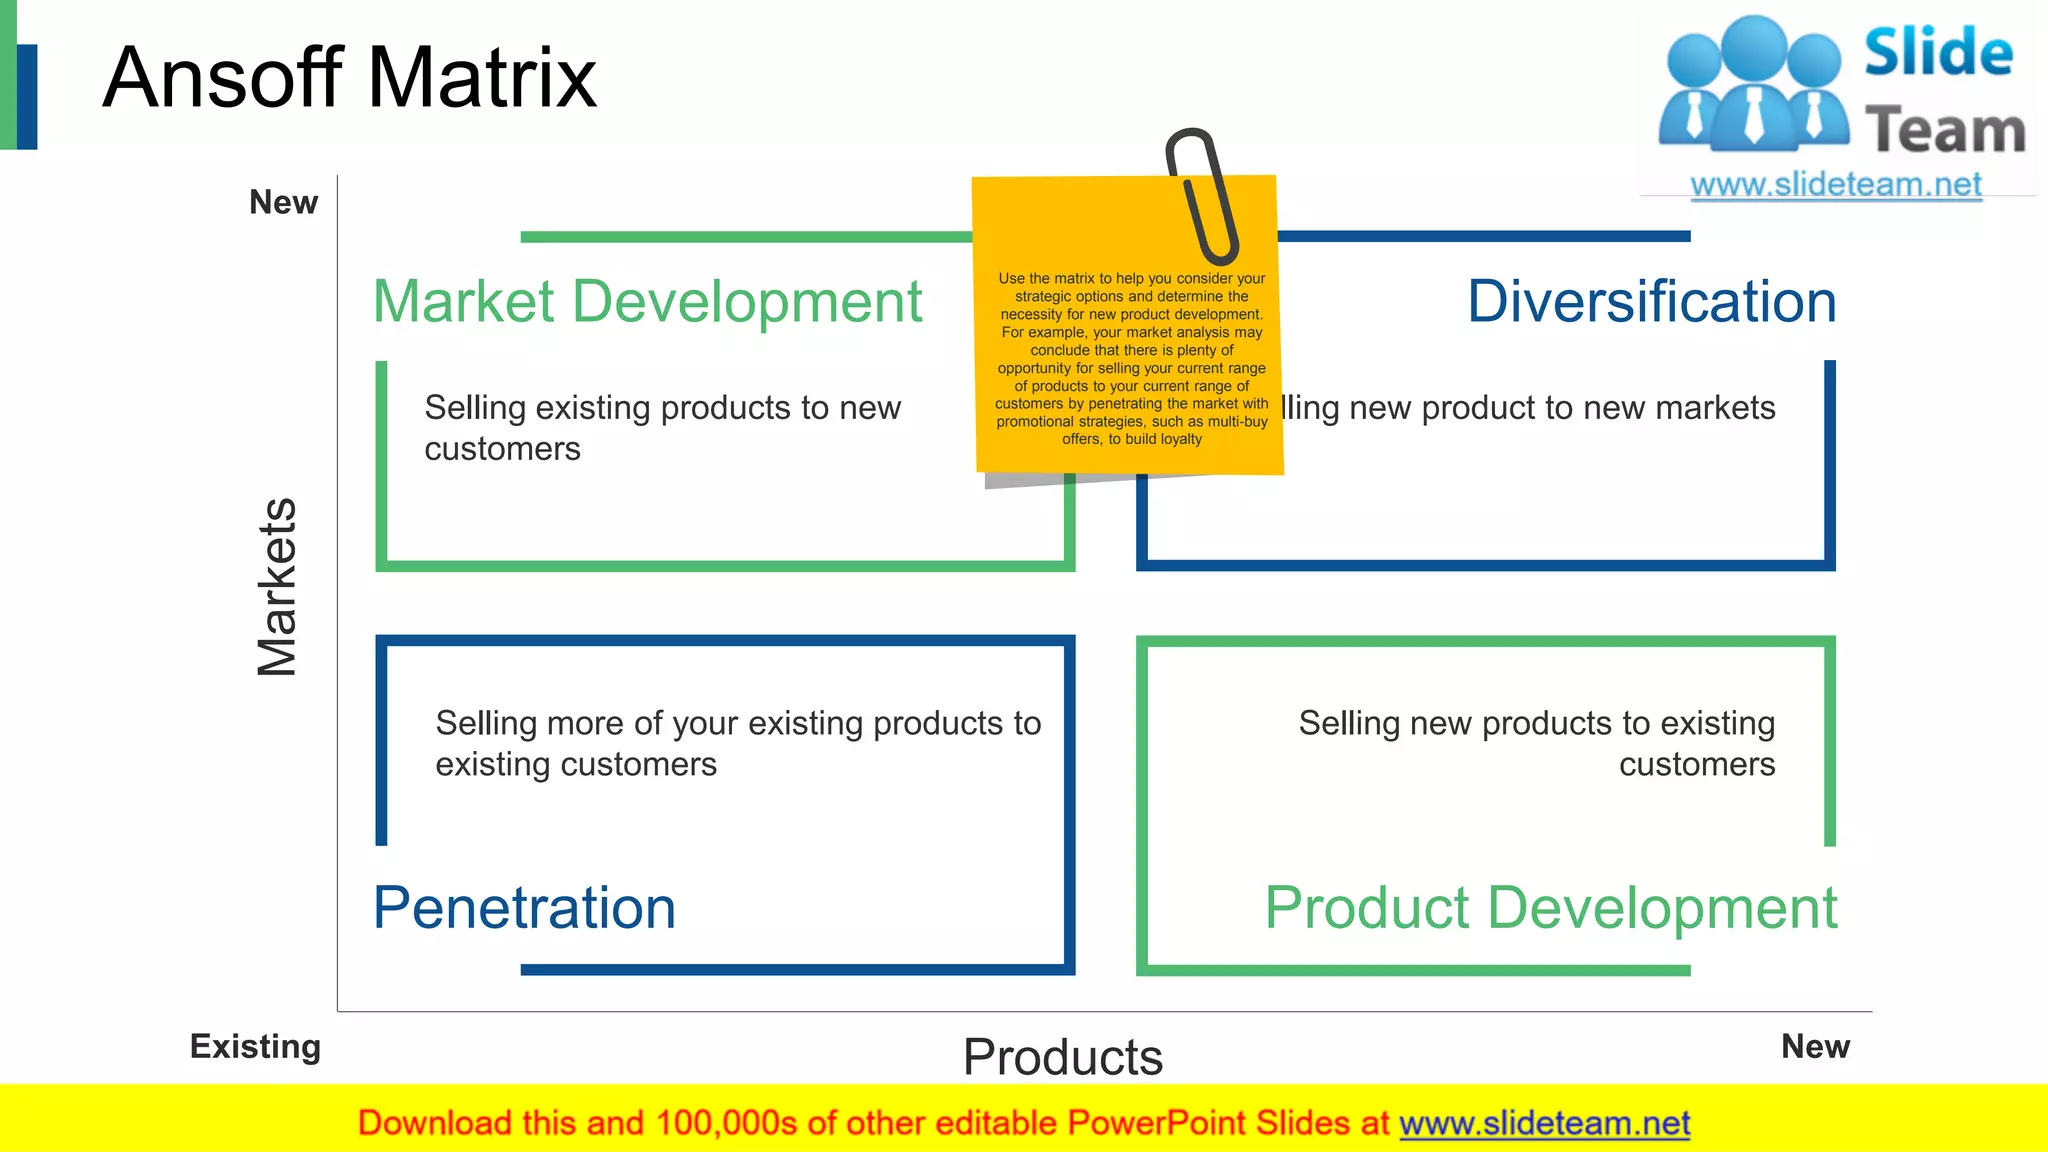
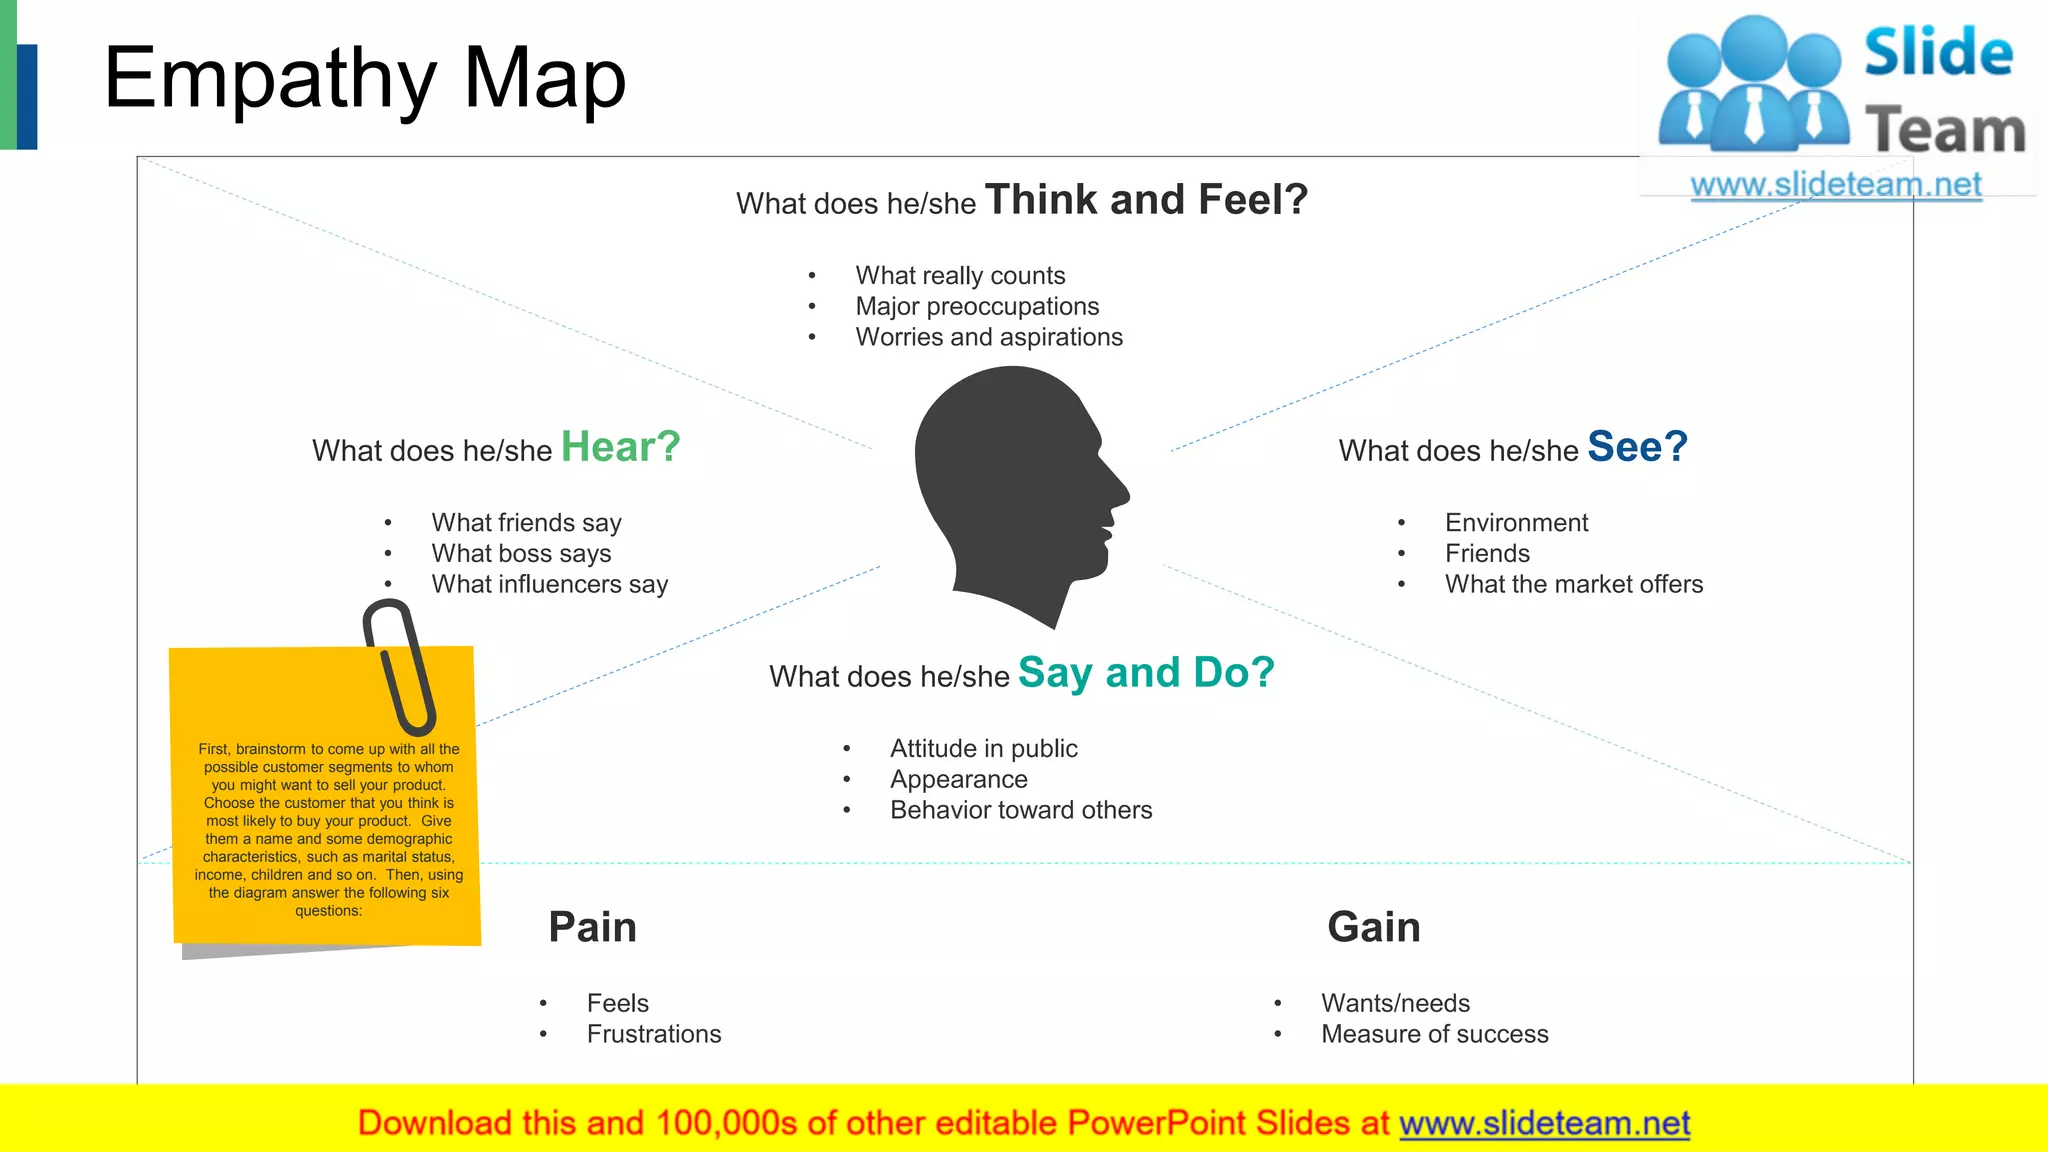
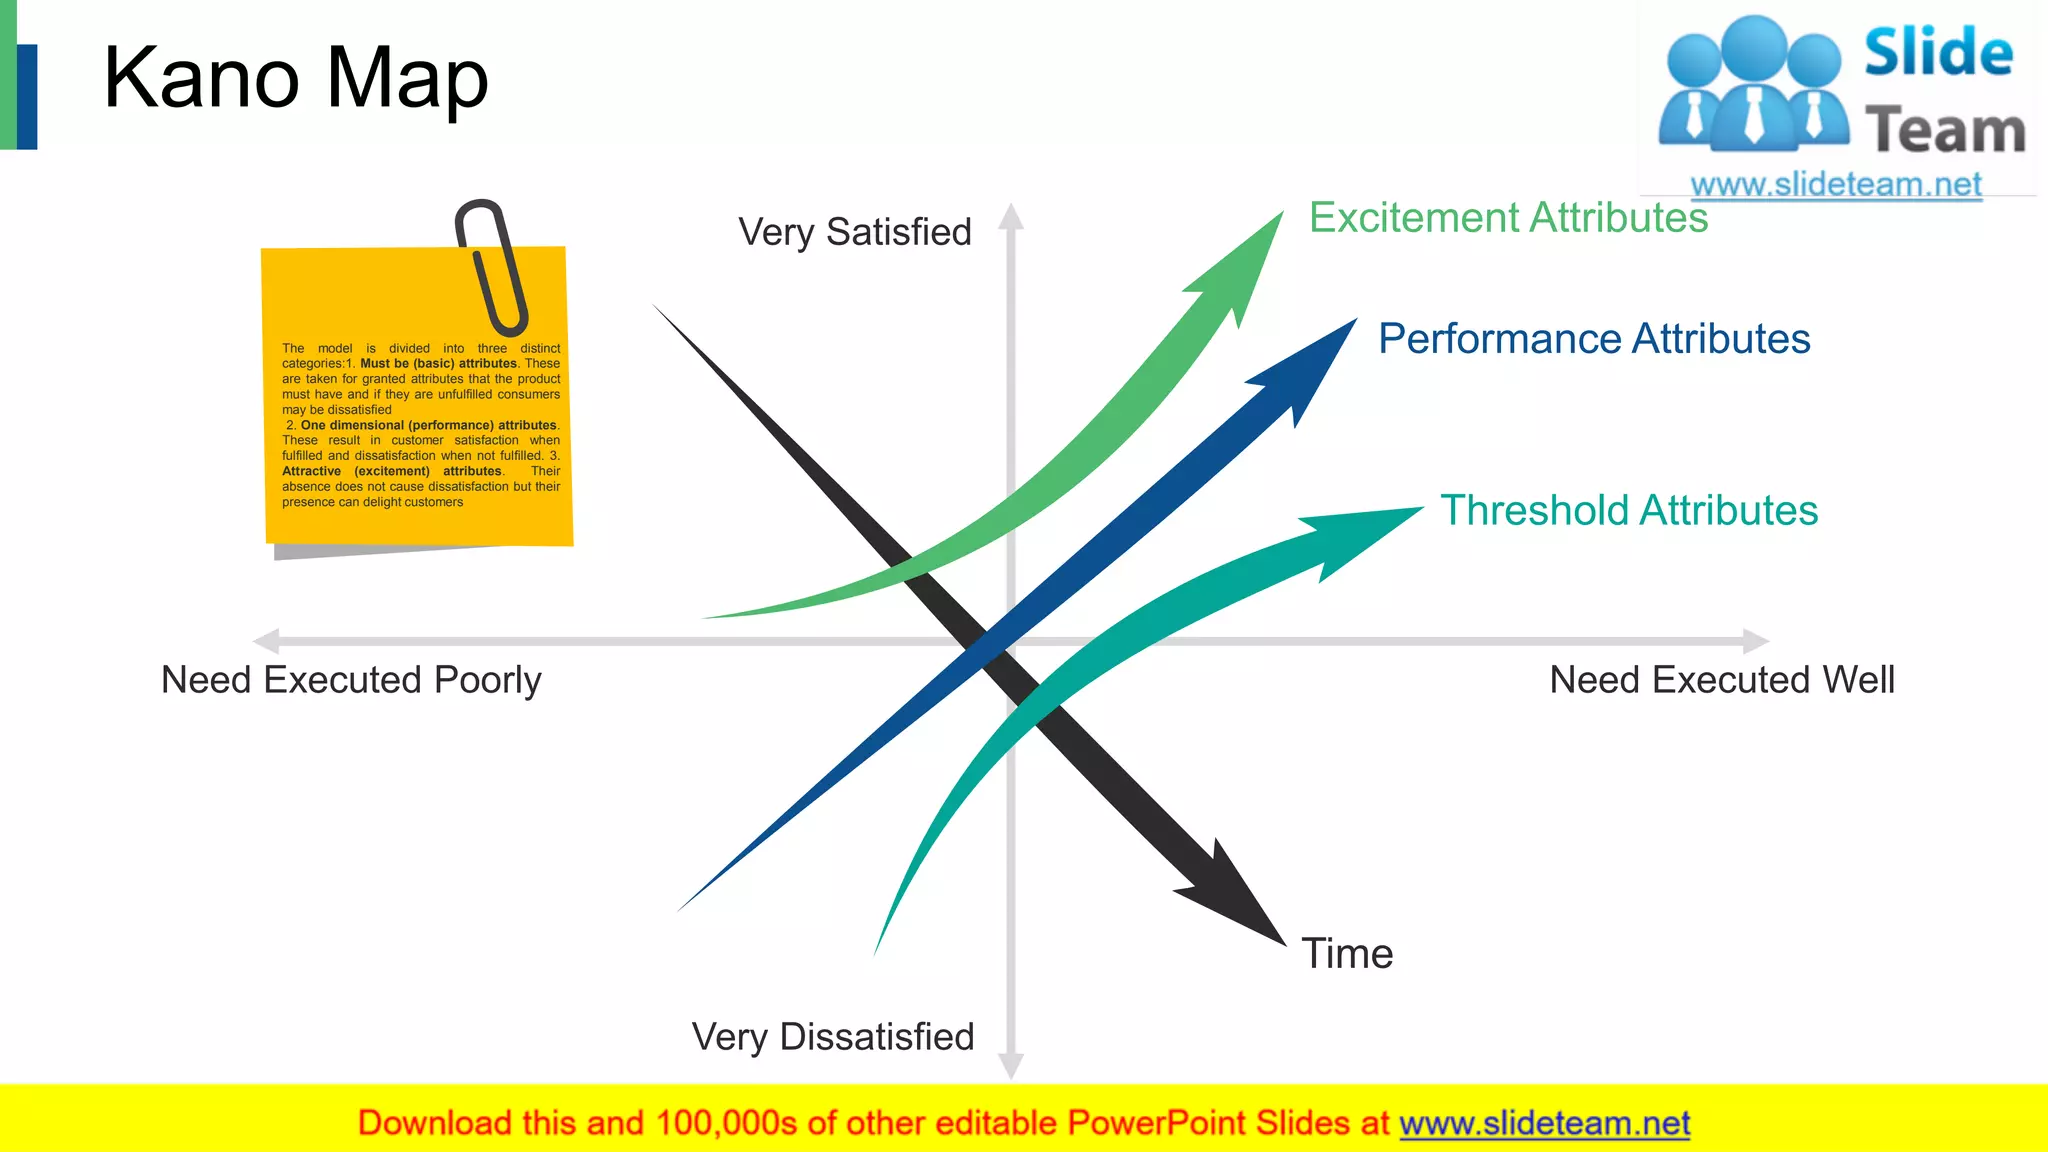
New Product
Development Tools &
Techniques
Your Company Name
BCG Matrix
HighLow
Market Share
High
MarketGrowth
Low market share and high growth. Value to
business uncertain
Question Mark
Low in market share and growth.
Consider renovating or divesting product
Dog
High in market share and growth. Likely best-
performing product in portfolio. Nurture sales
Star
High in market share, low in growth. Use
profits to fund NPD
Cash Cow
There are two axes. The horizontal axis
measures market share from low to high;
the vertical axis measures market growth
from low to high. Apply this criteria to
each product you sell in order to plot
them on the chart. Wherever possible
use market and sales data; for example,
you could compare growth in sales
against the growth in the total market. In
the absence of data, use your best
judgment
2
Ansoff Matrix
Selling existing products to new
customers
Market Development
Selling more of your existing products to
existing customers
Penetration
Selling new product to new markets
Diversification
Selling new products to existing
customers
Product Development
New
NewExisting Products
Markets
3
Use the matrix to help you consider your
strategic options and determine the
necessity for new product development.
For example, your market analysis may
conclude that there is plenty of
opportunity for selling your current range
of products to your current range of
customers by penetrating the market with
promotional strategies, such as multi-buy
offers, to build loyalty
Empathy Map
What does he/she See?
• Environment
• Friends
• What the market offers
What does he/she Think and Feel?
• What really counts
• Major preoccupations
• Worries and aspirations
What does he/she Say and Do?
• Attitude in public
• Appearance
• Behavior toward others
What does he/she Hear?
• What friends say
• What boss says
• What influencers say
Pain
• Feels
• Frustrations
Gain
• Wants/needs
• Measure of success
4
First, brainstorm to come up with all the
possible customer segments to whom
you might want to sell your product.
Choose the customer that you think is
most likely to buy your product. Give
them a name and some demographic
characteristics, such as marital status,
income, children and so on. Then, using
the diagram answer the following six
questions:
Kano Map
Need Executed Poorly Need Executed Well
Very Satisfied
Very Dissatisfied
Excitement Attributes
Performance Attributes
Time
Threshold Attributes
5
The model is divided into three distinct
categories:1. Must be (basic) attributes. These
are taken for granted attributes that the product
must have and if they are unfulfilled consumers
may be dissatisfied
2. One dimensional (performance) attributes.
These result in customer satisfaction when
fulfilled and dissatisfaction when not fulfilled. 3.
Attractive (excitement) attributes. Their
absence does not cause dissatisfaction but their
presence can delight customers
Coffee Break
We Back In 10 Minutes
• This slide is 100% editable. Adapt it to your needs and
capture your audience's attention.
• This slide is 100% editable. Adapt it to your needs and
capture your audience's attention.
• This slide is 100% editable. Adapt it to your needs and
capture your audience's attention.
6
Charts &
Graphs
7
Line Chart
8
0
10
20
30
40
50
60
70
80
FY' 11 FY' 12 FY' 13 FY' 14 FY' 15 FY' 16 FY' 17 FY' 18
SalesInPercentage(%)
Financial Years
• Product 01
This graph/chart is linked to excel, and
changes automatically based on data. Just
left click on it and select “Edit Data”.
• Product 02
This graph/chart is linked to excel, and
changes automatically based on data. Just
left click on it and select “Edit Data”.
Radar Chart
0
5
10
15
20
25
30
35
03-05-2018
05-05-2018
08-05-2018
12-04-2018
15-05-2018
17-05-2018
• Product 01
This graph/chart is linked to excel, and
changes automatically based on data. Just
left click on it and select “Edit Data”.
• Product 02
This graph/chart is linked to excel, and
changes automatically based on data. Just
left click on it and select “Edit Data”.
9
Additional
Slides
10
11
This slide is 100% editable. Adapt it to your needs
and capture your audience's attention.
Mission
This slide is 100% editable. Adapt it to your needs
and capture your audience's attention.
Goal
This slide is 100% editable. Adapt it to your needs
and capture your audience's attention.
Vision
Our Mission
This slide is 100% editable. Adapt
it to your needs and capture your
audience's attention.
Professional
This slide is 100% editable. Adapt
it to your needs and capture your
audience's attention.
Talented
This slide is 100% editable. Adapt
it to your needs and capture your
audience's attention.
Creative
About Us
12
Meet Our Team
13
Name Here
Designation
This slide is 100% editable.
Adapt it to your needs and
capture your audience's
attention.
Name Here
Designation
This slide is 100% editable.
Adapt it to your needs and
capture your audience's
attention.
Name Here
Designation
This slide is 100% editable.
Adapt it to your needs and
capture your audience's
attention.
Idea
Vision
Success
This slide is 100% editable. Adapt it to your needs
and capture your audience's attention.
This slide is 100% editable. Adapt it to your needs
and capture your audience's attention.
This slide is 100% editable. Adapt it to your needs
and capture your audience's attention.
Our Goal
14
Financial
50%
01
62%
02
71%
03
86%
04
2018
This slide is 100%
editable. Adapt it to your
needs and capture your
audience's attention.
2017
This slide is 100%
editable. Adapt it to your
needs and capture your
audience's attention.
2016
This slide is 100%
editable. Adapt it to your
needs and capture your
audience's attention.
2015
This slide is 100%
editable. Adapt it to your
needs and capture your
audience's attention.
15
Magnifying Glass
• This slide is 100% editable. Adapt it to your needs and
capture your audience's attention.
• This slide is 100% editable. Adapt it to your needs and
capture your audience's attention.
• This slide is 100% editable. Adapt it to your needs and
capture your audience's attention.
• This slide is 100% editable. Adapt it to your needs and
capture your audience's attention.
16
Bulb Or Idea
This slide is 100% editable. Adapt it to
your needs and capture your
audience's attention.
Product A
This slide is 100% editable. Adapt it to
your needs and capture your
audience's attention.
Product B
This slide is 100% editable. Adapt it to
your needs and capture your
audience's attention.
Product C
17
Email Address:
emailaddress123@gmail.com
Contact Numbers:
0123456789
Address:
# street number, city, state
Thank
You
18

New Product Development Tools And Techniques PowerPoint Presentation Slides

  • 1.
    New Product Development Tools& Techniques Your Company Name
  • 2.
    BCG Matrix HighLow Market Share High MarketGrowth Lowmarket share and high growth. Value to business uncertain Question Mark Low in market share and growth. Consider renovating or divesting product Dog High in market share and growth. Likely best- performing product in portfolio. Nurture sales Star High in market share, low in growth. Use profits to fund NPD Cash Cow There are two axes. The horizontal axis measures market share from low to high; the vertical axis measures market growth from low to high. Apply this criteria to each product you sell in order to plot them on the chart. Wherever possible use market and sales data; for example, you could compare growth in sales against the growth in the total market. In the absence of data, use your best judgment 2
  • 3.
    Ansoff Matrix Selling existingproducts to new customers Market Development Selling more of your existing products to existing customers Penetration Selling new product to new markets Diversification Selling new products to existing customers Product Development New NewExisting Products Markets 3 Use the matrix to help you consider your strategic options and determine the necessity for new product development. For example, your market analysis may conclude that there is plenty of opportunity for selling your current range of products to your current range of customers by penetrating the market with promotional strategies, such as multi-buy offers, to build loyalty
  • 4.
    Empathy Map What doeshe/she See? • Environment • Friends • What the market offers What does he/she Think and Feel? • What really counts • Major preoccupations • Worries and aspirations What does he/she Say and Do? • Attitude in public • Appearance • Behavior toward others What does he/she Hear? • What friends say • What boss says • What influencers say Pain • Feels • Frustrations Gain • Wants/needs • Measure of success 4 First, brainstorm to come up with all the possible customer segments to whom you might want to sell your product. Choose the customer that you think is most likely to buy your product. Give them a name and some demographic characteristics, such as marital status, income, children and so on. Then, using the diagram answer the following six questions:
  • 5.
    Kano Map Need ExecutedPoorly Need Executed Well Very Satisfied Very Dissatisfied Excitement Attributes Performance Attributes Time Threshold Attributes 5 The model is divided into three distinct categories:1. Must be (basic) attributes. These are taken for granted attributes that the product must have and if they are unfulfilled consumers may be dissatisfied 2. One dimensional (performance) attributes. These result in customer satisfaction when fulfilled and dissatisfaction when not fulfilled. 3. Attractive (excitement) attributes. Their absence does not cause dissatisfaction but their presence can delight customers
  • 6.
    Coffee Break We BackIn 10 Minutes • This slide is 100% editable. Adapt it to your needs and capture your audience's attention. • This slide is 100% editable. Adapt it to your needs and capture your audience's attention. • This slide is 100% editable. Adapt it to your needs and capture your audience's attention. 6
  • 7.
  • 8.
    Line Chart 8 0 10 20 30 40 50 60 70 80 FY' 11FY' 12 FY' 13 FY' 14 FY' 15 FY' 16 FY' 17 FY' 18 SalesInPercentage(%) Financial Years • Product 01 This graph/chart is linked to excel, and changes automatically based on data. Just left click on it and select “Edit Data”. • Product 02 This graph/chart is linked to excel, and changes automatically based on data. Just left click on it and select “Edit Data”.
  • 9.
    Radar Chart 0 5 10 15 20 25 30 35 03-05-2018 05-05-2018 08-05-2018 12-04-2018 15-05-2018 17-05-2018 • Product01 This graph/chart is linked to excel, and changes automatically based on data. Just left click on it and select “Edit Data”. • Product 02 This graph/chart is linked to excel, and changes automatically based on data. Just left click on it and select “Edit Data”. 9
  • 10.
  • 11.
    11 This slide is100% editable. Adapt it to your needs and capture your audience's attention. Mission This slide is 100% editable. Adapt it to your needs and capture your audience's attention. Goal This slide is 100% editable. Adapt it to your needs and capture your audience's attention. Vision Our Mission
  • 12.
    This slide is100% editable. Adapt it to your needs and capture your audience's attention. Professional This slide is 100% editable. Adapt it to your needs and capture your audience's attention. Talented This slide is 100% editable. Adapt it to your needs and capture your audience's attention. Creative About Us 12
  • 13.
    Meet Our Team 13 NameHere Designation This slide is 100% editable. Adapt it to your needs and capture your audience's attention. Name Here Designation This slide is 100% editable. Adapt it to your needs and capture your audience's attention. Name Here Designation This slide is 100% editable. Adapt it to your needs and capture your audience's attention.
  • 14.
    Idea Vision Success This slide is100% editable. Adapt it to your needs and capture your audience's attention. This slide is 100% editable. Adapt it to your needs and capture your audience's attention. This slide is 100% editable. Adapt it to your needs and capture your audience's attention. Our Goal 14
  • 15.
    Financial 50% 01 62% 02 71% 03 86% 04 2018 This slide is100% editable. Adapt it to your needs and capture your audience's attention. 2017 This slide is 100% editable. Adapt it to your needs and capture your audience's attention. 2016 This slide is 100% editable. Adapt it to your needs and capture your audience's attention. 2015 This slide is 100% editable. Adapt it to your needs and capture your audience's attention. 15
  • 16.
    Magnifying Glass • Thisslide is 100% editable. Adapt it to your needs and capture your audience's attention. • This slide is 100% editable. Adapt it to your needs and capture your audience's attention. • This slide is 100% editable. Adapt it to your needs and capture your audience's attention. • This slide is 100% editable. Adapt it to your needs and capture your audience's attention. 16
  • 17.
    Bulb Or Idea Thisslide is 100% editable. Adapt it to your needs and capture your audience's attention. Product A This slide is 100% editable. Adapt it to your needs and capture your audience's attention. Product B This slide is 100% editable. Adapt it to your needs and capture your audience's attention. Product C 17
  • 18.