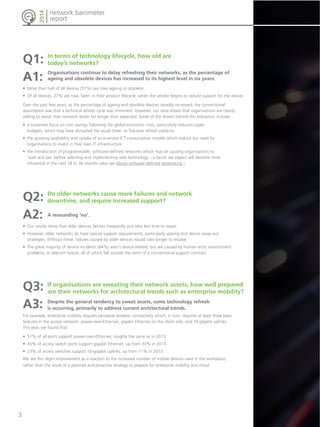
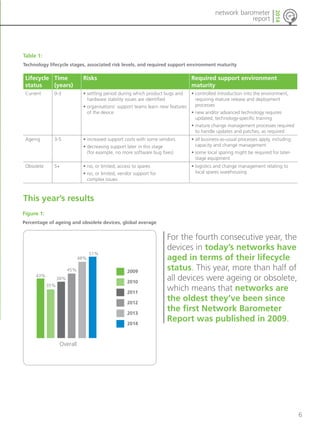
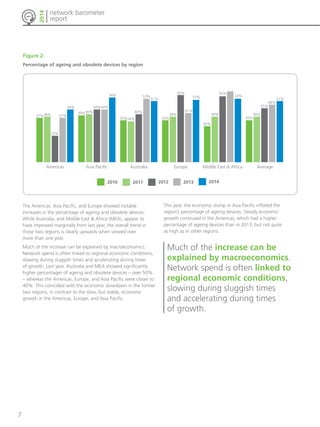
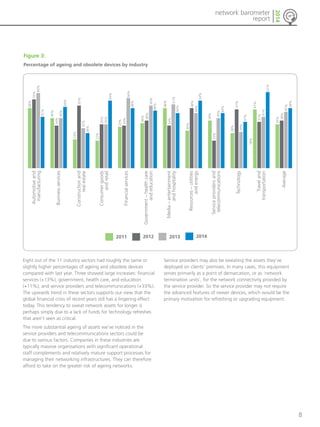
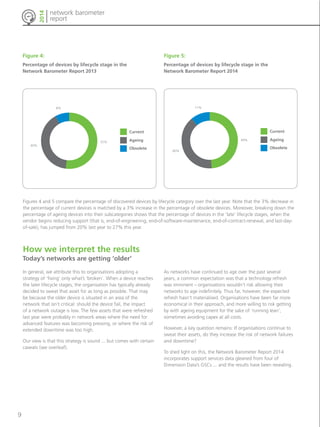
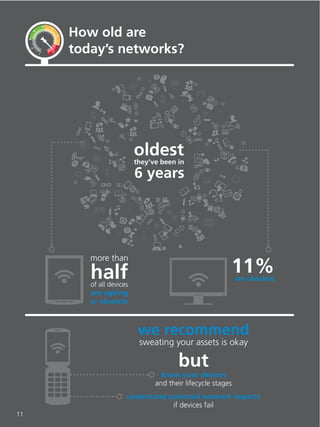
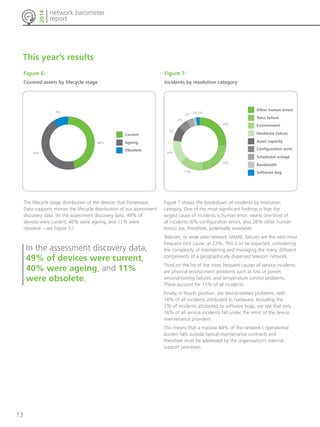
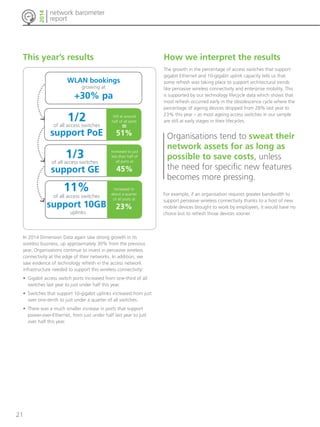
Network 
Barometer 
Report 
2014 
A gauge of global networks’ readiness to accelerate business
About 
Dimension Data 
Founded in 1983, Dimension Data plc is a global ICT services and solutions 
provider that uses its technology expertise, global service delivery capability, and 
entrepreneurial spirit to accelerate the business ambitions of its clients. Dimension 
Data is a member of the NTT Group. It has designed, built and manage over 9,000 
networks worldwide to enable more than 13 million users to connect to their 
organisations’ networks. Dimension Data has delivered over 1,400 Technology 
Lifecycle Management Assessments to date. 
The Network Barometer Report can be downloaded at: 
www.dimensiondata.com/networkbarometer 
Copyright notice and disclaimer 
© Dimension Data 2009–2014 
Copyright and rights in databases subsist in this work. Any unauthorised copying, reproduction or other dealing in this work, or any part 
thereof, without the prior written consent of the copyright owner is an act of copyright infringement. Copying of certain portions of this 
work, such as tables, graphs, and certain extracts is permissible subject to the condition that (1) such portions do not constitute a substantial 
reproduction of the work (or a section) as a whole, and (2) the following notice accompanies all such portions: ‘Dimension Data Network 
Barometer Report 2014, © Dimension Data 2009–2014’. Any unauthorised copying, communication to the public, reproduction, or other 
dealings in this work, or any part thereof, renders the person who is responsible for such acts liable for civil law copyright infringement and, 
under certain circumstances, liable to criminal prosecution. All rights of the copyright owner are reserved. 
The data and information contained in the Network Barometer Report are for information purposes only. While the commentary and 
hypotheses in this Report are based on rigorous data analysis and market experience, the content also contains opinion. Furthermore, while 
reasonable steps are taken to ensure the accuracy and integrity of the data and information provided, Dimension Data accepts no liability 
or responsibility whatsoever if such data or information is incorrect or inaccurate, for whatsoever reason. Dimension Data does not accept 
liability for any claims, loss or damages of any nature, arising as a result of the reliance on, or use of, such data or information by any 
individual or organisation.
network barometer 
report 
2014 
Table 
of contents 
Executive summary 2 
Results 5 
Question 1: Technology lifecycle – how old are today’s networks? 5 
This year’s results 6 
How we interpret the results 9 
Summary 11 
Question 2: Service incidents – do older networks cause more 
failures and require increased support? 12 
This year’s results 13 
How we interpret the results 17 
Summary 18 
Question 3: Technology type – are today’s networks prepared 
for architectural trends such as cloud and enterprise mobility? 19 
This year’s results 21 
How we interpret the results 21 
Summary 22 
Recommendations 23 
Appendix A – sample distribution 25 
Appendix B – services data 30
network barometer 
report 
2014 
About the 
Network Barometer Report 2014 
1 2 3 
a larger 
sample size 
288 
technology 
assessments 
spread across regions 
74,000 
devices 
See Appendix A for detailed breakdown. 
more evenly 
and industries 
5 
regions 
32 
countries 
11 
industries 
Technology data gathered from: 
Support services data gathered from: 
4 Global Service Centres in 
new support 
services data 
Boston Frankfurt Bangalore Johannesburg 
91,000 
service 
incidents 
1
2 
network barometer 
report 
2014 
Proof that network success depends 
as much (and perhaps more) 
on operational support capabilities 
as on technology. 
In this year’s Network Barometer Report, 
we’ve incorporated data gathered from 
Dimension Data’s Global Service Centres (GSCs). 
This information relates to support service 
requests – or ‘incidents’ – logged against client 
devices under Dimension Data’s management. 
When combined with the network discovery 
data gathered from our Technology Lifecycle 
Management Assessments, it provides a 
multidimensional view of networks today. 
In interpreting the results, Dimension Data has brought its 
strategic focus on ICT services and extensive experience in 
maintaining, supporting, managing, and outsourcing its clients’ 
networks to bear on the Report’s goal: to gauge the readiness 
of today’s networks to accelerate business. Our findings may be 
viewed by some as controversial. 
Our overall conclusion: 
The great majority of service incidents are not related to 
network devices. In addition, maintenance requirements for 
these devices vary depending on their lifecycle stage. The most 
important requirement for the network to successfully 
support business is therefore a mature set of operational 
tools and processes. 
We’ve reached this conclusion by asking ourselves three 
searching questions. These were answered by analyses and 
interpretation of the data sets, which are captured in more 
detail in the rest of this Report.
network barometer 
report 
2014 
Q1: 
In terms of technology lifecycle, how old are 
today’s networks? 
A1: 
Organisations continue to delay refreshing their networks, as the percentage of 
ageing and obsolete devices has increased to its highest level in six years: 
• More than half of all devices (51%) are now ageing or obsolete. 
• Of all devices, 27% are now ‘later’ in their product lifecycle, when the vendor begins to reduce support for the device. 
Over the past few years, as the percentage of ageing and obsolete devices steadily increased, the conventional 
assumption was that a technical refresh cycle was imminent. However, our data shows that organisations are clearly 
willing to sweat their network assets for longer than expected. Some of the drivers behind this behaviour include: 
• a sustained focus on cost savings following the global economic crisis, particularly reduced capex 
budgets, which may have disrupted the usual three- to five-year refresh patterns 
• the growing availability and uptake of as-a-service ICT consumption models which reduce the need for 
organisations to invest in their own IT infrastructure 
• the introduction of programmable, software-defined networks which may be causing organisations to 
‘wait and see’ before selecting and implementing new technology – a factor we expect will become more 
influential in the next 18 to 36 months (also see About software-defined networking.) 
Q2: 
Do older networks cause more failures and network 
downtime, and require increased support? 
A2: 
A resounding ‘no’. 
• Our results show that older devices fail less frequently and take less time to repair. 
• However, older networks do have special support requirements, particularly sparing and device swap-out 
strategies. Without these, failures caused by older devices would take longer to resolve. 
• The great majority of service incidents (84%) aren’t device-related, but are caused by human error, environment 
problems, or telecom failure, all of which fall outside the remit of a conventional support contract. 
Q3: 
A3: 
For example, enterprise mobility requires pervasive wireless connectivity which, in turn, requires at least three basic 
features in the access network: power-over-Ethernet, gigabit Ethernet on the client side, and 10-gigabit uplinks. 
This year, we found that: 
• 51% of all ports support power-over-Ethernet, roughly the same as in 2013. 
• 45% of access switch ports support gigabit Ethernet, up from 33% in 2013. 
• 23% of access switches support 10-gigabit uplinks, up from 11% in 2013. 
We see this slight improvement as a reaction to the increased number of mobile devices used in the workplace, 
rather than the result of a planned and proactive strategy to prepare for enterprise mobility and cloud. 
If organisations are sweating their network assets, how well prepared 
are their networks for architectural trends such as enterprise mobility? 
Despite the general tendency to sweat assets, some technology refresh 
is occurring, primarily to address current architectural trends. 
3
4 
network barometer 
report 
2014 
What we recommend 
We know that it’s good to sweat network assets some of the 
time, the question is: when? Given the financial and operational 
benefits of older devices, such as lower failure rates and shorter 
time to repair, organisations can choose to sweat their assets 
for as long as possible, subject to organisational standards and 
compliance policies. However, they must also have a mature 
set of operational tools and processes in place, including sparing 
strategies for obsolete equipment, to support greater 
network availability as vendor support diminishes during 
later lifecycle stages. 
The benefits of sweating assets notwithstanding, organisations 
must make sure that their networks can accommodate 
important architectural trends such as enterprise mobility 
and cloud computing, as these advancements will provide 
significant competitive advantage. However, upgrading 
networks to support these developments again puts pressure on 
internal IT support, as newer devices are more susceptible 
to service incidents. 
The single most important thing 
organisations can do to ensure 
their networks are able to 
support business is to invest in 
their operational support tools 
and processes. 
For more advice on how to implement this Report’s findings 
in your organisation, see our Recommendations. 
About the Network 
Barometer Report 
The Network Barometer Report 2014 presents 
the aggregate data gathered from Dimension 
Data’s Technology Lifecycle Management 
Assessments conducted for clients around the 
world in 2013. It also contains data relating to 
service incidents, logged at our Global Service 
Centres, for client networks that we support. 
Dimension Data compiles, analyses, compares, 
and interprets the data in order to gauge 
the readiness of today’s networks to 
accelerate business.
network barometer 
report 
2014 
Results 
Question 1: 
Technology lifecycle – how old are today’s networks? 
About 
technology lifecycles 
In order to establish the age and viability of 
technology assets, most vendors have standardised 
milestones through which they progress their 
products towards obsolescence. For example, Cisco 
uses six technology lifecycle milestones. These run 
from future-end-of-sale, the announcement of the 
lifecycle milestone dates, to last-day-of-support, the 
date after which Cisco’s Technical Assistance Center 
will no longer support the product. Common to all 
vendors are end-of-sale and end-of-support. 
To normalise the data for this report, we’ve defined 
three lifecycle categories: 
• Current 
These devices are presently shipping and have full 
access to vendor support services. 
• Ageing 
Vendors have announced that these devices 
are past end-of-sale. They’ve not yet passed 
end-of-support, but vendor support is 
increasingly limited. 
• Obsolete 
These devices are past end-of-support. 
Table 1 lists these three categories, and the 
maintenance and support requirements typical 
of each. 
About the Technology Lifecycle 
Management Assessment 
This ICT assessment service from Dimension Data 
discovers installed assets on the network, identifies 
their lifecycle statuses, determines maintenance 
coverage, and flags potential security vulnerabilities. 
The Assessment assists organisations to align their IT 
infrastructure with best practices for configuration, 
security, and patch management, thereby ensuring 
that they’re not exposing themselves to unnecessary 
risk. The technology lifecycle data used in this Report 
comes from these automated Assessments, not from 
a survey. Click here for more information. 
5
6 
network barometer 
report 
2014 
Table 1: 
Technology lifecycle stages, associated risk levels, and required support environment maturity 
Lifecycle 
Time 
status 
(years) 
Risks Required support environment 
maturity 
Current 0-3 • settling period during which product bugs and 
hardware stability issues are identified 
• organisations’ support teams learn new features 
of the device 
• controlled introduction into the environment, 
requiring mature release and deployment 
processes 
• new and/or advanced technology requires 
updated, technology-specific training 
• mature change management processes required 
to handle updates and patches, as required 
Ageing 3-5 • increased support costs with some vendors 
• decreasing support later in this stage 
(for example, no more software bug fixes) 
• all business-as-usual processes apply, including 
capacity and change management 
• some local sparing might be required for later-stage 
equipment 
Obsolete 5+ • no, or limited, access to spares 
• no, or limited, vendor support for 
complex issues 
• logistics and change management relating to 
local spares warehousing 
Figure 1: 
Percentage of ageing and obsolete devices, global average 
For the fourth consecutive year, the 
devices in today’s networks have 
aged in terms of their lifecycle 
status. This year, more than half of 
all devices were ageing or obsolete, 
which means that networks are 
the oldest they’ve been since 
the first Network Barometer 
Report was published in 2009. 
Overall 
35% 
38% 
45% 
48% 
51% 
43% 
2009 
2010 
2011 
2012 
2013 
2014 
This year’s results
7 
37%22% 
37% 
network barometer 
report 
2014 
35%34% 
Americas Asia Australia Europe Middle East & Africa Overall 
Figure 2: 
Percentage of ageing and obsolete devices by region 
2010 2011 2012 2013 2014 
35% 
30% 
35% 
40% 
38% 
59% 
38% 
48% 
Americas Asia Pacific Australia Europe Middle East & Africa Average 
2010 2011 2012 2013 2014 
37%38% 
22% 
37% 
44% 
39%40% 
44%44% 
54% 
35%34% 
53% 
51% 
35% 
56% 
41% 
52% 
30% 
38% 
55% 
53% 
35% 
45% 
51% 
The Americas, Asia Pacific, and Europe showed notable 
increases in the percentage of ageing and obsolete devices. 
While Australia, and Middle East & Africa (MEA), appear to 
have improved marginally from last year, the overall trend in 
those two regions is clearly upwards when viewed over 
more than one year. 
Much of the increase can be explained by macroeconomics. 
Network spend is often linked to regional economic conditions, 
slowing during sluggish times and accelerating during times 
of growth. Last year, Australia and MEA showed significantly 
higher percentages of ageing and obsolete devices – over 50% 
– whereas the Americas, Europe, and Asia Pacific were closer to 
40%. This coincided with the economic slowdown in the former 
two regions, in contrast to the slow, but stable, economic 
growth in the Americas, Europe, and Asia Pacific. 
This year, the economic slump in Asia Pacific inflated the 
region’s percentage of ageing devices. Steady economic 
growth continued in the Americas, which had a higher 
percentage of ageing devices than in 2013, but not quite 
as high as in other regions. 
Much of the increase can be 
explained by macroeconomics. 
Network spend is often linked to 
regional economic conditions, 
slowing during sluggish times 
and accelerating during times 
of growth.
8 
network barometer 
report 
2014 
Figure 3: 
Percentage of ageing and obsolete devices by industry 
Resources – utilities 
and hospitality 
and energy 
Media – entertainment 
and education 
54% 
2011 2012 2013 2014 
48% 
55% 
60% 
41% 
Eight out of the 11 industry sectors had roughly the same or 
slightly higher percentages of ageing and obsolete devices 
compared with last year. Three showed large increases: financial 
services (+13%); government, health care, and education 
(+11%); and service providers and telecommunications (+33%). 
The upwards trend in these sectors supports our view that the 
global financial crisis of recent years still has a lingering effect 
today. This tendency to sweat network assets for longer is 
perhaps simply due to a lack of funds for technology refreshes 
that aren’t seen as critical. 
The more substantial ageing of assets we’ve noticed in the 
service providers and telecommunications sectors could be 
due to various factors. Companies in these industries are 
typically massive organisations with significant operational 
staff complements and relatively mature support processes for 
managing their networking infrastructures. They can therefore 
afford to take on the greater risk of ageing networks. 
Average 
Travel and 
transportation 
Technology 
Service providers and 
telecommunications 
Service providers may also be sweating the assets they’ve 
deployed on clients’ premises. In many cases, this equipment 
serves primarily as a point of demarcation, or as ‘network 
termination units’, for the network connectivity provided by 
the service provider. So the service provider may not require 
the advanced features of newer devices, which would be the 
primary motivation for refreshing or upgrading equipment. 
36% 
38% 
Government – health care 
33% 
34% 
22% 
Financial services 
Consumer goods 
35% 
35% 
Business services 
and retail 
23% 
Automotive and 
manufacturing 
Construction and 
50% 
40% 
real estate 
34% 
40% 
49% 
32% 
28% 
54% 
56% 
48% 
50% 
46% 
48% 
34% 
51% 
44% 
30% 
48% 
44% 
38% 
22% 
40% 
44% 
28% 
47% 
29% 
37% 
18% 
47% 
37% 
41% 
61% 
35% 
38% 
45% 
48%
9 
network barometer 
report 
2014 
Figure 4: 
Percentage of devices by lifecycle stage in the 
Network Barometer Report 2013 
Figure 5: 
Percentage of devices by lifecycle stage in the 
Network Barometer Report 2014 
8% 
52% 
40% 
Current 
Ageing 
Obsolete 
11% 
49% 
40% 
Current 
Ageing 
Obsolete 
Figures 4 and 5 compare the percentage of discovered devices by lifecycle category over the last year. Note that the 3% decrease in 
the percentage of current devices is matched by a 3% increase in the percentage of obsolete devices. Moreover, breaking down the 
percentage of ageing devices into their subcategories shows that the percentage of devices in the ‘late’ lifecycle stages, when the 
vendor begins reducing support (that is, end-of-engineering, end-of-software-maintenance, end-of-contract-renewal, and last-day-of- 
sale), has jumped from 20% last year to 27% this year. 
How we interpret the results 
Today’s networks are getting ‘older’ 
In general, we attribute this to organisations adopting a 
strategy of ‘fixing’ only what’s ‘broken’. When a device reaches 
the later lifecycle stages, the organisation has typically already 
decided to sweat that asset for as long as possible. That may 
be because the older device is situated in an area of the 
network that isn’t critical: should the device fail, the impact 
of a network outage is low. The few assets that were refreshed 
last year were probably in network areas where the need for 
advanced features was becoming pressing, or where the risk of 
extended downtime was too high. 
Our view is that this strategy is sound ... but comes with certain 
caveats (see overleaf). 
As networks have continued to age over the past several 
years, a common expectation was that a technology refresh 
was imminent – organisations wouldn’t risk allowing their 
networks to age indefinitely. Thus far, however, the expected 
refresh hasn’t materialised. Organisations have been far more 
economical in their approach, and more willing to risk getting 
by with ageing equipment for the sake of ‘running lean’, 
sometimes avoiding capex at all costs. 
However, a key question remains: If organisations continue to 
sweat their assets, do they increase the risk of network failures 
and downtime? 
To shed light on this, the Network Barometer Report 2014 
incorporates support services data gleaned from four of 
Dimension Data’s GSCs ... and the results have been revealing.
10 
network barometer 
report 
2014 
Top tips to sweat 
your assets safely 
Have an accurate inventory of your entire 
network estate. 
Understand the function of each device and 
how critical it is to the network’s uptime. 
Know at which stage in their lifecycles these 
devices are. 
Have the appropriate operational support 
strategy in place to resolve any performance 
issues or outages that may occur, as vendor 
support will be either limited or unavailable 
during later lifecycle stages. 
Ensure that the device’s capabilities are not 
constraining architectural changes, which have 
driven upgrades in other areas of the network. 
Talk to us about how a Technology Lifecycle 
Management Assessment can give you a clear 
view of your networking estate, while an 
IT Support Assessment can help you ensure that 
your support systems and processes are the right 
fit for your organisation.
network barometer 
report 
2014 
11 
How old are 
today’s networks? 
oldest 
they’ve been in 
6 years 
more than 
half of all devices 
are ageing 
or obsolete 
11% 
are obsolete 
we recommend 
sweating your assets is okay 
but 
know your devices 
and their lifecycle stages 
understand potential network impacts 
if devices fail
network barometer 
report 
2014 
Question 2: Service incidents – do older networks cause 
more failures and require increased support? 
This year, we analysed over 91,000 service incidents – or 
‘trouble tickets’ – handled by Dimension Data’s GSCs. We 
wanted to understand the types of issues we’ve encountered 
while maintaining our clients’ networks, and how these issues 
relate to the device lifecycle data. (Please refer to Appendix A 
for detailed information and commentary on the sample size 
of our services data.) 
About 
Dimension Data’s GSCs 
Dimension Data’s GSCs are organisational hubs 
situated at eight central locations in five regions 
around the world: 
Americas: Boston, US; and Santiago, Chile 
Asia Pacific: Auckland, New Zealand; Bangalore, 
India; and Singapore 
Australia: Melbourne, Australia 
Europe: Frankfurt, Germany 
Middle East & Africa: Johannesburg, South Africa 
network barometer 
report 
2014 
12 
This year, we analysed 
over 91,000 service incidents – 
or ‘trouble tickets’ – handled by 
Dimension Data’s GSCs. 
At these Centres, Dimension Data’s service delivery and 
technical support experts receive calls from clients and 
resolve technical service tickets, requests, and problems in 
13 local languages (depending on the GSC’s location). 
The GSCs receive over a million such requests from 
10,000 clients every year – more than 2,500 incidents 
each day.
13 
network barometer 
report 
2014 
This year’s results 
Figure 6: 
Covered assets by lifecycle stage 
9% 
46% 
45% 
Current 
Ageing 
Obsolete 
The lifecycle stage distribution of the devices that Dimension 
Data supports mirrors the lifecycle distribution of our assessment 
discovery data. (In the assessment discovery data, 49% of 
devices were current, 40% were ageing, and 11% were 
obsolete – see Figure 5.) 
Figure 7: 
Incidents by resolution category 
26% 
22% 
4% 2%2% 
15% 
9% 
14% 
6% 
Other human errors 
Telco failure 
Environment 
Hardware failure 
Asset capacity 
Configuration error 
Scheduled outage 
Bandwidth 
Software bug 
Figure 7 shows the breakdown of incidents by resolution 
category. One of the most significant findings is that the 
largest cause of incidents is human error: nearly one-third of 
all incidents (6% configuration errors, plus 26% other human 
errors) are, therefore, potentially avoidable. 
Telecom, or wide area network (WAN), failures are the next most 
frequent root cause, at 22%. This is to be expected, considering 
the complexity of maintaining and managing the many different 
components of a geographically dispersed telecom network. 
Third on the list of the most frequent causes of service incidents 
are physical environment problems such as loss of power, 
airconditioning failures, and temperature control problems. 
These account for 15% of all incidents. 
Finally, in fourth position, are device-related problems, with 
14% of all incidents attributed to hardware. Including the 
2% of incidents attributed to software bugs, we see that only 
16% of all service incidents fall under the remit of the device 
maintenance providers. 
This means that a massive 84% of the network’s operational 
burden falls outside typical maintenance contracts and 
therefore must be addressed by the organisation’s internal 
support processes. 
In the assessment discovery data, 
49% of devices were current, 
40% were ageing, and 11% 
were obsolete.
14 
network barometer 
report 
2014 
Table 2: 
Percentage of devices by lifecycle stage by incident 
Lifecycle stage Asset % Incident % 
Current 46% 40% 
Ageing 45% 53% 
Obsolete 9% 7% 
As expected, there’s a correlation between incidents raised 
and the lifecycle stage of devices. For example, 46% of all 
devices under management were current, and caused 40% of 
all incidents. For the purposes of this analysis, Dimension Data 
filtered the data to show only hardware failures and software 
problems. All other incidents are caused by factors that can’t be 
regarded as device failures. 
Figure 8: 
Device failure rate by lifecycle stage 
4.14% 
Current 
Ageing 
Manufacturers generally target a hardware failure rate of 4% 
per annum. The 2014 data shows that the failure rate of the 
devices in Dimension Data’s maintenance base is indeed close to 
this level. 
One might expect the failure rate of obsolete devices to be 
higher than current or ageing devices, as obsolete devices are 
older and maintenance options are limited. However, this year’s 
analysis shows that the failure rate of obsolete devices is about a 
percentage point lower than either current or ageing devices. 
Figure 9: 
Mean-time-to-repair by lifecycle stage 
4.2% 
3.3% 3.4% 
2.7% 
Current 
Ageing 
Obsolete 
Average 
If obsolete devices are less likely to fail than current or ageing 
devices, how long would they take to repair should they fail? 
One might expect that older devices that fail would cause longer 
downtime than current or ageing devices. But, again, the results 
prove otherwise. 
Figure 9 shows that the average mean-time-to-repair for all 
devices is 3.4 hours. Current devices take about 48 minutes 
longer to repair than the average. Ageing devices take the 
shortest time to repair, about 42 minutes shorter than average. 
Obsolete devices take slightly longer to repair than ageing 
devices, at 3.3 hours, substantially less time than it takes to 
repair current devices. 
In summary, obsolete devices fail less often than current devices. 
And, when they do fail, problems are quicker to resolve: about 
an hour less than for current devices. 
In summary, obsolete devices 
fail less often than current 
devices. And, when they do fail, 
problems are quicker to resolve: 
about an hour less than for 
current devices. 
3.78% 
2.73% 
Obsolete
15 
network barometer 
report 
2014 
Cyberattack! How safe is your 
network? 
The Heartbleed security vulnerability made 
headlines around the world in 2014. Terms 
such as ‘hacktivism’, ‘cybercrime’, even 
‘cyberwar’ were used widely, showing that 
network security is a serious concern for all 
organisations. This poses the question: exactly 
how vulnerable is your network compared with 
others in your industry or region, and what 
should you do about it? 
Count your PSIRTs 
One indication of a network’s vulnerability is the number, 
and degree of criticality, of device software vulnerabilities 
it contains. As vulnerabilities become known, Cisco 
publishes what are called PSIRTs. PSIRT stands for Product 
Security Incident Response Team, but within the context 
of network security, the term refers to a software bug 
or vulnerability that’s been identified after extensive lab 
testing and research. 
Each PSIRT has a unique number and denotes a particular 
operating system weakness that may also pose a security 
risk. Hackers may discover and exploit such vulnerabilities 
in a network, which can lead to a denial of service, or 
allow the hacker to gain access to sensitive data. The 
more PSIRTs identified on a device or in a network, the 
higher the risk of a security breach due to the increased 
‘attack surface’ available to exploit. 
Growing concerns 
Measured by the increasing number of PSIRTs published 
by Cisco over the last few years, it’s concerning that the 
general trend is towards more vulnerable networks. 
Adding to the concern is that, according to our data, 
networks aren’t improving either. Over the last four years, 
the percentage of devices with at least one vulnerability 
has remained relatively stable overall. 
Figure 10: 
Number of PSIRTs announced per year 
network barometer 
report 
2014 
2004 
2005 
2006 
2007 
2008 
2009 
2010 
2011 
2012 
2013 
PSIRTs 
Trend
16 
network barometer 
report 
2014 
Figure 11: 
Percentage of devices with PSIRTs by region 
65% 
76% 
73% 72% 
69% 
73%75% 
Americas Asia Pacific Australia Europe Middle East & Africa Average 
Regionally, the Americas, Asia Pacific, and Europe saw 
relatively large increases in PSIRT percentages from last 
year, while Australia and MEA remained fairly stable. 
The larger percentages aren’t surprising, given that 
organisations are sweating their assets. There’s a strong 
correlation between the number of ageing devices and 
the percentage of devices with vulnerabilities. Also, as 
more services are added to the network, more software 
is required to effectively operate the infrastructure. 
This increases the overall operational risk of owning an 
unmaintained network. 
Types of security vulnerabilities 
The risk posed to your network by a particular 
vulnerability depends on what type of PSIRT it is and 
where in the network the devices which have that 
vulnerability are located. Also, the longer a vulnerability 
has been known, the higher the risk, as it gives attackers 
more time to learn how to exploit it. See Table 3 in 
Appendix B for more information about the 10 most 
prevalent PSIRTs in 2014. 
Be still my bleeding heart 
The Heartbleed vulnerability announced this year was, 
and still is, a very serious threat if not remedied. As an 
open-source software bug, it puts a range of operating 
systems and vendor appliances at risk, and can allow 
attackers to unravel security measures such as user names 
and passwords. 
Luckily, the response from top websites was swift and 
many operators have already patched at least their 
Internet-facing systems. While the external Web presence 
is the most important to safeguard, it will most likely 
take internal network environments some time to protect 
themselves fully against Heartbleed. For more information 
on Heartbleed and our recommended remediation plan, 
email queries@dimensiondata.com. 
How to protect yourself 
While it’s not possible to know about every security 
threat in advance, it’s best to build the relevant security 
capabilities in your organisation to minimise exposure to 
vulnerabilities such as Heartbleed. 
2010 2011 2012 2013 2014 
46% 
85% 
55% 
67% 
52% 
82% 
66% 
85% 
33% 
80% 80% 
27% 
61% 
50% 
60% 59% 
84% 
89% 
78%79% 
38% 
67% 
74%
17 
network barometer 
report 
2014 
Key security capabilities 
to consider: 
• visibility and discovery tools – both network- and 
application-based 
• incident response plans and automated workflow 
• vulnerability and remediation management 
• risk profiling appropriate to business context 
• network-, application-, and data-centric protection 
controls that can be rapidly applied when risks are 
discovered and assessed 
How we interpret the results 
In the technology lifecycle section, we saw that organisations 
are choosing to sweat their assets. Networking devices have 
continued to get older for the fourth year in a row. The question 
we asked was: are organisations exposing themselves to 
increased network failures and downtime, since more than half 
of their network devices are ageing, with more than a quarter of 
those at an older lifecycle stage when vendor support is limited? 
To answer this question, we analysed more than 91,000 
service incidents handled by our GSCs, covering more than 
400,000 devices under our management. Our findings turned 
conventional wisdom on its head: 
• Obsolete devices were 25% less likely to fail than devices that 
were current. 
• It took, on average, one hour less to resolve issues on 
obsolete devices than on current devices. 
These findings are supported by Dimension Data’s practical 
experience in supporting networks of all ages. Current devices 
are subject to a ‘burn-in’ period in which software bugs 
and operating system problems are still prevalent. Generally 
speaking, a new device is most likely to fail during the first 90 to 
180 days after installation. Any issues related to the first version 
of a device or operating system, or arising from manufacturing 
or shipping the device to site, will manifest shortly after 
installation. Once a device is past this ‘burn-in’ period, fewer 
incidents occur. 
Later, when the device is obsolete, there’s usually only one 
remediation plan if it fails: to immediately swap it with a spare. 
This reduces mean-time-to-repair, as it’s generally quicker to 
replace a device than diagnose and troubleshoot the particular 
software bug or hardware problem. This, however, requires a 
mature sparing strategy on the part of the support 
organisation, such as those offered by Dimension Data. 
Without such programmes, obsolete devices would take 
much longer to repair. 
Our conclusion is that a refreshed network places a heavier 
burden on an organisation’s support services infrastructure 
than an ageing network does. Based on the rate of technology 
failures and resolution time, and the added benefit of reduced 
capex, the decision to sweat network assets is sound. 
However, it’s crucial to thoroughly consider the root causes 
of service incidents. Our 2014 data indicates that only 16% 
of all incidents were related to device failure. This leaves a 
massive 84% of service incidents caused by other factors such 
as telecom failures or environment issues. These statistics are 
worrying because a large proportion of incidents fall outside of 
a support provider’s traditional remit, and are therefore up to 
the organisation itself to resolve. 
The implication is that an organisation needs mature processes 
for problem, change, and configuration management, as well as 
the right tools and people, to handle incidents effectively. 
network barometer 
report 
Dimension Data recommends that it’s best to standardise 
on hardware and software as much as possible, as this 
reduces both risk and operational complexity in the 
long run. The more software and hardware versions 
used on the network, the higher the risk and the harder 
it becomes to maintain. Operational efficiency is also 
hampered due to feature disparity. 
Patches should not be applied only for the sake of 
patching. Rather, patch devices based on a calculated 
risk. For example, if a device is vulnerable, but it doesn’t 
support critical systems or interconnect with an important 
part of the network, the priority to patch might be lower 
than for a device that does.
18 
network barometer 
report 
2014 
Do older networks cause more failures 
and require increased support? 
No, failure rates and mean-time-to-repair 
(MTTR) are lower for obsolete equipment. 
16% 
so 
current 
4.2 hrs 
obsolete 
3.3 hrs 
overall 
3.4 hrs 
ageing 
2.7 hrs 
we recommend 
Conduct a thorough audit 
to understand the maturity and suitablity of 
your support systems and processes. 
Partner with a support services expert 
to fill any support gaps you may have. 
only 
of incidents = 
device 
failures 
84% 
of incidents = 
outside 
your 
maintenance 
supplier’s remit 
current 
3.78% 
ageing 
4.14% 
obsolete 
2.95% 
Average MTTR by lifecycle status 
Failure rate by lifecycle status
19 
network barometer 
report 
2014 
Question 3: Technology type – are today’s networks 
prepared for architectural trends such as cloud and 
enterprise mobility? 
Our observations about ageing networks and operational 
support maturity led us to ask: are organisations still investing in 
their networks to address architectural trends such as cloud and 
enterprise mobility? Or are they more inclined to wait and see 
what newer trends, such as software-defined networking, will 
bring before investing in any new technology? 
About 
software-defined networking 
Software-defined networking makes networks more 
intelligent, programmable, and automated. This is 
brought about by changes at the networking device level. 
The intelligent, programmable part of each device – the 
software that determines how the device controls and 
directs data – is split from the packet-forwarding engine, 
and centralised. Software-defined networks therefore use 
hardware networking devices that are configured by a 
central, software-based controller. 
Hence the term ‘software-defined’: the network is no 
longer configured by manually adjusting individual 
devices, but controlled by software. 
Click here to read more about Dimension Data’s Software-defined 
Networking Development Model, which can help 
you take the first step in preparing your network for the 
future of networking. 
In last year’s Report, we argued that enterprise mobility 
would necessitate an evolution in the access switching 
network architecture, from largely wired to mostly wireless 
infrastructures. In an environment where the great majority 
of end users connect to the network wirelessly, the traditional 
campus access-switching network must evolve. In the old 
model, 80% of the switch ports were for dedicated, wired users 
while 20% were for shared, wireless users. This ratio will need 
to change: 80% of switch ports will have to be for shared, 
wireless users, and 20% for dedicated, wired users. 
This ‘80/20 flip’ is described in Figure 12.
20 
network barometer 
report 
2014 
Figure 12: 
From wired to wireless – the architecture of current versus future networks 
Wireless LAN 
controller 
48-port LAN 
switches 
Current – traditional wired and wireless access networks 
• wired network 
(100 users) 
• cabling 
(140 points) 
• IP phones 
• printers 
• video endpoints 
• security systems 
• wireless networks 
(100–200 devices) 
• cabling 
(1 point per access point) 
• smartphones 
• tablets 
• laptops 
48-port LAN 
switch with built 
in controller 
Future – predominantly wireless access networks 
• wired network 
(10 users) 
• cabling 
(20 points) 
• video endpoints 
(some could be wireless) 
• security systems 
• wireless networks 
(100–300 devices) 
• cabling 
(1 point per access point) 
• smartphones 
• tablets 
• laptops 
• printers 
• video, etc. 
For this change to occur, network devices in the access layer 
require at least three features: 
• power-over-Ethernet to power the access points 
• gigabit Ethernet ports on the client side to enable the 
300–800MB speeds of 802.11n/ac 
• 10-gigabit uplinks – as more users access the network via 
fewer ports, uplinks need greater capacity in order to avoid 
congestion 
The type of technology that organisations choose to refresh can 
therefore indicate whether they’re preparing for this change 
to pervasive wireless connectivity ... or not, as our 2013 results 
showed. Last year: 
• 49% of all ports supported power-over-Ethernet 
• 32% of all ports supported gigabit Ethernet 
• only 11% of access switches supported 10-gigabit uplinks 
Based on these discovery results, organisations were clearly 
investing in wireless access points and controllers, but not 
making similar investments in their broader access network 
infrastructure.
21 
network barometer 
report 
2014 
This year’s results 
WLAN bookings 
In 2014 Dimension Data again saw strong growth in its 
wireless business, up approximately 30% from the previous 
year. Organisations continue to invest in pervasive wireless 
connectivity at the edge of their networks. In addition, we 
saw evidence of technology refresh in the access network 
infrastructure needed to support this wireless connectivity: 
• Gigabit access switch ports increased from one-third of all 
switches last year to just under half this year. 
• Switches that support 10-gigabit uplinks increased from just 
over one-tenth to just under a quarter of all switches. 
• There was a much smaller increase in ports that support 
power-over-Ethernet, from just under half last year to just 
over half this year. 
How we interpret the results 
The growth in the percentage of access switches that support 
gigabit Ethernet and 10-gigabit uplink capacity tells us that 
some refresh was taking place to support architectural trends 
like pervasive wireless connectivity and enterprise mobility. This 
is supported by our technology lifecycle data which shows that 
most refresh occurred early in the obsolescence cycle where the 
percentage of ageing devices dropped from 28% last year to 
23% this year – as most ageing access switches in our sample 
are still at early stages in their lifecycles. 
Organisations tend to sweat their 
network assets for as long as 
possible to save costs, unless 
the need for specific new features 
becomes more pressing. 
growing at 
+30% pa 
1/2 
of all access switches 
support PoE 
Still at around 
half of all ports = 
51% 
1/3 
of all access switches 
support GE 
Increased to just 
less than half of 
all ports at 
45% 
Increased to 
about a quarter 
of all posts at 
23% 
11% 
of all access switches 
support 10GB 
uplinks 
For example, if an organisation requires greater bandwidth to 
support pervasive wireless connectivity thanks to a host of new 
mobile devices brought to work by employees, it would have no 
choice but to refresh those devices sooner.
22 
network barometer 
report 
2014 
Are today’s networks prepared for 
trends such as enterprise mobility? 
45% 
of access ports 
support 
gigabit 
Ethernet 
of access switches 
10-gigabit 
uplinks 
we recommend 
Have an accurate inventory 
of your network estate. 
Regularly review 
your long-term network architecture requirements. 
Understand your ‘as-is’ state, 
define your ‘to-be’ state, and plan the steps 
of your journey to get there. 
power-over 
-Ethernet 
23% 
51% 
of access switches 
support 
support
23 
network barometer 
report 
2014 
Recommendations 
Given this year’s results, Dimension Data recommends that the 
most effective way to improve your network service levels and 
ensure maximum network availability is to invest in mature 
operational systems and support processes – particularly 
problem and change management – rather than refreshing 
technology simply for the sake of avoiding obsolescence. 
Figure 13: 
Dimension Data’s operational support maturity model 
Whether an organisation chooses to sweat its network assets as long as possible or if it decides to refresh some or 
all of its network, robust and mature operational support processes will ensure maximum availability. 
Moving towards the ‘optimised’ level doesn’t necessarily 
require you to have all capabilities in-house. In fact, many day-to- 
day IT operational requirements are not strategic to most 
organisations: knowing how to replace a fixed-access switch in 
the wiring closet doesn’t add to your organisation’s competitive 
advantage. 
In many cases, it’s best to partner with an expert provider of 
network managed or outsourcing services. This will free up your 
own IT resources to focus on strategic projects that substantially 
build your competitive advantage. 
As shown in Figure 13, and based on our experience in 
evaluating organisations’ operational support maturity, the 
vast majority (90%) of organisations are still at the first or 
second level of maturity. These levels are characterised by a 
lack of standard processes, ad hoc troubleshooting tools, and 
ambiguous roles and responsibilities for IT staff, resulting in 
extended network downtime and increased operational costs. 
These points notwithstanding, the primary requirement of the 
network is to deliver the services necessary to support business. 
Architectural trends such as cloud and enterprise mobility 
– and, eventually, software-defined networking – provide 
significant opportunities for organisations to improve employee 
productivity, increase sales, and shorten time-to-market. 
Therefore, the primary criterion for deciding whether to refresh 
your network is its ability to support business requirements – 
not whether the device is obsolete. 
In summary, the decision of whether or not to upgrade your 
network depends equally on your technical and architectural 
requirements, and the maturity of your operational support 
systems and processes. Dimension Data recommends the 
following approach to the technology refresh decision: 
Initial 
• ad hoc 
• undocumented 
• unpredictable 
• poorly controlled 
• reactive 
• no automation 
• roles and responsibilities 
undefined 
Repeatable 
• some documented 
processes 
• processes not 
uniformly used 
• some automation 
• limited definition of 
roles and responsibilities 
Defined 
• processes are proactive 
• automation exists for 
defined processes 
• roles are well defined 
• mature asset and change 
management processes 
Managed 
• set quality goals 
• guaranteed SLAs 
• monitoring and reporting 
• processes are integrated 
• automation tools 
are integrated 
• capacity planning 
Optimised 
• IT and business 
metric linkage 
• continuous service 
improvement 
• IT improves 
business process 
• business planning 
Complete lack of 
organisation 
Holding down 
the fort 
Well run 
cost centre 
Business 
alignment 
Business 
driver
24 
network barometer 
report 
2014 
Figure 14: 
The technology refresh decision tree 
Acquire additional 
support services 
Yes Can the organisation 
Yes 
effectively 
support the device? 
The starting point is visibility: gain a clear view of your 
infrastructure by creating and maintaining an accurate inventory 
of all your networking devices. Then, understand each device’s 
lifecycle status, security vulnerabilities, and future-readiness. 
Lastly, define your organisation’s capability and maturity in 
supporting and maintaining this crucial asset – your network – 
as the platform for your business. 
Do not refresh 
the device 
To help you with all your network assessment, maintenance, and 
support requirements, Dimension Data offers the following: 
• Technology Lifecycle Management Assessment 
• Network Optimisation Assessment 
• Network Architecture Consulting Workshop 
• IT Support Assessment 
• IT Service Management Assessment 
• Uptime and Insite Maintenance and Support Services 
• Managed Services for Enterprise Networks 
• IT outsourcing services for the network tower 
Is the device fit 
for purpose? 
Move the device 
to another part of 
the network 
Can it be moved 
to another part of 
the network? 
Refresh device 
Yes 
No 
No 
No 
The starting point is visibility: 
gain a clear view of your 
infrastructure by creating 
and maintaining an accurate 
inventory of all your 
networking devices.
25 
network barometer 
report 
2014 
Appendix A – sample distribution 
This appendix provides details about the sample data sets used 
for the information in this report. 
Technology lifecycle, type, and 
vulnerability data 
The technology lifecycle information published in this Report 
was gathered during the 2013 calendar year through Dimension 
Data’s Technology Lifecycle Management Assessments 
conducted for 288 clients around the world, covering 74,000 
devices. This is a significantly larger sample size than last year, 
which covered 233 Assessments and 60,000 devices. 
Information from the Network Barometer Reports of 2009, 
2010, 2011, 2012, and 2013 was gathered during the 2008, 
2009, 2010, 2011 and 2012 calendar years respectively. 
Dimension Data’s Technology Lifecycle Management Assessment 
is a highly automated service that uses technology tools to scan 
our clients’ networks. The information gathered from these 
scans is analysed on a centralised portal, using a standardised 
process and framework. 
Figure 15: 
Percentage of nodes (devices) by organisation size 
Figure 16: 
Percentage of nodes (devices) by industry sector 
12% 
This year, the data sample achieved greater balance among 
industry sectors. In previous years, there was some bias towards 
government; health care and education; and financial services, 
which together accounted for more than half of the sample set. 
This combined portion has shrunk significantly this year, with 
automotive and manufacturing, and consumer goods and retail, 
now occupying the top two positions. 
2% 
86% 
12% 
Enterprise 
Enterprise 
Large 
Large 
Medium 
Small 
The majority of data came from enterprise and large 
organisations, reflecting Dimension Data’s client base. 
19% 
17% 
11% 
2% 
3% 
Automotive and 
manufacturing 
Business services 
Construction and 
real estate 
Consumer goods 
and retail 
Financial services 
Government health care 
and education 
Media – entertainment 
and hospitality 
Resources – utilities 
and energy 
Service providers 
and telecommunications 
6% 
3% 
5% 
17% 
5% 
Technology 
Travel and transportation 
2% 
86% 
12% 
Medium 
Small
26 
network barometer 
report 
2014 
Figure 17: 
Percentage of nodes (devices), by region 
Figure 18: 
Number of assessments by country 
53 
This year’s report covered 32 countries in five regions. 
Spain 
South Africa 
Switzerland 
Singapore 
Philippines 
Nigeria 
New Zealand 
Netherlands 
Morocco 
Malaysia 
Kenya 
Japan 
Italy 
Indonesia 
India 
Hong Kong 
Germany 
France 
Czech Republic 
China 
Chile 
Canada 
Brazil 
Botswana 
Belgium 
Australia 
10 
3 2 3 
6 
1 
6 10 
17 
3 
23 
1 
4 
1 
6 
28 
2 4 
8 
1 2 4 
6 
29 
12 
Tanzania 
Thailand 
UAE 
Uganda 
UK 
US 
3 2 2 1 
17 18 
18% 
26% 
29% 
Americas 
Asia Pacific 
Australia 
Europe 
Middle East & Africa 
11% 
16%
Appendix B – services data 
27 
network barometer 
report 
2014 
This year, we introduced a new data set to corroborate the 
assessment results with helpdesk data. Our aim was to deepen 
our understanding of the business impact of obsolescence on 
network failures and downtime. We analysed over 91,000 
service 58.8% 
incidents – or ‘trouble tickets’ – handled by four of our 
GSCs, to understand the types of incidents we’ve handled in 
maintaining our clients’ networks, and the relationship of these 
incidents to the lifecycle data. 
17.8% 
Figure 19: 
Number of service incidents by region 
The analysis of the incident data was based on a subset of 
Dimension Data’s total maintenance base. We chose a selected 
set of network asset types in order to align with the technology 
aspects of this report, and account for the merging of systems 
following mergers and acquisitions. 
With just under a million devices creating an incident volume of 
almost 91,000, this represents a statistically relevant sample. 
58.8% 
17.8% 
Figure 20: 
Device type count, by region 
Americas Asia Australia Europe Middle East & Africa Overall 
58,889 
Table 3: 
Top 10 PSIRTs 
17,854 
7,174 
14,069 
29,702 
21,632 
76,486 
153,905 
Rank PSIRT title Count Penetration 
rate 
137,117 
131,831 
228,961 
Last year’s 
rank 
Published 
1 Cisco IOS Software Network Address Translation 
Vulnerabilities – 112253 
18 539 39% 3 28 September 2011 
2 Cisco IOS Software Multiple Features Crafted UDP Packet 
Vulnerability – 108558 
17 561 37% 5 25 March 2009 
3 Cisco VLAN Trunking Protocol Vulnerability – 108203 14 336 30% 7 6 November 2008 
4 TCP State Manipulation Denial of Service Vulnerabilities in 
Multiple Cisco Products – IOS – 109444 
14 052 29% 1 1 September 2009 
5 Cisco IOS Software Command Authorization Bypass – null 13 675 29% 2 29 March 2012 
6 Cisco IOS Cross-Site Scripting Vulnerabilities – 98605 14 584 28% 6 6 February 2009 
7 Cisco IOS Software Multicast Source Discovery Protocol 
Vulnerability – null 
11 632 24% 4 29 March 2012 
8 Cisco IOS Software Tunnels Vulnerability - CSCsx70889 – 
109482 
11 157 23% 9 28 September 2009 
9 Cisco IOS Software Multiple Features IP Sockets Vulnerability 
– 109333 
11 052 23% 8 25 March 2009 
10 Cisco IOS Software DHCP Version 6 Server Denial of Service 
Vulnerability – null 
10 453 22% N/A 18 October 2012 
2010 2011 2012 2013 2014 
3.9% 
10.1% 
90.8% 
Americas 
Asia Pacific 
Europe 
Middle East & Africa 
Total 
3,990 
10,123 
90,856 
Americas Asia Australia Europe Middle East & Africa 2010 2011 2012 2013 2014 
3.9% 
10.1% 
90.8% 
Middle East Total 
& Africa 
Americas Asia Pacific Europe 
4.596 
4,639 
10,997 
165,871 
227.025 
423,565
28 
network barometer 
report 
2014 
List of acronyms 
GSC Global Service Centre (Dimension Data) 
ICT information and communication technology 
MEA Middle East & Africa 
PSIRT Product Security Incident Response Team 
List of figures 
Figure 1: Percentage of ageing and obsolete devices, global average 
Figure 2: Percentage of ageing and obsolete devices by region 
Figure 3: Percentage of ageing and obsolete devices by industry 
Figure 4: Percentage of devices by lifecycle stage in the Network Barometer Report 2013 
Figure 5: Percentage of devices by lifecycle stage in the Network Barometer Report 2014 
Figure 6: Covered assets by lifecycle stage 
Figure 7: Incidents by resolution category 
Figure 8: Device failure rate by lifecycle stage 
Figure 9: Mean-time-to-repair by lifecycle stage 
Figure 10: Number of PSIRTs announced per year 
Figure 11: Percentage of devices with PSIRTs by region 
Figure 12: From wired to wireless – the architecture of current versus future networks 
Figure 13: Dimension Data’s operational support maturity model 
Figure 14: The technology refresh decision tree 
Figure 15: Percentage of nodes (devices) by organisation size 
Figure 16: Percentage of nodes (devices) by industry sector 
Figure 17: Percentage of nodes (devices) by region 
Figure 18: Number of assessments by country 
Figure 19: Number of service incidents by region 
Figure 20: Device type count by region 
List of tables 
Table 1: Technology lifecycle stages, associated risk levels, and required support environment maturity 
Table 2: Percentage of devices by lifecycle stage, by incident 
Table 3: Top 10 PSIRTs
Middle East & Africa 
Algeria · Angola 
Botswana · Congo · Burundi 
Democratic Republic of the Congo 
Gabon · Ghana · Kenya 
Malawi · Mauritius · Morocco 
Mozambique · Namibia · Nigeria 
Oman · Rwanda · Saudi Arabia 
South Africa 
Tanzania · Uganda 
United Arab Emirates · Zambia 
Asia 
China · Hong Kong 
India · Indonesia · Japan 
Korea · Malaysia 
New Zealand · Philippines 
Singapore · Taiwan 
Thailand · Vietnam 
Australia 
Australian Capital Territory 
New South Wales · Queensland 
South Australia · Victoria 
Western Australia 
Europe 
Austria · Belgium 
Czech Republic · France 
Germany · Hungary 
Ireland · Italy 
Luxembourg · Netherlands 
Poland · Portugal 
Slovakia · Spain · 
Turkey · United Kingdom 
Switzerland 
Americas 
Brazil · Canada · Chile 
Mexico · United States 
For contact details in your region please visit www.dimensiondata.com/globalpresence

Network barometer report 2014

  • 1.
    Network Barometer Report 2014 A gauge of global networks’ readiness to accelerate business
  • 2.
    About Dimension Data Founded in 1983, Dimension Data plc is a global ICT services and solutions provider that uses its technology expertise, global service delivery capability, and entrepreneurial spirit to accelerate the business ambitions of its clients. Dimension Data is a member of the NTT Group. It has designed, built and manage over 9,000 networks worldwide to enable more than 13 million users to connect to their organisations’ networks. Dimension Data has delivered over 1,400 Technology Lifecycle Management Assessments to date. The Network Barometer Report can be downloaded at: www.dimensiondata.com/networkbarometer Copyright notice and disclaimer © Dimension Data 2009–2014 Copyright and rights in databases subsist in this work. Any unauthorised copying, reproduction or other dealing in this work, or any part thereof, without the prior written consent of the copyright owner is an act of copyright infringement. Copying of certain portions of this work, such as tables, graphs, and certain extracts is permissible subject to the condition that (1) such portions do not constitute a substantial reproduction of the work (or a section) as a whole, and (2) the following notice accompanies all such portions: ‘Dimension Data Network Barometer Report 2014, © Dimension Data 2009–2014’. Any unauthorised copying, communication to the public, reproduction, or other dealings in this work, or any part thereof, renders the person who is responsible for such acts liable for civil law copyright infringement and, under certain circumstances, liable to criminal prosecution. All rights of the copyright owner are reserved. The data and information contained in the Network Barometer Report are for information purposes only. While the commentary and hypotheses in this Report are based on rigorous data analysis and market experience, the content also contains opinion. Furthermore, while reasonable steps are taken to ensure the accuracy and integrity of the data and information provided, Dimension Data accepts no liability or responsibility whatsoever if such data or information is incorrect or inaccurate, for whatsoever reason. Dimension Data does not accept liability for any claims, loss or damages of any nature, arising as a result of the reliance on, or use of, such data or information by any individual or organisation.
  • 3.
    network barometer report 2014 Table of contents Executive summary 2 Results 5 Question 1: Technology lifecycle – how old are today’s networks? 5 This year’s results 6 How we interpret the results 9 Summary 11 Question 2: Service incidents – do older networks cause more failures and require increased support? 12 This year’s results 13 How we interpret the results 17 Summary 18 Question 3: Technology type – are today’s networks prepared for architectural trends such as cloud and enterprise mobility? 19 This year’s results 21 How we interpret the results 21 Summary 22 Recommendations 23 Appendix A – sample distribution 25 Appendix B – services data 30
  • 4.
    network barometer report 2014 About the Network Barometer Report 2014 1 2 3 a larger sample size 288 technology assessments spread across regions 74,000 devices See Appendix A for detailed breakdown. more evenly and industries 5 regions 32 countries 11 industries Technology data gathered from: Support services data gathered from: 4 Global Service Centres in new support services data Boston Frankfurt Bangalore Johannesburg 91,000 service incidents 1
  • 5.
    2 network barometer report 2014 Proof that network success depends as much (and perhaps more) on operational support capabilities as on technology. In this year’s Network Barometer Report, we’ve incorporated data gathered from Dimension Data’s Global Service Centres (GSCs). This information relates to support service requests – or ‘incidents’ – logged against client devices under Dimension Data’s management. When combined with the network discovery data gathered from our Technology Lifecycle Management Assessments, it provides a multidimensional view of networks today. In interpreting the results, Dimension Data has brought its strategic focus on ICT services and extensive experience in maintaining, supporting, managing, and outsourcing its clients’ networks to bear on the Report’s goal: to gauge the readiness of today’s networks to accelerate business. Our findings may be viewed by some as controversial. Our overall conclusion: The great majority of service incidents are not related to network devices. In addition, maintenance requirements for these devices vary depending on their lifecycle stage. The most important requirement for the network to successfully support business is therefore a mature set of operational tools and processes. We’ve reached this conclusion by asking ourselves three searching questions. These were answered by analyses and interpretation of the data sets, which are captured in more detail in the rest of this Report.
  • 6.
    network barometer report 2014 Q1: In terms of technology lifecycle, how old are today’s networks? A1: Organisations continue to delay refreshing their networks, as the percentage of ageing and obsolete devices has increased to its highest level in six years: • More than half of all devices (51%) are now ageing or obsolete. • Of all devices, 27% are now ‘later’ in their product lifecycle, when the vendor begins to reduce support for the device. Over the past few years, as the percentage of ageing and obsolete devices steadily increased, the conventional assumption was that a technical refresh cycle was imminent. However, our data shows that organisations are clearly willing to sweat their network assets for longer than expected. Some of the drivers behind this behaviour include: • a sustained focus on cost savings following the global economic crisis, particularly reduced capex budgets, which may have disrupted the usual three- to five-year refresh patterns • the growing availability and uptake of as-a-service ICT consumption models which reduce the need for organisations to invest in their own IT infrastructure • the introduction of programmable, software-defined networks which may be causing organisations to ‘wait and see’ before selecting and implementing new technology – a factor we expect will become more influential in the next 18 to 36 months (also see About software-defined networking.) Q2: Do older networks cause more failures and network downtime, and require increased support? A2: A resounding ‘no’. • Our results show that older devices fail less frequently and take less time to repair. • However, older networks do have special support requirements, particularly sparing and device swap-out strategies. Without these, failures caused by older devices would take longer to resolve. • The great majority of service incidents (84%) aren’t device-related, but are caused by human error, environment problems, or telecom failure, all of which fall outside the remit of a conventional support contract. Q3: A3: For example, enterprise mobility requires pervasive wireless connectivity which, in turn, requires at least three basic features in the access network: power-over-Ethernet, gigabit Ethernet on the client side, and 10-gigabit uplinks. This year, we found that: • 51% of all ports support power-over-Ethernet, roughly the same as in 2013. • 45% of access switch ports support gigabit Ethernet, up from 33% in 2013. • 23% of access switches support 10-gigabit uplinks, up from 11% in 2013. We see this slight improvement as a reaction to the increased number of mobile devices used in the workplace, rather than the result of a planned and proactive strategy to prepare for enterprise mobility and cloud. If organisations are sweating their network assets, how well prepared are their networks for architectural trends such as enterprise mobility? Despite the general tendency to sweat assets, some technology refresh is occurring, primarily to address current architectural trends. 3
  • 7.
    4 network barometer report 2014 What we recommend We know that it’s good to sweat network assets some of the time, the question is: when? Given the financial and operational benefits of older devices, such as lower failure rates and shorter time to repair, organisations can choose to sweat their assets for as long as possible, subject to organisational standards and compliance policies. However, they must also have a mature set of operational tools and processes in place, including sparing strategies for obsolete equipment, to support greater network availability as vendor support diminishes during later lifecycle stages. The benefits of sweating assets notwithstanding, organisations must make sure that their networks can accommodate important architectural trends such as enterprise mobility and cloud computing, as these advancements will provide significant competitive advantage. However, upgrading networks to support these developments again puts pressure on internal IT support, as newer devices are more susceptible to service incidents. The single most important thing organisations can do to ensure their networks are able to support business is to invest in their operational support tools and processes. For more advice on how to implement this Report’s findings in your organisation, see our Recommendations. About the Network Barometer Report The Network Barometer Report 2014 presents the aggregate data gathered from Dimension Data’s Technology Lifecycle Management Assessments conducted for clients around the world in 2013. It also contains data relating to service incidents, logged at our Global Service Centres, for client networks that we support. Dimension Data compiles, analyses, compares, and interprets the data in order to gauge the readiness of today’s networks to accelerate business.
  • 8.
    network barometer report 2014 Results Question 1: Technology lifecycle – how old are today’s networks? About technology lifecycles In order to establish the age and viability of technology assets, most vendors have standardised milestones through which they progress their products towards obsolescence. For example, Cisco uses six technology lifecycle milestones. These run from future-end-of-sale, the announcement of the lifecycle milestone dates, to last-day-of-support, the date after which Cisco’s Technical Assistance Center will no longer support the product. Common to all vendors are end-of-sale and end-of-support. To normalise the data for this report, we’ve defined three lifecycle categories: • Current These devices are presently shipping and have full access to vendor support services. • Ageing Vendors have announced that these devices are past end-of-sale. They’ve not yet passed end-of-support, but vendor support is increasingly limited. • Obsolete These devices are past end-of-support. Table 1 lists these three categories, and the maintenance and support requirements typical of each. About the Technology Lifecycle Management Assessment This ICT assessment service from Dimension Data discovers installed assets on the network, identifies their lifecycle statuses, determines maintenance coverage, and flags potential security vulnerabilities. The Assessment assists organisations to align their IT infrastructure with best practices for configuration, security, and patch management, thereby ensuring that they’re not exposing themselves to unnecessary risk. The technology lifecycle data used in this Report comes from these automated Assessments, not from a survey. Click here for more information. 5
  • 9.
    6 network barometer report 2014 Table 1: Technology lifecycle stages, associated risk levels, and required support environment maturity Lifecycle Time status (years) Risks Required support environment maturity Current 0-3 • settling period during which product bugs and hardware stability issues are identified • organisations’ support teams learn new features of the device • controlled introduction into the environment, requiring mature release and deployment processes • new and/or advanced technology requires updated, technology-specific training • mature change management processes required to handle updates and patches, as required Ageing 3-5 • increased support costs with some vendors • decreasing support later in this stage (for example, no more software bug fixes) • all business-as-usual processes apply, including capacity and change management • some local sparing might be required for later-stage equipment Obsolete 5+ • no, or limited, access to spares • no, or limited, vendor support for complex issues • logistics and change management relating to local spares warehousing Figure 1: Percentage of ageing and obsolete devices, global average For the fourth consecutive year, the devices in today’s networks have aged in terms of their lifecycle status. This year, more than half of all devices were ageing or obsolete, which means that networks are the oldest they’ve been since the first Network Barometer Report was published in 2009. Overall 35% 38% 45% 48% 51% 43% 2009 2010 2011 2012 2013 2014 This year’s results
  • 10.
    7 37%22% 37% network barometer report 2014 35%34% Americas Asia Australia Europe Middle East & Africa Overall Figure 2: Percentage of ageing and obsolete devices by region 2010 2011 2012 2013 2014 35% 30% 35% 40% 38% 59% 38% 48% Americas Asia Pacific Australia Europe Middle East & Africa Average 2010 2011 2012 2013 2014 37%38% 22% 37% 44% 39%40% 44%44% 54% 35%34% 53% 51% 35% 56% 41% 52% 30% 38% 55% 53% 35% 45% 51% The Americas, Asia Pacific, and Europe showed notable increases in the percentage of ageing and obsolete devices. While Australia, and Middle East & Africa (MEA), appear to have improved marginally from last year, the overall trend in those two regions is clearly upwards when viewed over more than one year. Much of the increase can be explained by macroeconomics. Network spend is often linked to regional economic conditions, slowing during sluggish times and accelerating during times of growth. Last year, Australia and MEA showed significantly higher percentages of ageing and obsolete devices – over 50% – whereas the Americas, Europe, and Asia Pacific were closer to 40%. This coincided with the economic slowdown in the former two regions, in contrast to the slow, but stable, economic growth in the Americas, Europe, and Asia Pacific. This year, the economic slump in Asia Pacific inflated the region’s percentage of ageing devices. Steady economic growth continued in the Americas, which had a higher percentage of ageing devices than in 2013, but not quite as high as in other regions. Much of the increase can be explained by macroeconomics. Network spend is often linked to regional economic conditions, slowing during sluggish times and accelerating during times of growth.
  • 11.
    8 network barometer report 2014 Figure 3: Percentage of ageing and obsolete devices by industry Resources – utilities and hospitality and energy Media – entertainment and education 54% 2011 2012 2013 2014 48% 55% 60% 41% Eight out of the 11 industry sectors had roughly the same or slightly higher percentages of ageing and obsolete devices compared with last year. Three showed large increases: financial services (+13%); government, health care, and education (+11%); and service providers and telecommunications (+33%). The upwards trend in these sectors supports our view that the global financial crisis of recent years still has a lingering effect today. This tendency to sweat network assets for longer is perhaps simply due to a lack of funds for technology refreshes that aren’t seen as critical. The more substantial ageing of assets we’ve noticed in the service providers and telecommunications sectors could be due to various factors. Companies in these industries are typically massive organisations with significant operational staff complements and relatively mature support processes for managing their networking infrastructures. They can therefore afford to take on the greater risk of ageing networks. Average Travel and transportation Technology Service providers and telecommunications Service providers may also be sweating the assets they’ve deployed on clients’ premises. In many cases, this equipment serves primarily as a point of demarcation, or as ‘network termination units’, for the network connectivity provided by the service provider. So the service provider may not require the advanced features of newer devices, which would be the primary motivation for refreshing or upgrading equipment. 36% 38% Government – health care 33% 34% 22% Financial services Consumer goods 35% 35% Business services and retail 23% Automotive and manufacturing Construction and 50% 40% real estate 34% 40% 49% 32% 28% 54% 56% 48% 50% 46% 48% 34% 51% 44% 30% 48% 44% 38% 22% 40% 44% 28% 47% 29% 37% 18% 47% 37% 41% 61% 35% 38% 45% 48%
  • 12.
    9 network barometer report 2014 Figure 4: Percentage of devices by lifecycle stage in the Network Barometer Report 2013 Figure 5: Percentage of devices by lifecycle stage in the Network Barometer Report 2014 8% 52% 40% Current Ageing Obsolete 11% 49% 40% Current Ageing Obsolete Figures 4 and 5 compare the percentage of discovered devices by lifecycle category over the last year. Note that the 3% decrease in the percentage of current devices is matched by a 3% increase in the percentage of obsolete devices. Moreover, breaking down the percentage of ageing devices into their subcategories shows that the percentage of devices in the ‘late’ lifecycle stages, when the vendor begins reducing support (that is, end-of-engineering, end-of-software-maintenance, end-of-contract-renewal, and last-day-of- sale), has jumped from 20% last year to 27% this year. How we interpret the results Today’s networks are getting ‘older’ In general, we attribute this to organisations adopting a strategy of ‘fixing’ only what’s ‘broken’. When a device reaches the later lifecycle stages, the organisation has typically already decided to sweat that asset for as long as possible. That may be because the older device is situated in an area of the network that isn’t critical: should the device fail, the impact of a network outage is low. The few assets that were refreshed last year were probably in network areas where the need for advanced features was becoming pressing, or where the risk of extended downtime was too high. Our view is that this strategy is sound ... but comes with certain caveats (see overleaf). As networks have continued to age over the past several years, a common expectation was that a technology refresh was imminent – organisations wouldn’t risk allowing their networks to age indefinitely. Thus far, however, the expected refresh hasn’t materialised. Organisations have been far more economical in their approach, and more willing to risk getting by with ageing equipment for the sake of ‘running lean’, sometimes avoiding capex at all costs. However, a key question remains: If organisations continue to sweat their assets, do they increase the risk of network failures and downtime? To shed light on this, the Network Barometer Report 2014 incorporates support services data gleaned from four of Dimension Data’s GSCs ... and the results have been revealing.
  • 13.
    10 network barometer report 2014 Top tips to sweat your assets safely Have an accurate inventory of your entire network estate. Understand the function of each device and how critical it is to the network’s uptime. Know at which stage in their lifecycles these devices are. Have the appropriate operational support strategy in place to resolve any performance issues or outages that may occur, as vendor support will be either limited or unavailable during later lifecycle stages. Ensure that the device’s capabilities are not constraining architectural changes, which have driven upgrades in other areas of the network. Talk to us about how a Technology Lifecycle Management Assessment can give you a clear view of your networking estate, while an IT Support Assessment can help you ensure that your support systems and processes are the right fit for your organisation.
  • 14.
    network barometer report 2014 11 How old are today’s networks? oldest they’ve been in 6 years more than half of all devices are ageing or obsolete 11% are obsolete we recommend sweating your assets is okay but know your devices and their lifecycle stages understand potential network impacts if devices fail
  • 15.
    network barometer report 2014 Question 2: Service incidents – do older networks cause more failures and require increased support? This year, we analysed over 91,000 service incidents – or ‘trouble tickets’ – handled by Dimension Data’s GSCs. We wanted to understand the types of issues we’ve encountered while maintaining our clients’ networks, and how these issues relate to the device lifecycle data. (Please refer to Appendix A for detailed information and commentary on the sample size of our services data.) About Dimension Data’s GSCs Dimension Data’s GSCs are organisational hubs situated at eight central locations in five regions around the world: Americas: Boston, US; and Santiago, Chile Asia Pacific: Auckland, New Zealand; Bangalore, India; and Singapore Australia: Melbourne, Australia Europe: Frankfurt, Germany Middle East & Africa: Johannesburg, South Africa network barometer report 2014 12 This year, we analysed over 91,000 service incidents – or ‘trouble tickets’ – handled by Dimension Data’s GSCs. At these Centres, Dimension Data’s service delivery and technical support experts receive calls from clients and resolve technical service tickets, requests, and problems in 13 local languages (depending on the GSC’s location). The GSCs receive over a million such requests from 10,000 clients every year – more than 2,500 incidents each day.
  • 16.
    13 network barometer report 2014 This year’s results Figure 6: Covered assets by lifecycle stage 9% 46% 45% Current Ageing Obsolete The lifecycle stage distribution of the devices that Dimension Data supports mirrors the lifecycle distribution of our assessment discovery data. (In the assessment discovery data, 49% of devices were current, 40% were ageing, and 11% were obsolete – see Figure 5.) Figure 7: Incidents by resolution category 26% 22% 4% 2%2% 15% 9% 14% 6% Other human errors Telco failure Environment Hardware failure Asset capacity Configuration error Scheduled outage Bandwidth Software bug Figure 7 shows the breakdown of incidents by resolution category. One of the most significant findings is that the largest cause of incidents is human error: nearly one-third of all incidents (6% configuration errors, plus 26% other human errors) are, therefore, potentially avoidable. Telecom, or wide area network (WAN), failures are the next most frequent root cause, at 22%. This is to be expected, considering the complexity of maintaining and managing the many different components of a geographically dispersed telecom network. Third on the list of the most frequent causes of service incidents are physical environment problems such as loss of power, airconditioning failures, and temperature control problems. These account for 15% of all incidents. Finally, in fourth position, are device-related problems, with 14% of all incidents attributed to hardware. Including the 2% of incidents attributed to software bugs, we see that only 16% of all service incidents fall under the remit of the device maintenance providers. This means that a massive 84% of the network’s operational burden falls outside typical maintenance contracts and therefore must be addressed by the organisation’s internal support processes. In the assessment discovery data, 49% of devices were current, 40% were ageing, and 11% were obsolete.
  • 17.
    14 network barometer report 2014 Table 2: Percentage of devices by lifecycle stage by incident Lifecycle stage Asset % Incident % Current 46% 40% Ageing 45% 53% Obsolete 9% 7% As expected, there’s a correlation between incidents raised and the lifecycle stage of devices. For example, 46% of all devices under management were current, and caused 40% of all incidents. For the purposes of this analysis, Dimension Data filtered the data to show only hardware failures and software problems. All other incidents are caused by factors that can’t be regarded as device failures. Figure 8: Device failure rate by lifecycle stage 4.14% Current Ageing Manufacturers generally target a hardware failure rate of 4% per annum. The 2014 data shows that the failure rate of the devices in Dimension Data’s maintenance base is indeed close to this level. One might expect the failure rate of obsolete devices to be higher than current or ageing devices, as obsolete devices are older and maintenance options are limited. However, this year’s analysis shows that the failure rate of obsolete devices is about a percentage point lower than either current or ageing devices. Figure 9: Mean-time-to-repair by lifecycle stage 4.2% 3.3% 3.4% 2.7% Current Ageing Obsolete Average If obsolete devices are less likely to fail than current or ageing devices, how long would they take to repair should they fail? One might expect that older devices that fail would cause longer downtime than current or ageing devices. But, again, the results prove otherwise. Figure 9 shows that the average mean-time-to-repair for all devices is 3.4 hours. Current devices take about 48 minutes longer to repair than the average. Ageing devices take the shortest time to repair, about 42 minutes shorter than average. Obsolete devices take slightly longer to repair than ageing devices, at 3.3 hours, substantially less time than it takes to repair current devices. In summary, obsolete devices fail less often than current devices. And, when they do fail, problems are quicker to resolve: about an hour less than for current devices. In summary, obsolete devices fail less often than current devices. And, when they do fail, problems are quicker to resolve: about an hour less than for current devices. 3.78% 2.73% Obsolete
  • 18.
    15 network barometer report 2014 Cyberattack! How safe is your network? The Heartbleed security vulnerability made headlines around the world in 2014. Terms such as ‘hacktivism’, ‘cybercrime’, even ‘cyberwar’ were used widely, showing that network security is a serious concern for all organisations. This poses the question: exactly how vulnerable is your network compared with others in your industry or region, and what should you do about it? Count your PSIRTs One indication of a network’s vulnerability is the number, and degree of criticality, of device software vulnerabilities it contains. As vulnerabilities become known, Cisco publishes what are called PSIRTs. PSIRT stands for Product Security Incident Response Team, but within the context of network security, the term refers to a software bug or vulnerability that’s been identified after extensive lab testing and research. Each PSIRT has a unique number and denotes a particular operating system weakness that may also pose a security risk. Hackers may discover and exploit such vulnerabilities in a network, which can lead to a denial of service, or allow the hacker to gain access to sensitive data. The more PSIRTs identified on a device or in a network, the higher the risk of a security breach due to the increased ‘attack surface’ available to exploit. Growing concerns Measured by the increasing number of PSIRTs published by Cisco over the last few years, it’s concerning that the general trend is towards more vulnerable networks. Adding to the concern is that, according to our data, networks aren’t improving either. Over the last four years, the percentage of devices with at least one vulnerability has remained relatively stable overall. Figure 10: Number of PSIRTs announced per year network barometer report 2014 2004 2005 2006 2007 2008 2009 2010 2011 2012 2013 PSIRTs Trend
  • 19.
    16 network barometer report 2014 Figure 11: Percentage of devices with PSIRTs by region 65% 76% 73% 72% 69% 73%75% Americas Asia Pacific Australia Europe Middle East & Africa Average Regionally, the Americas, Asia Pacific, and Europe saw relatively large increases in PSIRT percentages from last year, while Australia and MEA remained fairly stable. The larger percentages aren’t surprising, given that organisations are sweating their assets. There’s a strong correlation between the number of ageing devices and the percentage of devices with vulnerabilities. Also, as more services are added to the network, more software is required to effectively operate the infrastructure. This increases the overall operational risk of owning an unmaintained network. Types of security vulnerabilities The risk posed to your network by a particular vulnerability depends on what type of PSIRT it is and where in the network the devices which have that vulnerability are located. Also, the longer a vulnerability has been known, the higher the risk, as it gives attackers more time to learn how to exploit it. See Table 3 in Appendix B for more information about the 10 most prevalent PSIRTs in 2014. Be still my bleeding heart The Heartbleed vulnerability announced this year was, and still is, a very serious threat if not remedied. As an open-source software bug, it puts a range of operating systems and vendor appliances at risk, and can allow attackers to unravel security measures such as user names and passwords. Luckily, the response from top websites was swift and many operators have already patched at least their Internet-facing systems. While the external Web presence is the most important to safeguard, it will most likely take internal network environments some time to protect themselves fully against Heartbleed. For more information on Heartbleed and our recommended remediation plan, email queries@dimensiondata.com. How to protect yourself While it’s not possible to know about every security threat in advance, it’s best to build the relevant security capabilities in your organisation to minimise exposure to vulnerabilities such as Heartbleed. 2010 2011 2012 2013 2014 46% 85% 55% 67% 52% 82% 66% 85% 33% 80% 80% 27% 61% 50% 60% 59% 84% 89% 78%79% 38% 67% 74%
  • 20.
    17 network barometer report 2014 Key security capabilities to consider: • visibility and discovery tools – both network- and application-based • incident response plans and automated workflow • vulnerability and remediation management • risk profiling appropriate to business context • network-, application-, and data-centric protection controls that can be rapidly applied when risks are discovered and assessed How we interpret the results In the technology lifecycle section, we saw that organisations are choosing to sweat their assets. Networking devices have continued to get older for the fourth year in a row. The question we asked was: are organisations exposing themselves to increased network failures and downtime, since more than half of their network devices are ageing, with more than a quarter of those at an older lifecycle stage when vendor support is limited? To answer this question, we analysed more than 91,000 service incidents handled by our GSCs, covering more than 400,000 devices under our management. Our findings turned conventional wisdom on its head: • Obsolete devices were 25% less likely to fail than devices that were current. • It took, on average, one hour less to resolve issues on obsolete devices than on current devices. These findings are supported by Dimension Data’s practical experience in supporting networks of all ages. Current devices are subject to a ‘burn-in’ period in which software bugs and operating system problems are still prevalent. Generally speaking, a new device is most likely to fail during the first 90 to 180 days after installation. Any issues related to the first version of a device or operating system, or arising from manufacturing or shipping the device to site, will manifest shortly after installation. Once a device is past this ‘burn-in’ period, fewer incidents occur. Later, when the device is obsolete, there’s usually only one remediation plan if it fails: to immediately swap it with a spare. This reduces mean-time-to-repair, as it’s generally quicker to replace a device than diagnose and troubleshoot the particular software bug or hardware problem. This, however, requires a mature sparing strategy on the part of the support organisation, such as those offered by Dimension Data. Without such programmes, obsolete devices would take much longer to repair. Our conclusion is that a refreshed network places a heavier burden on an organisation’s support services infrastructure than an ageing network does. Based on the rate of technology failures and resolution time, and the added benefit of reduced capex, the decision to sweat network assets is sound. However, it’s crucial to thoroughly consider the root causes of service incidents. Our 2014 data indicates that only 16% of all incidents were related to device failure. This leaves a massive 84% of service incidents caused by other factors such as telecom failures or environment issues. These statistics are worrying because a large proportion of incidents fall outside of a support provider’s traditional remit, and are therefore up to the organisation itself to resolve. The implication is that an organisation needs mature processes for problem, change, and configuration management, as well as the right tools and people, to handle incidents effectively. network barometer report Dimension Data recommends that it’s best to standardise on hardware and software as much as possible, as this reduces both risk and operational complexity in the long run. The more software and hardware versions used on the network, the higher the risk and the harder it becomes to maintain. Operational efficiency is also hampered due to feature disparity. Patches should not be applied only for the sake of patching. Rather, patch devices based on a calculated risk. For example, if a device is vulnerable, but it doesn’t support critical systems or interconnect with an important part of the network, the priority to patch might be lower than for a device that does.
  • 21.
    18 network barometer report 2014 Do older networks cause more failures and require increased support? No, failure rates and mean-time-to-repair (MTTR) are lower for obsolete equipment. 16% so current 4.2 hrs obsolete 3.3 hrs overall 3.4 hrs ageing 2.7 hrs we recommend Conduct a thorough audit to understand the maturity and suitablity of your support systems and processes. Partner with a support services expert to fill any support gaps you may have. only of incidents = device failures 84% of incidents = outside your maintenance supplier’s remit current 3.78% ageing 4.14% obsolete 2.95% Average MTTR by lifecycle status Failure rate by lifecycle status
  • 22.
    19 network barometer report 2014 Question 3: Technology type – are today’s networks prepared for architectural trends such as cloud and enterprise mobility? Our observations about ageing networks and operational support maturity led us to ask: are organisations still investing in their networks to address architectural trends such as cloud and enterprise mobility? Or are they more inclined to wait and see what newer trends, such as software-defined networking, will bring before investing in any new technology? About software-defined networking Software-defined networking makes networks more intelligent, programmable, and automated. This is brought about by changes at the networking device level. The intelligent, programmable part of each device – the software that determines how the device controls and directs data – is split from the packet-forwarding engine, and centralised. Software-defined networks therefore use hardware networking devices that are configured by a central, software-based controller. Hence the term ‘software-defined’: the network is no longer configured by manually adjusting individual devices, but controlled by software. Click here to read more about Dimension Data’s Software-defined Networking Development Model, which can help you take the first step in preparing your network for the future of networking. In last year’s Report, we argued that enterprise mobility would necessitate an evolution in the access switching network architecture, from largely wired to mostly wireless infrastructures. In an environment where the great majority of end users connect to the network wirelessly, the traditional campus access-switching network must evolve. In the old model, 80% of the switch ports were for dedicated, wired users while 20% were for shared, wireless users. This ratio will need to change: 80% of switch ports will have to be for shared, wireless users, and 20% for dedicated, wired users. This ‘80/20 flip’ is described in Figure 12.
  • 23.
    20 network barometer report 2014 Figure 12: From wired to wireless – the architecture of current versus future networks Wireless LAN controller 48-port LAN switches Current – traditional wired and wireless access networks • wired network (100 users) • cabling (140 points) • IP phones • printers • video endpoints • security systems • wireless networks (100–200 devices) • cabling (1 point per access point) • smartphones • tablets • laptops 48-port LAN switch with built in controller Future – predominantly wireless access networks • wired network (10 users) • cabling (20 points) • video endpoints (some could be wireless) • security systems • wireless networks (100–300 devices) • cabling (1 point per access point) • smartphones • tablets • laptops • printers • video, etc. For this change to occur, network devices in the access layer require at least three features: • power-over-Ethernet to power the access points • gigabit Ethernet ports on the client side to enable the 300–800MB speeds of 802.11n/ac • 10-gigabit uplinks – as more users access the network via fewer ports, uplinks need greater capacity in order to avoid congestion The type of technology that organisations choose to refresh can therefore indicate whether they’re preparing for this change to pervasive wireless connectivity ... or not, as our 2013 results showed. Last year: • 49% of all ports supported power-over-Ethernet • 32% of all ports supported gigabit Ethernet • only 11% of access switches supported 10-gigabit uplinks Based on these discovery results, organisations were clearly investing in wireless access points and controllers, but not making similar investments in their broader access network infrastructure.
  • 24.
    21 network barometer report 2014 This year’s results WLAN bookings In 2014 Dimension Data again saw strong growth in its wireless business, up approximately 30% from the previous year. Organisations continue to invest in pervasive wireless connectivity at the edge of their networks. In addition, we saw evidence of technology refresh in the access network infrastructure needed to support this wireless connectivity: • Gigabit access switch ports increased from one-third of all switches last year to just under half this year. • Switches that support 10-gigabit uplinks increased from just over one-tenth to just under a quarter of all switches. • There was a much smaller increase in ports that support power-over-Ethernet, from just under half last year to just over half this year. How we interpret the results The growth in the percentage of access switches that support gigabit Ethernet and 10-gigabit uplink capacity tells us that some refresh was taking place to support architectural trends like pervasive wireless connectivity and enterprise mobility. This is supported by our technology lifecycle data which shows that most refresh occurred early in the obsolescence cycle where the percentage of ageing devices dropped from 28% last year to 23% this year – as most ageing access switches in our sample are still at early stages in their lifecycles. Organisations tend to sweat their network assets for as long as possible to save costs, unless the need for specific new features becomes more pressing. growing at +30% pa 1/2 of all access switches support PoE Still at around half of all ports = 51% 1/3 of all access switches support GE Increased to just less than half of all ports at 45% Increased to about a quarter of all posts at 23% 11% of all access switches support 10GB uplinks For example, if an organisation requires greater bandwidth to support pervasive wireless connectivity thanks to a host of new mobile devices brought to work by employees, it would have no choice but to refresh those devices sooner.
  • 25.
    22 network barometer report 2014 Are today’s networks prepared for trends such as enterprise mobility? 45% of access ports support gigabit Ethernet of access switches 10-gigabit uplinks we recommend Have an accurate inventory of your network estate. Regularly review your long-term network architecture requirements. Understand your ‘as-is’ state, define your ‘to-be’ state, and plan the steps of your journey to get there. power-over -Ethernet 23% 51% of access switches support support
  • 26.
    23 network barometer report 2014 Recommendations Given this year’s results, Dimension Data recommends that the most effective way to improve your network service levels and ensure maximum network availability is to invest in mature operational systems and support processes – particularly problem and change management – rather than refreshing technology simply for the sake of avoiding obsolescence. Figure 13: Dimension Data’s operational support maturity model Whether an organisation chooses to sweat its network assets as long as possible or if it decides to refresh some or all of its network, robust and mature operational support processes will ensure maximum availability. Moving towards the ‘optimised’ level doesn’t necessarily require you to have all capabilities in-house. In fact, many day-to- day IT operational requirements are not strategic to most organisations: knowing how to replace a fixed-access switch in the wiring closet doesn’t add to your organisation’s competitive advantage. In many cases, it’s best to partner with an expert provider of network managed or outsourcing services. This will free up your own IT resources to focus on strategic projects that substantially build your competitive advantage. As shown in Figure 13, and based on our experience in evaluating organisations’ operational support maturity, the vast majority (90%) of organisations are still at the first or second level of maturity. These levels are characterised by a lack of standard processes, ad hoc troubleshooting tools, and ambiguous roles and responsibilities for IT staff, resulting in extended network downtime and increased operational costs. These points notwithstanding, the primary requirement of the network is to deliver the services necessary to support business. Architectural trends such as cloud and enterprise mobility – and, eventually, software-defined networking – provide significant opportunities for organisations to improve employee productivity, increase sales, and shorten time-to-market. Therefore, the primary criterion for deciding whether to refresh your network is its ability to support business requirements – not whether the device is obsolete. In summary, the decision of whether or not to upgrade your network depends equally on your technical and architectural requirements, and the maturity of your operational support systems and processes. Dimension Data recommends the following approach to the technology refresh decision: Initial • ad hoc • undocumented • unpredictable • poorly controlled • reactive • no automation • roles and responsibilities undefined Repeatable • some documented processes • processes not uniformly used • some automation • limited definition of roles and responsibilities Defined • processes are proactive • automation exists for defined processes • roles are well defined • mature asset and change management processes Managed • set quality goals • guaranteed SLAs • monitoring and reporting • processes are integrated • automation tools are integrated • capacity planning Optimised • IT and business metric linkage • continuous service improvement • IT improves business process • business planning Complete lack of organisation Holding down the fort Well run cost centre Business alignment Business driver
  • 27.
    24 network barometer report 2014 Figure 14: The technology refresh decision tree Acquire additional support services Yes Can the organisation Yes effectively support the device? The starting point is visibility: gain a clear view of your infrastructure by creating and maintaining an accurate inventory of all your networking devices. Then, understand each device’s lifecycle status, security vulnerabilities, and future-readiness. Lastly, define your organisation’s capability and maturity in supporting and maintaining this crucial asset – your network – as the platform for your business. Do not refresh the device To help you with all your network assessment, maintenance, and support requirements, Dimension Data offers the following: • Technology Lifecycle Management Assessment • Network Optimisation Assessment • Network Architecture Consulting Workshop • IT Support Assessment • IT Service Management Assessment • Uptime and Insite Maintenance and Support Services • Managed Services for Enterprise Networks • IT outsourcing services for the network tower Is the device fit for purpose? Move the device to another part of the network Can it be moved to another part of the network? Refresh device Yes No No No The starting point is visibility: gain a clear view of your infrastructure by creating and maintaining an accurate inventory of all your networking devices.
  • 28.
    25 network barometer report 2014 Appendix A – sample distribution This appendix provides details about the sample data sets used for the information in this report. Technology lifecycle, type, and vulnerability data The technology lifecycle information published in this Report was gathered during the 2013 calendar year through Dimension Data’s Technology Lifecycle Management Assessments conducted for 288 clients around the world, covering 74,000 devices. This is a significantly larger sample size than last year, which covered 233 Assessments and 60,000 devices. Information from the Network Barometer Reports of 2009, 2010, 2011, 2012, and 2013 was gathered during the 2008, 2009, 2010, 2011 and 2012 calendar years respectively. Dimension Data’s Technology Lifecycle Management Assessment is a highly automated service that uses technology tools to scan our clients’ networks. The information gathered from these scans is analysed on a centralised portal, using a standardised process and framework. Figure 15: Percentage of nodes (devices) by organisation size Figure 16: Percentage of nodes (devices) by industry sector 12% This year, the data sample achieved greater balance among industry sectors. In previous years, there was some bias towards government; health care and education; and financial services, which together accounted for more than half of the sample set. This combined portion has shrunk significantly this year, with automotive and manufacturing, and consumer goods and retail, now occupying the top two positions. 2% 86% 12% Enterprise Enterprise Large Large Medium Small The majority of data came from enterprise and large organisations, reflecting Dimension Data’s client base. 19% 17% 11% 2% 3% Automotive and manufacturing Business services Construction and real estate Consumer goods and retail Financial services Government health care and education Media – entertainment and hospitality Resources – utilities and energy Service providers and telecommunications 6% 3% 5% 17% 5% Technology Travel and transportation 2% 86% 12% Medium Small
  • 29.
    26 network barometer report 2014 Figure 17: Percentage of nodes (devices), by region Figure 18: Number of assessments by country 53 This year’s report covered 32 countries in five regions. Spain South Africa Switzerland Singapore Philippines Nigeria New Zealand Netherlands Morocco Malaysia Kenya Japan Italy Indonesia India Hong Kong Germany France Czech Republic China Chile Canada Brazil Botswana Belgium Australia 10 3 2 3 6 1 6 10 17 3 23 1 4 1 6 28 2 4 8 1 2 4 6 29 12 Tanzania Thailand UAE Uganda UK US 3 2 2 1 17 18 18% 26% 29% Americas Asia Pacific Australia Europe Middle East & Africa 11% 16%
  • 30.
    Appendix B –services data 27 network barometer report 2014 This year, we introduced a new data set to corroborate the assessment results with helpdesk data. Our aim was to deepen our understanding of the business impact of obsolescence on network failures and downtime. We analysed over 91,000 service 58.8% incidents – or ‘trouble tickets’ – handled by four of our GSCs, to understand the types of incidents we’ve handled in maintaining our clients’ networks, and the relationship of these incidents to the lifecycle data. 17.8% Figure 19: Number of service incidents by region The analysis of the incident data was based on a subset of Dimension Data’s total maintenance base. We chose a selected set of network asset types in order to align with the technology aspects of this report, and account for the merging of systems following mergers and acquisitions. With just under a million devices creating an incident volume of almost 91,000, this represents a statistically relevant sample. 58.8% 17.8% Figure 20: Device type count, by region Americas Asia Australia Europe Middle East & Africa Overall 58,889 Table 3: Top 10 PSIRTs 17,854 7,174 14,069 29,702 21,632 76,486 153,905 Rank PSIRT title Count Penetration rate 137,117 131,831 228,961 Last year’s rank Published 1 Cisco IOS Software Network Address Translation Vulnerabilities – 112253 18 539 39% 3 28 September 2011 2 Cisco IOS Software Multiple Features Crafted UDP Packet Vulnerability – 108558 17 561 37% 5 25 March 2009 3 Cisco VLAN Trunking Protocol Vulnerability – 108203 14 336 30% 7 6 November 2008 4 TCP State Manipulation Denial of Service Vulnerabilities in Multiple Cisco Products – IOS – 109444 14 052 29% 1 1 September 2009 5 Cisco IOS Software Command Authorization Bypass – null 13 675 29% 2 29 March 2012 6 Cisco IOS Cross-Site Scripting Vulnerabilities – 98605 14 584 28% 6 6 February 2009 7 Cisco IOS Software Multicast Source Discovery Protocol Vulnerability – null 11 632 24% 4 29 March 2012 8 Cisco IOS Software Tunnels Vulnerability - CSCsx70889 – 109482 11 157 23% 9 28 September 2009 9 Cisco IOS Software Multiple Features IP Sockets Vulnerability – 109333 11 052 23% 8 25 March 2009 10 Cisco IOS Software DHCP Version 6 Server Denial of Service Vulnerability – null 10 453 22% N/A 18 October 2012 2010 2011 2012 2013 2014 3.9% 10.1% 90.8% Americas Asia Pacific Europe Middle East & Africa Total 3,990 10,123 90,856 Americas Asia Australia Europe Middle East & Africa 2010 2011 2012 2013 2014 3.9% 10.1% 90.8% Middle East Total & Africa Americas Asia Pacific Europe 4.596 4,639 10,997 165,871 227.025 423,565
  • 31.
    28 network barometer report 2014 List of acronyms GSC Global Service Centre (Dimension Data) ICT information and communication technology MEA Middle East & Africa PSIRT Product Security Incident Response Team List of figures Figure 1: Percentage of ageing and obsolete devices, global average Figure 2: Percentage of ageing and obsolete devices by region Figure 3: Percentage of ageing and obsolete devices by industry Figure 4: Percentage of devices by lifecycle stage in the Network Barometer Report 2013 Figure 5: Percentage of devices by lifecycle stage in the Network Barometer Report 2014 Figure 6: Covered assets by lifecycle stage Figure 7: Incidents by resolution category Figure 8: Device failure rate by lifecycle stage Figure 9: Mean-time-to-repair by lifecycle stage Figure 10: Number of PSIRTs announced per year Figure 11: Percentage of devices with PSIRTs by region Figure 12: From wired to wireless – the architecture of current versus future networks Figure 13: Dimension Data’s operational support maturity model Figure 14: The technology refresh decision tree Figure 15: Percentage of nodes (devices) by organisation size Figure 16: Percentage of nodes (devices) by industry sector Figure 17: Percentage of nodes (devices) by region Figure 18: Number of assessments by country Figure 19: Number of service incidents by region Figure 20: Device type count by region List of tables Table 1: Technology lifecycle stages, associated risk levels, and required support environment maturity Table 2: Percentage of devices by lifecycle stage, by incident Table 3: Top 10 PSIRTs
  • 32.
    Middle East &Africa Algeria · Angola Botswana · Congo · Burundi Democratic Republic of the Congo Gabon · Ghana · Kenya Malawi · Mauritius · Morocco Mozambique · Namibia · Nigeria Oman · Rwanda · Saudi Arabia South Africa Tanzania · Uganda United Arab Emirates · Zambia Asia China · Hong Kong India · Indonesia · Japan Korea · Malaysia New Zealand · Philippines Singapore · Taiwan Thailand · Vietnam Australia Australian Capital Territory New South Wales · Queensland South Australia · Victoria Western Australia Europe Austria · Belgium Czech Republic · France Germany · Hungary Ireland · Italy Luxembourg · Netherlands Poland · Portugal Slovakia · Spain · Turkey · United Kingdom Switzerland Americas Brazil · Canada · Chile Mexico · United States For contact details in your region please visit www.dimensiondata.com/globalpresence