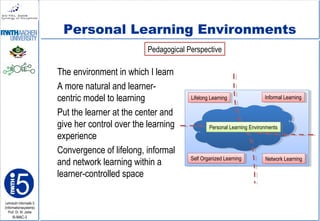
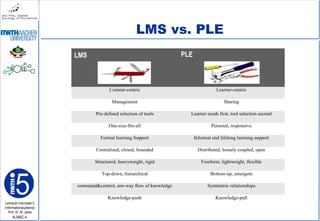
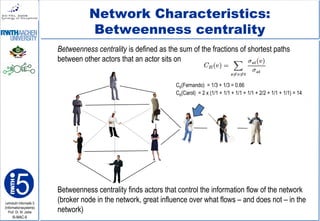
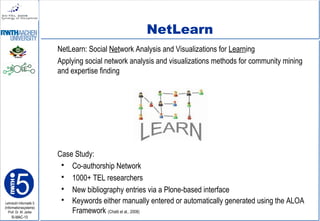
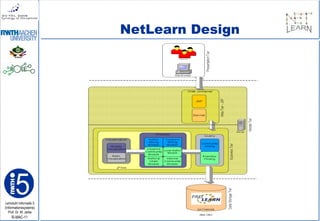
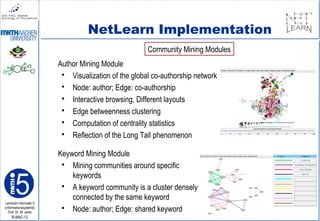
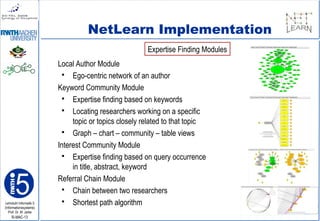
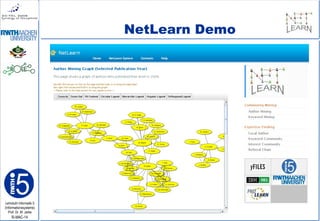
Lehrstuhl Informatik 5
(Informationssysteme)
Prof. Dr. M. Jarke
I5-MAC-1
NetLearn: Social Network Analysis
and Visualizations for Learning
Mohamed Amine Chatti, Matthias Jarke, Theresia Devi Indriasari
RWTH Aachen University, Germany
Marcus Specht
Open University Heerlen, Netherlands
ECTEL 2009
Nice, October 1, 2009
Lehrstuhl Informatik 5
(Informationssysteme)
Prof. Dr. M. Jarke
I5-MAC-2
Agenda
Personal Learning Environments
Community mining & Expertise finding
Social Network Analysis and Visualizations
NetLearn
Lehrstuhl Informatik 5
(Informationssysteme)
Prof. Dr. M. Jarke
I5-MAC-3
Personal Learning Environments
The environment in which I learn
A more natural and learner-
centric model to learning
Put the learner at the center and
give her control over the learning
experience
Convergence of lifelong, informal
and network learning within a
learner-controlled space
Lifelong LearningLifelong Learning Informal LearningInformal Learning
Self Organized LearningSelf Organized Learning Network LearningNetwork Learning
Personal Learning EnvironmentsPersonal Learning Environments
Pedagogical Perspective
Lehrstuhl Informatik 5
(Informationssysteme)
Prof. Dr. M. Jarke
I5-MAC-4
LMS vs. PLE
LMS PLE
Content-centric Learner-centric
Management Sharing
Pre-defined selection of tools Learner needs first, tool selection second
One-size-fits-all Personal, responsive
Formal learning Support Informal and lifelong learning support
Centralized, closed, bounded Distributed, loosely coupled, open
Structured, heavyweight, rigid Freeform, lightweight, flexible
Top-down, hierarchical Bottom-up, emergent
command&control, one-way flow of knowledge Symmetric relationships
Knowledge-push Knowledge-pull
Lehrstuhl Informatik 5
(Informationssysteme)
Prof. Dr. M. Jarke
I5-MAC-5
PLE: From knowledge-push to knowledge-pull
Get knowledge to learners
Knowledge overload
Need for filters to help learners find quality knowledge nodes
Explicit knowledge (information) vs. Tacit knowledge (people) (Nonaka&Takeuchi, 1995)
Need for community/network mining and expertise finding mechanisms
From Scarcity to Abundance
(Seely Brown, 1999)
Lehrstuhl Informatik 5
(Informationssysteme)
Prof. Dr. M. Jarke
I5-MAC-6
Social Network Analysis &
Visualizations
Social Network Analysis (SNA) is the quantitative study of the relationships between
individuals or organizations (Wasserman&Faust, 1994)
A Graph G = (V , E)
where V = {1, 2, …., n} is a set of nodes (vertices)
E V x V is a set of edges (arcs, links, ties)⊆
Centrality measures:
degree, closeness, and betweenness
centrality
Social Networks Visualization
 Node-link diagrams
 Matrix-based
Lehrstuhl Informatik 5
(Informationssysteme)
Prof. Dr. M. Jarke
I5-MAC-7
Network Characteristics:
Degree centrality
The degree centrality of a vertex v V is simply the degree of that vertex∈
Degree of a vertex: number of incoming and outgoing edges
 in-degree
 out-degree
The degree centrality finds the actor with the most influence over the network
(popularity of an actor, connector, hub)
CD(Fernando) = 6
Lehrstuhl Informatik 5
(Informationssysteme)
Prof. Dr. M. Jarke
I5-MAC-8
Network Characteristics:
Closeness centrality
Closeness centrality is defined as inverse closeness, i.e., the sum of the distances
(shortest paths) to all other vertices
Closeness centrality focuses on how close an actor is to all the other actors in the
network (finds actors with the best visibility into what is happening in the network)
Cc(Fernando) = 1/15
Cc(Andre) = Cc(Jane) = 1/14
Lehrstuhl Informatik 5
(Informationssysteme)
Prof. Dr. M. Jarke
I5-MAC-9
Network Characteristics:
Betweenness centrality
Betweenness centrality is defined as the sum of the fractions of shortest paths
between other actors that an actor sits on
Betweenness centrality finds actors that control the information flow of the network
(broker node in the network, great influence over what flows – and does not – in the
network)
CB(Fernando) = 1/3 + 1/3 = 0.66
CB(Carol) = 2 x (1/1 + 1/1 + 1/1 + 1/1 + 2/2 + 1/1 + 1/1) = 14
Lehrstuhl Informatik 5
(Informationssysteme)
Prof. Dr. M. Jarke
I5-MAC-10
NetLearn
NetLearn: Social Network Analysis and Visualizations for Learning
Applying social network analysis and visualizations methods for community mining
and expertise finding
Case Study:
 Co-authorship Network
 1000+ TEL researchers
 New bibliography entries via a Plone-based interface
 Keywords either manually entered or automatically generated using the ALOA
Framework (Chatti et al., 2008)
Lehrstuhl Informatik 5
(Informationssysteme)
Prof. Dr. M. Jarke
I5-MAC-11
NetLearn Design
Lehrstuhl Informatik 5
(Informationssysteme)
Prof. Dr. M. Jarke
I5-MAC-12
NetLearn Implementation
Author Mining Module
 Visualization of the global co-authorship network
 Node: author; Edge: co-authorship
 Interactive browsing, Different layouts
 Edge betweenness clustering
 Computation of centrality statistics
 Reflection of the Long Tail phenomenon
Keyword Mining Module
 Mining communities around specific
keywords
 A keyword community is a cluster densely
connected by the same keyword
 Node: author; Edge: shared keyword
Community Mining Modules
Lehrstuhl Informatik 5
(Informationssysteme)
Prof. Dr. M. Jarke
I5-MAC-13
NetLearn Implementation
Local Author Module
 Ego-centric network of an author
Keyword Community Module
 Expertise finding based on keywords
 Locating researchers working on a specific
topic or topics closely related to that topic
 Graph – chart – community – table views
Interest Community Module
 Expertise finding based on query occurrence
in title, abstract, keyword
Referral Chain Module
 Chain between two researchers
 Shortest path algorithm
Expertise Finding Modules
Lehrstuhl Informatik 5
(Informationssysteme)
Prof. Dr. M. Jarke
I5-MAC-14
NetLearn Demo
Lehrstuhl Informatik 5
(Informationssysteme)
Prof. Dr. M. Jarke
I5-MAC-15
Thank You!

NetLearn: Social Network Analysis and Visualizations for Learning

  • 1.
    Lehrstuhl Informatik 5 (Informationssysteme) Prof.Dr. M. Jarke I5-MAC-1 NetLearn: Social Network Analysis and Visualizations for Learning Mohamed Amine Chatti, Matthias Jarke, Theresia Devi Indriasari RWTH Aachen University, Germany Marcus Specht Open University Heerlen, Netherlands ECTEL 2009 Nice, October 1, 2009
  • 2.
    Lehrstuhl Informatik 5 (Informationssysteme) Prof.Dr. M. Jarke I5-MAC-2 Agenda Personal Learning Environments Community mining & Expertise finding Social Network Analysis and Visualizations NetLearn
  • 3.
    Lehrstuhl Informatik 5 (Informationssysteme) Prof.Dr. M. Jarke I5-MAC-3 Personal Learning Environments The environment in which I learn A more natural and learner- centric model to learning Put the learner at the center and give her control over the learning experience Convergence of lifelong, informal and network learning within a learner-controlled space Lifelong LearningLifelong Learning Informal LearningInformal Learning Self Organized LearningSelf Organized Learning Network LearningNetwork Learning Personal Learning EnvironmentsPersonal Learning Environments Pedagogical Perspective
  • 4.
    Lehrstuhl Informatik 5 (Informationssysteme) Prof.Dr. M. Jarke I5-MAC-4 LMS vs. PLE LMS PLE Content-centric Learner-centric Management Sharing Pre-defined selection of tools Learner needs first, tool selection second One-size-fits-all Personal, responsive Formal learning Support Informal and lifelong learning support Centralized, closed, bounded Distributed, loosely coupled, open Structured, heavyweight, rigid Freeform, lightweight, flexible Top-down, hierarchical Bottom-up, emergent command&control, one-way flow of knowledge Symmetric relationships Knowledge-push Knowledge-pull
  • 5.
    Lehrstuhl Informatik 5 (Informationssysteme) Prof.Dr. M. Jarke I5-MAC-5 PLE: From knowledge-push to knowledge-pull Get knowledge to learners Knowledge overload Need for filters to help learners find quality knowledge nodes Explicit knowledge (information) vs. Tacit knowledge (people) (Nonaka&Takeuchi, 1995) Need for community/network mining and expertise finding mechanisms From Scarcity to Abundance (Seely Brown, 1999)
  • 6.
    Lehrstuhl Informatik 5 (Informationssysteme) Prof.Dr. M. Jarke I5-MAC-6 Social Network Analysis & Visualizations Social Network Analysis (SNA) is the quantitative study of the relationships between individuals or organizations (Wasserman&Faust, 1994) A Graph G = (V , E) where V = {1, 2, …., n} is a set of nodes (vertices) E V x V is a set of edges (arcs, links, ties)⊆ Centrality measures: degree, closeness, and betweenness centrality Social Networks Visualization  Node-link diagrams  Matrix-based
  • 7.
    Lehrstuhl Informatik 5 (Informationssysteme) Prof.Dr. M. Jarke I5-MAC-7 Network Characteristics: Degree centrality The degree centrality of a vertex v V is simply the degree of that vertex∈ Degree of a vertex: number of incoming and outgoing edges  in-degree  out-degree The degree centrality finds the actor with the most influence over the network (popularity of an actor, connector, hub) CD(Fernando) = 6
  • 8.
    Lehrstuhl Informatik 5 (Informationssysteme) Prof.Dr. M. Jarke I5-MAC-8 Network Characteristics: Closeness centrality Closeness centrality is defined as inverse closeness, i.e., the sum of the distances (shortest paths) to all other vertices Closeness centrality focuses on how close an actor is to all the other actors in the network (finds actors with the best visibility into what is happening in the network) Cc(Fernando) = 1/15 Cc(Andre) = Cc(Jane) = 1/14
  • 9.
    Lehrstuhl Informatik 5 (Informationssysteme) Prof.Dr. M. Jarke I5-MAC-9 Network Characteristics: Betweenness centrality Betweenness centrality is defined as the sum of the fractions of shortest paths between other actors that an actor sits on Betweenness centrality finds actors that control the information flow of the network (broker node in the network, great influence over what flows – and does not – in the network) CB(Fernando) = 1/3 + 1/3 = 0.66 CB(Carol) = 2 x (1/1 + 1/1 + 1/1 + 1/1 + 2/2 + 1/1 + 1/1) = 14
  • 10.
    Lehrstuhl Informatik 5 (Informationssysteme) Prof.Dr. M. Jarke I5-MAC-10 NetLearn NetLearn: Social Network Analysis and Visualizations for Learning Applying social network analysis and visualizations methods for community mining and expertise finding Case Study:  Co-authorship Network  1000+ TEL researchers  New bibliography entries via a Plone-based interface  Keywords either manually entered or automatically generated using the ALOA Framework (Chatti et al., 2008)
  • 11.
    Lehrstuhl Informatik 5 (Informationssysteme) Prof.Dr. M. Jarke I5-MAC-11 NetLearn Design
  • 12.
    Lehrstuhl Informatik 5 (Informationssysteme) Prof.Dr. M. Jarke I5-MAC-12 NetLearn Implementation Author Mining Module  Visualization of the global co-authorship network  Node: author; Edge: co-authorship  Interactive browsing, Different layouts  Edge betweenness clustering  Computation of centrality statistics  Reflection of the Long Tail phenomenon Keyword Mining Module  Mining communities around specific keywords  A keyword community is a cluster densely connected by the same keyword  Node: author; Edge: shared keyword Community Mining Modules
  • 13.
    Lehrstuhl Informatik 5 (Informationssysteme) Prof.Dr. M. Jarke I5-MAC-13 NetLearn Implementation Local Author Module  Ego-centric network of an author Keyword Community Module  Expertise finding based on keywords  Locating researchers working on a specific topic or topics closely related to that topic  Graph – chart – community – table views Interest Community Module  Expertise finding based on query occurrence in title, abstract, keyword Referral Chain Module  Chain between two researchers  Shortest path algorithm Expertise Finding Modules
  • 14.
    Lehrstuhl Informatik 5 (Informationssysteme) Prof.Dr. M. Jarke I5-MAC-14 NetLearn Demo
  • 15.
    Lehrstuhl Informatik 5 (Informationssysteme) Prof.Dr. M. Jarke I5-MAC-15 Thank You!