Net Lease Casual Dining Research Report | The Boulder Group
•
1 like•107 views

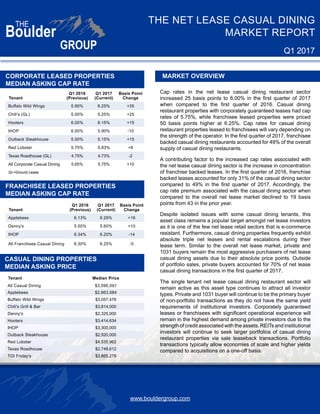
Cap rates for casual dining restaurant properties increased in Q1 2017 compared to Q1 2016. Properties leased to franchisees had higher cap rates than corporately-guaranteed leases, around 6.25% compared to 5.75%. Franchise-backed leases accounted for 49% of casual dining properties in Q1 2017 compared to 31% in Q1 2016. Private and 1031 exchange buyers remain the most active purchasers of net lease casual dining properties due to favorable price points. REITs and institutions seek larger portfolio purchases for economies of scale and higher yields.

More Related Content
What's hot
What's hot (17)
Similar to Net Lease Casual Dining Research Report | The Boulder Group
Similar to Net Lease Casual Dining Research Report | The Boulder Group (20)
More from The Boulder Group
More from The Boulder Group (17)
Recently uploaded
Recently uploaded (20)
Net Lease Casual Dining Research Report | The Boulder Group
- 1. www.bouldergroup.com THE NET LEASE CASUAL DINING MARKET REPORT Q1 2017 FRANCHISEE LEASED PROPERTIES MEDIAN ASKING CAP RATE MARKET OVERVIEW Cap rates in the net lease casual dining restaurant sector increased 25 basis points to 6.00% in the first quarter of 2017 when compared to the first quarter of 2016. Casual dining restaurant properties with corporately guaranteed leases had cap rates of 5.75%, while franchisee leased properties were priced 50 basis points higher at 6.25%. Cap rates for casual dining restaurant properties leased to franchisees will vary depending on the strength of the operator. In the first quarter of 2017, franchisee backed casual dining restaurants accounted for 49% of the overall supply of casual dining restaurants. A contributing factor to the increased cap rates associated with the net lease casual dining sector is the increase in concentration of franchise backed leases. In the first quarter of 2016, franchise backed leases accounted for only 31% of the casual dining sector compared to 49% in the first quarter of 2017. Accordingly, the cap rate premium associated with the casual dining sector when compared to the overall net lease market declined to 19 basis points from 43 in the prior year. Despite isolated issues with some casual dining tenants, this asset class remains a popular target amongst net lease investors as it is one of the few net lease retail sectors that is e-commerce resistant. Furthermore, casual dining properties frequently exhibit absolute triple net leases and rental escalations during their lease term. Similar to the overall net lease market, private and 1031 buyers remain the most aggressive purchasers of net lease casual dining assets due to their absolute price points. Outside of portfolio sales, private buyers accounted for 70% of net lease casual dining transactions in the first quarter of 2017. The single tenant net lease casual dining restaurant sector will remain active as this asset type continues to attract all investor types. Private and 1031 buyer will continue to be the primary buyer of non-portfolio transactions as they do not have the same yield requirements of institutional investors. Corporately guaranteed leases or franchisees with significant operational experience will remain in the highest demand among private investors due to the strength of credit associated with the assets. REITs and institutional investors will continue to seek larger portfolios of casual dining restaurant properties via sale leaseback transactions. Portfolio transactions typically allow economies of scale and higher yields compared to acquisitions on a one-off basis. CASUAL DINING PROPERTIES MEDIAN ASKING PRICE Tenant Median Price All Casual Dining $3,596,091 Applebees $2,863,584 Buffalo Wild Wings $3,057,476 Chili's Grill & Bar $3,814,000 Denny's $2,325,000 Hooters $3,414,634 IHOP $3,300,000 Outback Steakhouse $2,920,000 Red Lobster $4,535,962 Texas Roadhouse $2,748,612 TGI Friday's $3,865,278 CORPORATE LEASED PROPERTIES MEDIAN ASKING CAP RATE Q1 2016 Q1 2017 Basis Point Tenant (Previous) (Current) Change Buffalo Wild Wings 5.90% 6.25% +35 Chili's (GL) 5.00% 5.25% +25 Hooters 6.00% 6.15% +15 IHOP 6.00% 5.90% -10 Outback Steakhouse 5.00% 5.15% +15 Red Lobster 5.75% 5.83% +8 Texas Roadhouse (GL) 4.75% 4.73% -2 All Corporate Casual Dining 5.65% 5.75% +10 GL=Ground Lease Q1 2016 Q1 2017 Basis Point Tenant (Previous) (Current) Change Applebees 6.13% 6.29% +16 Denny's 5.50% 5.60% +10 IHOP 6.34% 6.20% -14 All Franchisee Casual Dining 6.30% 6.25% -5
- 2. www.bouldergroup.com THE NET LEASE CASUAL DINING MARKET REPORT Q1 2017 CASUAL DINING MEDIAN ASKING CAP RATE BY REGION WEST MOUNTAIN MIDWEST SOUTH NORTHEAST NORTHEAST SOUTH MIDWEST MOUNTAIN WEST 5.95% 6.08% 5.67% 6.05% 5.30% Sale Date Tenant City State Price Price/SF Cap Rate Lease Term Remaining Dec-16 Red Lobster Mesa AZ $6,665,143 $798 5.80% 23 Dec-16 Outback Steakhouse Ellicott City MD $6,200,000 $931 5.55% 15 Dec-16 Golden Corral Houston TX $6,000,000 $480 6.25% 20 Feb-17 Chili's Rosemont IL $5,965,219 $1,061 6.40% 14 Dec-16 Red Lobster Pensacola FL $5,300,100 $639 5.68% 23 Dec-16 Outback Steakhouse Tampa FL $4,745,727 $770 5.50% 15 Mar-17 Golden Corral North Highlands CA $4,502,500 $322 6.15% 19 Mar-17 Applebee's Racine WI $4,475,000 $613 5.75% 15 Jan-17 Applebee's Mesa AZ $3,820,000 $724 6.00% 13 Feb-17 Denny's Riverside CA $3,535,000 $955 4.66% 20 Jan-17 Outback Steakhouse Baton Rouge LA $3,500,000 $569 6.32% 15 Dec-16 Applebee's (GL) Brownsville TX $3,425,000 $665 5.82% 20 Feb-17 LongHorn Steakhouse (GL) Victor NY $2,950,000 $493 4.58% 10 Dec-16 Golden Corral Sioux City IA $2,830,000 $255 7.00% 15 Jan-17 Ruby Tuesday Mccomb MS $2,350,000 $457 6.50% 11 Feb-17 Golden Corral Tucson AZ $2,236,842 $217 7.00% 15 Jan-17 Buffalo Wild Wings Leavenworth KS $2,112,000 $422 6.04% 9 Mar-17 Chili's Saint Peters MO $2,063,333 $373 6.00% 17 Dec-16 Bob Evans Port Charlotte FL $1,904,000 $353 4.87% 19 SELECTED SINGLE TENANT SALES COMPARABLES
- 3. www.bouldergroup.com THE NET LEASE CASUAL DINING MARKET REPORT Q1 2017 CASUAL DINING VS RETAIL NET LEASE MARKET CAP RATES MEDIAN ASKING CAP RATE BY LEASE TERM REMAINING Lease Term Remaining Cap Rate 20+ 5.55% 15-19 5.75% 10-14 6.25% 5-9 6.35% Under 5 6.75% MEDIAN NATIONAL CLOSED CAP RATE SPREAD CASUAL DINING ASKING CAP RATE BY GUARANTOR Spread Sector Closed Asking (bps) Casual Dining 5.76% 5.45% 31 Corporate Franchisee Spread Cap Rate Cap Rate (bps) 5.75% 6.25% 50 © 2017. The Boulder Group. Information herein has been obtained from databases owned and maintained by The Boulder Group as well as third party sources. We have not verified the information and we make no guarantee, warranty or representation about it. This information is provided for general illustrative purposes and not for any specific recommendation or purpose nor under any circumstances shall any of the above information be deemed legal advice or counsel. Reliance on this information is at the risk of the reader and The Boulder Group expressly disclaims any liability arising from the use of such information. This information is designed exclusively for use by The Boulder Group clients and cannot be reproduced, retransmitted or distributed without the express written consent of The Boulder Group. FOR MORE INFORMATION AUTHOR John Feeney | Vice President john@bouldergroup.com Randy Blankstein | President randy@bouldergroup.com Jimmy Goodman | Partner jimmy@bouldergroup.com Asher Wenig | Vice President asher@bouldergroup.com CONTRIBUTORS Scott Harris | Analyst scott@bouldergroup.com Q1 2016 Q1 2017 Sector (Previous) (Current) Casual Dining Sector 5.75% 6.00% Retail Net Lease Market 6.18% 6.19% Casual Dining Premium (bps) 43 19