SlideShare a Scribd company logo
www.bouldergroup.com
THE NET LEASE QSR
MARKET REPORT
Q2 2017
QSR (FRANCHISEE) PROPERTIES
MEDIAN ASKING CAP RATES
MARKET OVERVIEW
QSR PROPERTIES MEDIAN
ASKING PRICE
	
Median
Tenant Price
All QSR $2,356,560
Burger King $2,350,000
Chick Fil A (Ground Lease) $3,100,000
Dunkin Donuts $1,943,000
KFC $1,428,000
McDonald's (Ground Lease) $2,251,500
Panera Bread $2,888,889
Pizza Hut $783,000
Starbucks $2,717,000
Taco Bell $1,595,000
Wendy's $2,198,180
QSR (CORPORATE) PROPERTIES
MEDIAN ASKING CAP RATES	
Tenant Q2 2016
(Previous)
Q2 2017
(Current)
Basis Point
Change
All Corporate QSR 5.45% 5.35% -10
Chick Fil A (Ground Lease) 4.00% 4.00% 0
McDonald's (Ground Lease) 4.10% 4.00% -10
Panera Bread 5.10% 5.00% -10
Starbucks 5.05% 5.10% +5
	
Tenant Q2 2016
(Previous)
Q2 2017
(Current)
Basis Point
Change
All Franchisee QSR 5.80% 5.75% -5
Burger King 5.80% 5.75% -5
Dunkin Donuts 5.15% 5.25% +10
KFC 5.73% 6.00% +27
Pizza Hut 6.00% 6.35% +35
Taco Bell 5.63% 5.70% +7
Wendy's 5.60% 5.75% +15
Cap rates in the net lease quick service restaurant (QSR) sector
declined to 5.56% in the second quarter of 2017 representing a 14
basis point decline when compared to the prior year. Cap rates for
corporate leased QSR properties decreased by 10 basis points to a
5.35% cap rate while QSR properties leased to franchisees declined
by 5 basis points to a 5.75% cap rate. The 14 basis points of cap rate
compression within the net lease QSR sector occurred during the same
time period when cap rates for the net lease retail sector increased by
5 basis points. The recent inverse cap rate trend between the overall
retail and QSR sectors can be attributed to the influx of investors to
this sub-sector. Investors continue to target the QSR sector as it is
e-commerce resistant and is a popular alternative for 1031 investors
when compared to other low priced net lease properties.
New construction QSR properties are in the greatest demand amongst
investors as they exhibit the criteria that many 1031 exchange and
private buyers seek. 1031 exchange and private buyers target
single tenant QSR properties as the typical lease structures of QSR
properties are attractive. The vast majority of QSR properties exhibit
absolute NNN leases with scheduled rental escalations in the primary
term. QSR properties constructed in the past two years experienced
significant compression when compared to the prior year. In the
second quarter of 2017, QSR properties constructed in the past two
years had asking cap rates of 5.25%. This represented a 15 basis
point decline when compared to the second quarter of 2016. In the
first two quarters of 2017, more than 75% of the QSR properties sold
were purchased by private buyers.
The QSR sector differs from other sub-sectors within net lease as
the majority of the properties are leased to franchisees rather than
corporate entities. Cap rates for franchisee leased properties can vary
significantly as lease guarantors can range from franchisees with less
than ten locations to large franchisees with hundreds of locations.
Corporately guaranteed QSR properties were priced at a 40 basis
point premium over franchisee backed properties.
The single tenant net lease QSR sector will continue to garner investor
demand as the many investors have shifted their attention to assets
in e-commerce resistant arenas. Furthermore, 1031 exchange and
private buyers will continue to seek these assets as they offer low
price point acquisition targets with long term leases, rental escalations
and zero landlord responsibilities.
www.bouldergroup.com
THE NET LEASE QSR
MARKET REPORT
Q2 2017
NET LEASE QSR PROPERTIES MEDIAN ASKING CAP RATE BY REGION
WEST
MOUNTAIN
MIDWEST
SOUTH
NORTHEAST
NORTHEAST
SOUTH
MIDWEST
MOUNTAIN
WEST
5.58%
5.42%
5.40%
5.85%
4.41%
Tenant Total Number of Locations Ticker Symbol Market Cap
Arby's 3,400 Private Private
Burger King 15,000 QSR $27 B
Carl's Jr. 1,385 Private Private
Chick Fil A 2,170 Private Private
Chipotle 2,330 CMG $9.8 B
Dunkin' Donuts 11,000+ DNKN $5.1 B
Hardee's 1,860 Private Private
Jack in the Box 2,255 JACK $2.7 B
KFC 19,950 YUM $26 B
McDonald's 35,000+ MCD $125 B
Panda Express 1,910 Private Private
Panera Bread 2,045 PNRA $7.1 B
Pizza Hut 16,400 YUM $35 B
Popeyes 2,730 PLKI $1.6 B
Sonic Drive-In 3,550 SONC $1.1 B
Starbucks 24,465 SBUX $80 B
Taco Bell 6,975 YUM $35 B
Wendy's 6,500 WEN $3.8 B
Whataburger 815 Private Private
SELECTED COMPANY COMPARISON
Leases can be guaranteed by franchisees or corporations.
www.bouldergroup.com
THE NET LEASE QSR
MARKET REPORT
Q2 2017
© 2017. The Boulder Group. Information herein has been obtained from databases owned and maintained by The Boulder Group as well as third party sources. We have not verified the information
and we make no guarantee, warranty or representation about it. This information is provided for general illustrative purposes and not for any specific recommendation or purpose nor under any
circumstances shall any of the above information be deemed legal advice or counsel. Reliance on this information is at the risk of the reader and The Boulder Group expressly disclaims any liability
arising from the use of such information. This information is designed exclusively for use by The Boulder Group clients and cannot be reproduced, retransmitted or distributed without the express
written consent of The Boulder Group.
QSR VS RETAIL NET LEASE MARKET
CAP RATES
ASKING CAP RATE BY
LEASE TERM REMAINING
	
Q2 2016 Q2 2017
Sector (Previous) (Current)
QSR Sector 5.70% 5.56%
Retail Net Lease Market 6.18% 6.23%
QSR Premium (bps) 48 67
	
Lease Term Remaining Cap Rate
20+ 5.35%
15-19 5.45%
10-14 5.75%
Under 10 6.35%
MEDIAN NATIONAL CLOSED CAP RATE
SPREAD
QSR ASKING CAP RATE BY
GUARANTOR
	
Spread
Sector Closed Asking (bps)
QSR Sector 5.66% 5.40% 26
	
Corporate Franchise Spread
Cap Rate Cap Rate (bps)
5.35% 5.75% -40
FOR MORE INFORMATION
AUTHOR
John Feeney | Vice President
john@bouldergroup.com
Randy Blankstein | President
randy@bouldergroup.com
Jimmy Goodman | Partner
jimmy@bouldergroup.com
Asher Wenig | Vice President
asher@bouldergroup.com
CONTRIBUTORS
Scott Harris | Analyst
scott@bouldergroup.com

More Related Content

What's hot

Net Lease Investment Outlook
Net Lease Investment OutlookNet Lease Investment Outlook
Net Lease Investment Outlook
The Boulder Group
 
#2: “Airbnb and Short Term Rentals Overview and Discussion” by the Chapel Hil...
#2: “Airbnb and Short Term Rentals Overview and Discussion” by the Chapel Hil...#2: “Airbnb and Short Term Rentals Overview and Discussion” by the Chapel Hil...
#2: “Airbnb and Short Term Rentals Overview and Discussion” by the Chapel Hil...
The Chamber For a Greater Chapel Hill-Carrboro
 
NNN Property For Sale
NNN Property For SaleNNN Property For Sale
NNN Property For Sale
The Boulder Group
 
Chicagoland NNN Retail For Sale - Yorkhouse Commons
Chicagoland NNN Retail For Sale  - Yorkhouse CommonsChicagoland NNN Retail For Sale  - Yorkhouse Commons
Chicagoland NNN Retail For Sale - Yorkhouse CommonsAnand Bhatt
 
2Q2016_MarketNews_LOS
2Q2016_MarketNews_LOS2Q2016_MarketNews_LOS
2Q2016_MarketNews_LOSMark Dodson
 
National Net Lease Portfolio | The Boulder Group
National Net Lease Portfolio | The Boulder GroupNational Net Lease Portfolio | The Boulder Group
National Net Lease Portfolio | The Boulder Group
The Boulder Group
 
NNN Properties for Sale -The Boulder Group
NNN Properties for Sale -The Boulder GroupNNN Properties for Sale -The Boulder Group
NNN Properties for Sale -The Boulder Group
The Boulder Group
 

What's hot (7)

Net Lease Investment Outlook
Net Lease Investment OutlookNet Lease Investment Outlook
Net Lease Investment Outlook
 
#2: “Airbnb and Short Term Rentals Overview and Discussion” by the Chapel Hil...
#2: “Airbnb and Short Term Rentals Overview and Discussion” by the Chapel Hil...#2: “Airbnb and Short Term Rentals Overview and Discussion” by the Chapel Hil...
#2: “Airbnb and Short Term Rentals Overview and Discussion” by the Chapel Hil...
 
NNN Property For Sale
NNN Property For SaleNNN Property For Sale
NNN Property For Sale
 
Chicagoland NNN Retail For Sale - Yorkhouse Commons
Chicagoland NNN Retail For Sale  - Yorkhouse CommonsChicagoland NNN Retail For Sale  - Yorkhouse Commons
Chicagoland NNN Retail For Sale - Yorkhouse Commons
 
2Q2016_MarketNews_LOS
2Q2016_MarketNews_LOS2Q2016_MarketNews_LOS
2Q2016_MarketNews_LOS
 
National Net Lease Portfolio | The Boulder Group
National Net Lease Portfolio | The Boulder GroupNational Net Lease Portfolio | The Boulder Group
National Net Lease Portfolio | The Boulder Group
 
NNN Properties for Sale -The Boulder Group
NNN Properties for Sale -The Boulder GroupNNN Properties for Sale -The Boulder Group
NNN Properties for Sale -The Boulder Group
 

Similar to Net Lease QSR Research Report

Net Lease Research Report 2016 Q1 | The Boulder Group
 Net Lease Research Report  2016 Q1 | The Boulder Group Net Lease Research Report  2016 Q1 | The Boulder Group
Net Lease Research Report 2016 Q1 | The Boulder Group
The Boulder Group
 
Net Lease Research report q2 2017
Net Lease Research report q2 2017Net Lease Research report q2 2017
Net Lease Research report q2 2017
The Boulder Group
 
Net Lease Casual Dining Report 2018 | The Boulder Group
Net Lease Casual Dining  Report 2018 | The Boulder GroupNet Lease Casual Dining  Report 2018 | The Boulder Group
Net Lease Casual Dining Report 2018 | The Boulder Group
The Boulder Group
 
Rental Drivers & The Power of the Penny
Rental Drivers & The Power of the PennyRental Drivers & The Power of the Penny
Rental Drivers & The Power of the Penny
Andrew Cranmer
 
Net Leased Bank Report Q1 2019
Net Leased Bank Report Q1 2019Net Leased Bank Report Q1 2019
Net Leased Bank Report Q1 2019
The Boulder Group
 
Net Lease Big Box Research Report | The Boulder Group
Net Lease Big Box Research Report | The Boulder GroupNet Lease Big Box Research Report | The Boulder Group
Net Lease Big Box Research Report | The Boulder Group
The Boulder Group
 
Net lease-bank-ground-lease-research-report
Net lease-bank-ground-lease-research-reportNet lease-bank-ground-lease-research-report
Net lease-bank-ground-lease-research-report
The Boulder Group
 
Net Lease Medical Research Report 2018
Net Lease Medical Research Report 2018Net Lease Medical Research Report 2018
Net Lease Medical Research Report 2018
The Boulder Group
 
net lease research report q1 2018 | The Boulder Group
net lease research report q1 2018 | The Boulder Groupnet lease research report q1 2018 | The Boulder Group
net lease research report q1 2018 | The Boulder Group
The Boulder Group
 
The Boulder Group Publishes 4th Quarter Net Lease Market Research Report
The Boulder Group Publishes 4th Quarter Net Lease Market Research ReportThe Boulder Group Publishes 4th Quarter Net Lease Market Research Report
The Boulder Group Publishes 4th Quarter Net Lease Market Research Report
The Boulder Group
 
net lease bank report
net lease bank reportnet lease bank report
net lease bank report
The Boulder Group
 
JLL Cleveland Office Outlook: Q3 2017
JLL Cleveland Office Outlook: Q3 2017JLL Cleveland Office Outlook: Q3 2017
JLL Cleveland Office Outlook: Q3 2017
Andrew Batson
 
net lease casual dining report | The Boulder Group
net lease casual dining report | The Boulder Groupnet lease casual dining report | The Boulder Group
net lease casual dining report | The Boulder Group
The Boulder Group
 
Net Lease Marker Report Q2 2013
Net Lease Marker Report Q2 2013Net Lease Marker Report Q2 2013
Net Lease Marker Report Q2 2013
The Boulder Group
 
2016 q3 net lease research report | The Boulder Group
2016 q3 net lease research report | The Boulder Group2016 q3 net lease research report | The Boulder Group
2016 q3 net lease research report | The Boulder Group
The Boulder Group
 
Net Lease Big Box Report
Net Lease Big Box ReportNet Lease Big Box Report
Net Lease Big Box Report
The Boulder Group
 
Net Lease Big Box Research Report 2017
Net Lease Big Box Research Report 2017Net Lease Big Box Research Report 2017
Net Lease Big Box Research Report 2017
The Boulder Group
 
High Real Estate C&I Market presentation feb. 2018
High Real Estate C&I Market presentation feb. 2018High Real Estate C&I Market presentation feb. 2018
High Real Estate C&I Market presentation feb. 2018
William Boben
 
net lease dollar store report
net lease dollar store reportnet lease dollar store report
net lease dollar store report
The Boulder Group
 
net lease big box report | 2016
net lease big box report | 2016net lease big box report | 2016
net lease big box report | 2016
The Boulder Group
 

Similar to Net Lease QSR Research Report (20)

Net Lease Research Report 2016 Q1 | The Boulder Group
 Net Lease Research Report  2016 Q1 | The Boulder Group Net Lease Research Report  2016 Q1 | The Boulder Group
Net Lease Research Report 2016 Q1 | The Boulder Group
 
Net Lease Research report q2 2017
Net Lease Research report q2 2017Net Lease Research report q2 2017
Net Lease Research report q2 2017
 
Net Lease Casual Dining Report 2018 | The Boulder Group
Net Lease Casual Dining  Report 2018 | The Boulder GroupNet Lease Casual Dining  Report 2018 | The Boulder Group
Net Lease Casual Dining Report 2018 | The Boulder Group
 
Rental Drivers & The Power of the Penny
Rental Drivers & The Power of the PennyRental Drivers & The Power of the Penny
Rental Drivers & The Power of the Penny
 
Net Leased Bank Report Q1 2019
Net Leased Bank Report Q1 2019Net Leased Bank Report Q1 2019
Net Leased Bank Report Q1 2019
 
Net Lease Big Box Research Report | The Boulder Group
Net Lease Big Box Research Report | The Boulder GroupNet Lease Big Box Research Report | The Boulder Group
Net Lease Big Box Research Report | The Boulder Group
 
Net lease-bank-ground-lease-research-report
Net lease-bank-ground-lease-research-reportNet lease-bank-ground-lease-research-report
Net lease-bank-ground-lease-research-report
 
Net Lease Medical Research Report 2018
Net Lease Medical Research Report 2018Net Lease Medical Research Report 2018
Net Lease Medical Research Report 2018
 
net lease research report q1 2018 | The Boulder Group
net lease research report q1 2018 | The Boulder Groupnet lease research report q1 2018 | The Boulder Group
net lease research report q1 2018 | The Boulder Group
 
The Boulder Group Publishes 4th Quarter Net Lease Market Research Report
The Boulder Group Publishes 4th Quarter Net Lease Market Research ReportThe Boulder Group Publishes 4th Quarter Net Lease Market Research Report
The Boulder Group Publishes 4th Quarter Net Lease Market Research Report
 
net lease bank report
net lease bank reportnet lease bank report
net lease bank report
 
JLL Cleveland Office Outlook: Q3 2017
JLL Cleveland Office Outlook: Q3 2017JLL Cleveland Office Outlook: Q3 2017
JLL Cleveland Office Outlook: Q3 2017
 
net lease casual dining report | The Boulder Group
net lease casual dining report | The Boulder Groupnet lease casual dining report | The Boulder Group
net lease casual dining report | The Boulder Group
 
Net Lease Marker Report Q2 2013
Net Lease Marker Report Q2 2013Net Lease Marker Report Q2 2013
Net Lease Marker Report Q2 2013
 
2016 q3 net lease research report | The Boulder Group
2016 q3 net lease research report | The Boulder Group2016 q3 net lease research report | The Boulder Group
2016 q3 net lease research report | The Boulder Group
 
Net Lease Big Box Report
Net Lease Big Box ReportNet Lease Big Box Report
Net Lease Big Box Report
 
Net Lease Big Box Research Report 2017
Net Lease Big Box Research Report 2017Net Lease Big Box Research Report 2017
Net Lease Big Box Research Report 2017
 
High Real Estate C&I Market presentation feb. 2018
High Real Estate C&I Market presentation feb. 2018High Real Estate C&I Market presentation feb. 2018
High Real Estate C&I Market presentation feb. 2018
 
net lease dollar store report
net lease dollar store reportnet lease dollar store report
net lease dollar store report
 
net lease big box report | 2016
net lease big box report | 2016net lease big box report | 2016
net lease big box report | 2016
 

More from The Boulder Group

The Boulder Group Net Lease Tenant Profile Report 2020
The Boulder Group Net Lease Tenant Profile Report 2020The Boulder Group Net Lease Tenant Profile Report 2020
The Boulder Group Net Lease Tenant Profile Report 2020
The Boulder Group
 
Net Lease Tenant Profile Report 2019 | The Boulder Group
Net Lease Tenant Profile Report 2019 | The Boulder GroupNet Lease Tenant Profile Report 2019 | The Boulder Group
Net Lease Tenant Profile Report 2019 | The Boulder Group
The Boulder Group
 
Net Leased Tenant Profiles 2019
Net Leased Tenant Profiles 2019Net Leased Tenant Profiles 2019
Net Leased Tenant Profiles 2019
The Boulder Group
 
Net lease Research Report Q1 2019
Net lease Research Report Q1 2019Net lease Research Report Q1 2019
Net lease Research Report Q1 2019
The Boulder Group
 
Net Lease Auto Parts Report 2019
Net Lease Auto Parts Report 2019Net Lease Auto Parts Report 2019
Net Lease Auto Parts Report 2019
The Boulder Group
 
Net Lease Big Box Report
Net Lease Big Box Report  Net Lease Big Box Report
Net Lease Big Box Report
The Boulder Group
 
net lease drug store cap rate research report
net lease drug store cap rate research reportnet lease drug store cap rate research report
net lease drug store cap rate research report
The Boulder Group
 
Single Tenant Net Lease Cap Rate Research Report
Single Tenant Net Lease Cap Rate Research ReportSingle Tenant Net Lease Cap Rate Research Report
Single Tenant Net Lease Cap Rate Research Report
The Boulder Group
 
Net Lease Dollar Store Research Report 2018
Net Lease Dollar Store Research Report 2018Net Lease Dollar Store Research Report 2018
Net Lease Dollar Store Research Report 2018
The Boulder Group
 
Single tenant net lease cap rates
Single tenant net lease cap ratesSingle tenant net lease cap rates
Single tenant net lease cap rates
The Boulder Group
 
Net Lease Pizza Hut Property For Sale
Net Lease Pizza Hut Property For SaleNet Lease Pizza Hut Property For Sale
Net Lease Pizza Hut Property For Sale
The Boulder Group
 
Net Leased Burger King Property For Sale
Net Leased Burger King Property For SaleNet Leased Burger King Property For Sale
Net Leased Burger King Property For Sale
The Boulder Group
 
Net Lease Dollar Store Research Report
Net Lease Dollar Store Research ReportNet Lease Dollar Store Research Report
Net Lease Dollar Store Research Report
The Boulder Group
 
Sale Leaseback Property For Sale - The Boulder Group
Sale Leaseback Property For Sale - The Boulder Group Sale Leaseback Property For Sale - The Boulder Group
Sale Leaseback Property For Sale - The Boulder Group
The Boulder Group
 
Net Lease KFC Property For Sale
Net Lease KFC Property For SaleNet Lease KFC Property For Sale
Net Lease KFC Property For Sale
The Boulder Group
 
Net Lease McDonalds Property For Sale
Net Lease McDonalds Property For SaleNet Lease McDonalds Property For Sale
Net Lease McDonalds Property For Sale
The Boulder Group
 
Net Lease Goodwill Property For Sale
Net Lease Goodwill Property For SaleNet Lease Goodwill Property For Sale
Net Lease Goodwill Property For Sale
The Boulder Group
 
Net Lease Davita For Sale | The Boulder Group
Net Lease Davita For Sale | The Boulder Group Net Lease Davita For Sale | The Boulder Group
Net Lease Davita For Sale | The Boulder Group
The Boulder Group
 
Net Lease Bakers Square Property For Sale by The Boulder Group
Net Lease Bakers Square Property For Sale by The Boulder GroupNet Lease Bakers Square Property For Sale by The Boulder Group
Net Lease Bakers Square Property For Sale by The Boulder Group
The Boulder Group
 
High Cap Rate CVS Net Lease Portfolio
High Cap Rate CVS Net Lease PortfolioHigh Cap Rate CVS Net Lease Portfolio
High Cap Rate CVS Net Lease Portfolio
The Boulder Group
 

More from The Boulder Group (20)

The Boulder Group Net Lease Tenant Profile Report 2020
The Boulder Group Net Lease Tenant Profile Report 2020The Boulder Group Net Lease Tenant Profile Report 2020
The Boulder Group Net Lease Tenant Profile Report 2020
 
Net Lease Tenant Profile Report 2019 | The Boulder Group
Net Lease Tenant Profile Report 2019 | The Boulder GroupNet Lease Tenant Profile Report 2019 | The Boulder Group
Net Lease Tenant Profile Report 2019 | The Boulder Group
 
Net Leased Tenant Profiles 2019
Net Leased Tenant Profiles 2019Net Leased Tenant Profiles 2019
Net Leased Tenant Profiles 2019
 
Net lease Research Report Q1 2019
Net lease Research Report Q1 2019Net lease Research Report Q1 2019
Net lease Research Report Q1 2019
 
Net Lease Auto Parts Report 2019
Net Lease Auto Parts Report 2019Net Lease Auto Parts Report 2019
Net Lease Auto Parts Report 2019
 
Net Lease Big Box Report
Net Lease Big Box Report  Net Lease Big Box Report
Net Lease Big Box Report
 
net lease drug store cap rate research report
net lease drug store cap rate research reportnet lease drug store cap rate research report
net lease drug store cap rate research report
 
Single Tenant Net Lease Cap Rate Research Report
Single Tenant Net Lease Cap Rate Research ReportSingle Tenant Net Lease Cap Rate Research Report
Single Tenant Net Lease Cap Rate Research Report
 
Net Lease Dollar Store Research Report 2018
Net Lease Dollar Store Research Report 2018Net Lease Dollar Store Research Report 2018
Net Lease Dollar Store Research Report 2018
 
Single tenant net lease cap rates
Single tenant net lease cap ratesSingle tenant net lease cap rates
Single tenant net lease cap rates
 
Net Lease Pizza Hut Property For Sale
Net Lease Pizza Hut Property For SaleNet Lease Pizza Hut Property For Sale
Net Lease Pizza Hut Property For Sale
 
Net Leased Burger King Property For Sale
Net Leased Burger King Property For SaleNet Leased Burger King Property For Sale
Net Leased Burger King Property For Sale
 
Net Lease Dollar Store Research Report
Net Lease Dollar Store Research ReportNet Lease Dollar Store Research Report
Net Lease Dollar Store Research Report
 
Sale Leaseback Property For Sale - The Boulder Group
Sale Leaseback Property For Sale - The Boulder Group Sale Leaseback Property For Sale - The Boulder Group
Sale Leaseback Property For Sale - The Boulder Group
 
Net Lease KFC Property For Sale
Net Lease KFC Property For SaleNet Lease KFC Property For Sale
Net Lease KFC Property For Sale
 
Net Lease McDonalds Property For Sale
Net Lease McDonalds Property For SaleNet Lease McDonalds Property For Sale
Net Lease McDonalds Property For Sale
 
Net Lease Goodwill Property For Sale
Net Lease Goodwill Property For SaleNet Lease Goodwill Property For Sale
Net Lease Goodwill Property For Sale
 
Net Lease Davita For Sale | The Boulder Group
Net Lease Davita For Sale | The Boulder Group Net Lease Davita For Sale | The Boulder Group
Net Lease Davita For Sale | The Boulder Group
 
Net Lease Bakers Square Property For Sale by The Boulder Group
Net Lease Bakers Square Property For Sale by The Boulder GroupNet Lease Bakers Square Property For Sale by The Boulder Group
Net Lease Bakers Square Property For Sale by The Boulder Group
 
High Cap Rate CVS Net Lease Portfolio
High Cap Rate CVS Net Lease PortfolioHigh Cap Rate CVS Net Lease Portfolio
High Cap Rate CVS Net Lease Portfolio
 

Recently uploaded

Brigade Insignia at Yelahanka Brochure.pdf
Brigade Insignia at Yelahanka Brochure.pdfBrigade Insignia at Yelahanka Brochure.pdf
Brigade Insignia at Yelahanka Brochure.pdf
SachinChauhan191
 
One20 North Vancouver Floor Plans by Three Shores Development.
One20 North Vancouver Floor Plans by Three Shores Development.One20 North Vancouver Floor Plans by Three Shores Development.
One20 North Vancouver Floor Plans by Three Shores Development.
VickyAulakh1
 
The KA Housing - Catalogue - Listing Turkey
The KA Housing - Catalogue - Listing TurkeyThe KA Housing - Catalogue - Listing Turkey
The KA Housing - Catalogue - Listing Turkey
Listing Turkey
 
Biography and career about Lixin Azarmehr
Biography and career about Lixin AzarmehrBiography and career about Lixin Azarmehr
Biography and career about Lixin Azarmehr
Lixin Azarmehr
 
Simpolo Company Profile & Corporate Logo
Simpolo Company Profile & Corporate LogoSimpolo Company Profile & Corporate Logo
Simpolo Company Profile & Corporate Logo
simpolosparkteam
 
Presentation to Windust Meadows HOA Board of Directors June 4, 2024: Focus o...
Presentation to Windust Meadows HOA Board of Directors June 4, 2024:  Focus o...Presentation to Windust Meadows HOA Board of Directors June 4, 2024:  Focus o...
Presentation to Windust Meadows HOA Board of Directors June 4, 2024: Focus o...
Joseph Lewis Aguirre
 
Rixos Tersane Istanbul Residences Brochure_May2024_ENG.pdf
Rixos Tersane Istanbul Residences Brochure_May2024_ENG.pdfRixos Tersane Istanbul Residences Brochure_May2024_ENG.pdf
Rixos Tersane Istanbul Residences Brochure_May2024_ENG.pdf
Listing Turkey
 
Omaxe Sports City Dwarka A Comprehensive Guide
Omaxe Sports City Dwarka A Comprehensive GuideOmaxe Sports City Dwarka A Comprehensive Guide
Omaxe Sports City Dwarka A Comprehensive Guide
omaxesportscitydwark
 
Optimizing Your MCA Lead Capture Process for Better Results
Optimizing Your MCA Lead Capture Process for Better ResultsOptimizing Your MCA Lead Capture Process for Better Results
Optimizing Your MCA Lead Capture Process for Better Results
Lead Generation Media
 
Torun Center Residences Istanbul - Listing Turkey
Torun Center Residences Istanbul - Listing TurkeyTorun Center Residences Istanbul - Listing Turkey
Torun Center Residences Istanbul - Listing Turkey
Listing Turkey
 
Deutsche EuroShop | Company Presentation | 06/24
Deutsche EuroShop | Company Presentation | 06/24Deutsche EuroShop | Company Presentation | 06/24
Deutsche EuroShop | Company Presentation | 06/24
Deutsche EuroShop AG
 
How to keep your Home naturally Cool and Warm
How to keep your Home naturally Cool and WarmHow to keep your Home naturally Cool and Warm
How to keep your Home naturally Cool and Warm
Vinra Construction
 
BricknBolt Understanding Load-Bearing Walls and Their Structural Support in H...
BricknBolt Understanding Load-Bearing Walls and Their Structural Support in H...BricknBolt Understanding Load-Bearing Walls and Their Structural Support in H...
BricknBolt Understanding Load-Bearing Walls and Their Structural Support in H...
BrickAndBolt
 
Killer Referans Bahcesehir Catalog Listing Turkey
Killer Referans Bahcesehir Catalog Listing TurkeyKiller Referans Bahcesehir Catalog Listing Turkey
Killer Referans Bahcesehir Catalog Listing Turkey
Listing Turkey
 
2BHK-3BHK NEW FLAT FOR SALE IN TUPUDANA,RANCHI.
2BHK-3BHK NEW FLAT FOR SALE IN TUPUDANA,RANCHI.2BHK-3BHK NEW FLAT FOR SALE IN TUPUDANA,RANCHI.
2BHK-3BHK NEW FLAT FOR SALE IN TUPUDANA,RANCHI.
aashiyanastardevelop
 
Architectural & Interior design portfolio.pdf
Architectural & Interior design portfolio.pdfArchitectural & Interior design portfolio.pdf
Architectural & Interior design portfolio.pdf
susantebinum
 
Sense Levent Kagithane Catalog - Listing Turkey
Sense Levent Kagithane Catalog - Listing TurkeySense Levent Kagithane Catalog - Listing Turkey
Sense Levent Kagithane Catalog - Listing Turkey
Listing Turkey
 
Riverview City Loni Kalbhor Pune Brochure
Riverview City Loni Kalbhor Pune BrochureRiverview City Loni Kalbhor Pune Brochure
Riverview City Loni Kalbhor Pune Brochure
kishor21012022
 
Urbanrise Paradise on Earth - Unveiling Unprecedented Luxury in Exquisite Vil...
Urbanrise Paradise on Earth - Unveiling Unprecedented Luxury in Exquisite Vil...Urbanrise Paradise on Earth - Unveiling Unprecedented Luxury in Exquisite Vil...
Urbanrise Paradise on Earth - Unveiling Unprecedented Luxury in Exquisite Vil...
JagadishKR1
 
Green Homes, Islamabad Presentation .pdf
Green Homes, Islamabad Presentation .pdfGreen Homes, Islamabad Presentation .pdf
Green Homes, Islamabad Presentation .pdf
ticktoktips
 

Recently uploaded (20)

Brigade Insignia at Yelahanka Brochure.pdf
Brigade Insignia at Yelahanka Brochure.pdfBrigade Insignia at Yelahanka Brochure.pdf
Brigade Insignia at Yelahanka Brochure.pdf
 
One20 North Vancouver Floor Plans by Three Shores Development.
One20 North Vancouver Floor Plans by Three Shores Development.One20 North Vancouver Floor Plans by Three Shores Development.
One20 North Vancouver Floor Plans by Three Shores Development.
 
The KA Housing - Catalogue - Listing Turkey
The KA Housing - Catalogue - Listing TurkeyThe KA Housing - Catalogue - Listing Turkey
The KA Housing - Catalogue - Listing Turkey
 
Biography and career about Lixin Azarmehr
Biography and career about Lixin AzarmehrBiography and career about Lixin Azarmehr
Biography and career about Lixin Azarmehr
 
Simpolo Company Profile & Corporate Logo
Simpolo Company Profile & Corporate LogoSimpolo Company Profile & Corporate Logo
Simpolo Company Profile & Corporate Logo
 
Presentation to Windust Meadows HOA Board of Directors June 4, 2024: Focus o...
Presentation to Windust Meadows HOA Board of Directors June 4, 2024:  Focus o...Presentation to Windust Meadows HOA Board of Directors June 4, 2024:  Focus o...
Presentation to Windust Meadows HOA Board of Directors June 4, 2024: Focus o...
 
Rixos Tersane Istanbul Residences Brochure_May2024_ENG.pdf
Rixos Tersane Istanbul Residences Brochure_May2024_ENG.pdfRixos Tersane Istanbul Residences Brochure_May2024_ENG.pdf
Rixos Tersane Istanbul Residences Brochure_May2024_ENG.pdf
 
Omaxe Sports City Dwarka A Comprehensive Guide
Omaxe Sports City Dwarka A Comprehensive GuideOmaxe Sports City Dwarka A Comprehensive Guide
Omaxe Sports City Dwarka A Comprehensive Guide
 
Optimizing Your MCA Lead Capture Process for Better Results
Optimizing Your MCA Lead Capture Process for Better ResultsOptimizing Your MCA Lead Capture Process for Better Results
Optimizing Your MCA Lead Capture Process for Better Results
 
Torun Center Residences Istanbul - Listing Turkey
Torun Center Residences Istanbul - Listing TurkeyTorun Center Residences Istanbul - Listing Turkey
Torun Center Residences Istanbul - Listing Turkey
 
Deutsche EuroShop | Company Presentation | 06/24
Deutsche EuroShop | Company Presentation | 06/24Deutsche EuroShop | Company Presentation | 06/24
Deutsche EuroShop | Company Presentation | 06/24
 
How to keep your Home naturally Cool and Warm
How to keep your Home naturally Cool and WarmHow to keep your Home naturally Cool and Warm
How to keep your Home naturally Cool and Warm
 
BricknBolt Understanding Load-Bearing Walls and Their Structural Support in H...
BricknBolt Understanding Load-Bearing Walls and Their Structural Support in H...BricknBolt Understanding Load-Bearing Walls and Their Structural Support in H...
BricknBolt Understanding Load-Bearing Walls and Their Structural Support in H...
 
Killer Referans Bahcesehir Catalog Listing Turkey
Killer Referans Bahcesehir Catalog Listing TurkeyKiller Referans Bahcesehir Catalog Listing Turkey
Killer Referans Bahcesehir Catalog Listing Turkey
 
2BHK-3BHK NEW FLAT FOR SALE IN TUPUDANA,RANCHI.
2BHK-3BHK NEW FLAT FOR SALE IN TUPUDANA,RANCHI.2BHK-3BHK NEW FLAT FOR SALE IN TUPUDANA,RANCHI.
2BHK-3BHK NEW FLAT FOR SALE IN TUPUDANA,RANCHI.
 
Architectural & Interior design portfolio.pdf
Architectural & Interior design portfolio.pdfArchitectural & Interior design portfolio.pdf
Architectural & Interior design portfolio.pdf
 
Sense Levent Kagithane Catalog - Listing Turkey
Sense Levent Kagithane Catalog - Listing TurkeySense Levent Kagithane Catalog - Listing Turkey
Sense Levent Kagithane Catalog - Listing Turkey
 
Riverview City Loni Kalbhor Pune Brochure
Riverview City Loni Kalbhor Pune BrochureRiverview City Loni Kalbhor Pune Brochure
Riverview City Loni Kalbhor Pune Brochure
 
Urbanrise Paradise on Earth - Unveiling Unprecedented Luxury in Exquisite Vil...
Urbanrise Paradise on Earth - Unveiling Unprecedented Luxury in Exquisite Vil...Urbanrise Paradise on Earth - Unveiling Unprecedented Luxury in Exquisite Vil...
Urbanrise Paradise on Earth - Unveiling Unprecedented Luxury in Exquisite Vil...
 
Green Homes, Islamabad Presentation .pdf
Green Homes, Islamabad Presentation .pdfGreen Homes, Islamabad Presentation .pdf
Green Homes, Islamabad Presentation .pdf
 

Net Lease QSR Research Report

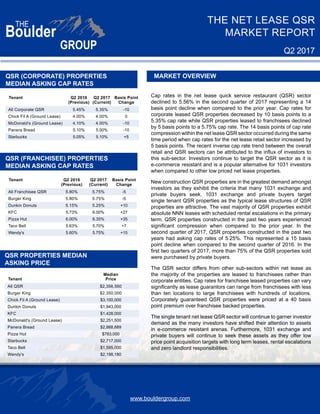
  • 1. www.bouldergroup.com THE NET LEASE QSR MARKET REPORT Q2 2017 QSR (FRANCHISEE) PROPERTIES MEDIAN ASKING CAP RATES MARKET OVERVIEW QSR PROPERTIES MEDIAN ASKING PRICE Median Tenant Price All QSR $2,356,560 Burger King $2,350,000 Chick Fil A (Ground Lease) $3,100,000 Dunkin Donuts $1,943,000 KFC $1,428,000 McDonald's (Ground Lease) $2,251,500 Panera Bread $2,888,889 Pizza Hut $783,000 Starbucks $2,717,000 Taco Bell $1,595,000 Wendy's $2,198,180 QSR (CORPORATE) PROPERTIES MEDIAN ASKING CAP RATES Tenant Q2 2016 (Previous) Q2 2017 (Current) Basis Point Change All Corporate QSR 5.45% 5.35% -10 Chick Fil A (Ground Lease) 4.00% 4.00% 0 McDonald's (Ground Lease) 4.10% 4.00% -10 Panera Bread 5.10% 5.00% -10 Starbucks 5.05% 5.10% +5 Tenant Q2 2016 (Previous) Q2 2017 (Current) Basis Point Change All Franchisee QSR 5.80% 5.75% -5 Burger King 5.80% 5.75% -5 Dunkin Donuts 5.15% 5.25% +10 KFC 5.73% 6.00% +27 Pizza Hut 6.00% 6.35% +35 Taco Bell 5.63% 5.70% +7 Wendy's 5.60% 5.75% +15 Cap rates in the net lease quick service restaurant (QSR) sector declined to 5.56% in the second quarter of 2017 representing a 14 basis point decline when compared to the prior year. Cap rates for corporate leased QSR properties decreased by 10 basis points to a 5.35% cap rate while QSR properties leased to franchisees declined by 5 basis points to a 5.75% cap rate. The 14 basis points of cap rate compression within the net lease QSR sector occurred during the same time period when cap rates for the net lease retail sector increased by 5 basis points. The recent inverse cap rate trend between the overall retail and QSR sectors can be attributed to the influx of investors to this sub-sector. Investors continue to target the QSR sector as it is e-commerce resistant and is a popular alternative for 1031 investors when compared to other low priced net lease properties. New construction QSR properties are in the greatest demand amongst investors as they exhibit the criteria that many 1031 exchange and private buyers seek. 1031 exchange and private buyers target single tenant QSR properties as the typical lease structures of QSR properties are attractive. The vast majority of QSR properties exhibit absolute NNN leases with scheduled rental escalations in the primary term. QSR properties constructed in the past two years experienced significant compression when compared to the prior year. In the second quarter of 2017, QSR properties constructed in the past two years had asking cap rates of 5.25%. This represented a 15 basis point decline when compared to the second quarter of 2016. In the first two quarters of 2017, more than 75% of the QSR properties sold were purchased by private buyers. The QSR sector differs from other sub-sectors within net lease as the majority of the properties are leased to franchisees rather than corporate entities. Cap rates for franchisee leased properties can vary significantly as lease guarantors can range from franchisees with less than ten locations to large franchisees with hundreds of locations. Corporately guaranteed QSR properties were priced at a 40 basis point premium over franchisee backed properties. The single tenant net lease QSR sector will continue to garner investor demand as the many investors have shifted their attention to assets in e-commerce resistant arenas. Furthermore, 1031 exchange and private buyers will continue to seek these assets as they offer low price point acquisition targets with long term leases, rental escalations and zero landlord responsibilities.
  • 2. www.bouldergroup.com THE NET LEASE QSR MARKET REPORT Q2 2017 NET LEASE QSR PROPERTIES MEDIAN ASKING CAP RATE BY REGION WEST MOUNTAIN MIDWEST SOUTH NORTHEAST NORTHEAST SOUTH MIDWEST MOUNTAIN WEST 5.58% 5.42% 5.40% 5.85% 4.41% Tenant Total Number of Locations Ticker Symbol Market Cap Arby's 3,400 Private Private Burger King 15,000 QSR $27 B Carl's Jr. 1,385 Private Private Chick Fil A 2,170 Private Private Chipotle 2,330 CMG $9.8 B Dunkin' Donuts 11,000+ DNKN $5.1 B Hardee's 1,860 Private Private Jack in the Box 2,255 JACK $2.7 B KFC 19,950 YUM $26 B McDonald's 35,000+ MCD $125 B Panda Express 1,910 Private Private Panera Bread 2,045 PNRA $7.1 B Pizza Hut 16,400 YUM $35 B Popeyes 2,730 PLKI $1.6 B Sonic Drive-In 3,550 SONC $1.1 B Starbucks 24,465 SBUX $80 B Taco Bell 6,975 YUM $35 B Wendy's 6,500 WEN $3.8 B Whataburger 815 Private Private SELECTED COMPANY COMPARISON Leases can be guaranteed by franchisees or corporations.
  • 3. www.bouldergroup.com THE NET LEASE QSR MARKET REPORT Q2 2017 © 2017. The Boulder Group. Information herein has been obtained from databases owned and maintained by The Boulder Group as well as third party sources. We have not verified the information and we make no guarantee, warranty or representation about it. This information is provided for general illustrative purposes and not for any specific recommendation or purpose nor under any circumstances shall any of the above information be deemed legal advice or counsel. Reliance on this information is at the risk of the reader and The Boulder Group expressly disclaims any liability arising from the use of such information. This information is designed exclusively for use by The Boulder Group clients and cannot be reproduced, retransmitted or distributed without the express written consent of The Boulder Group. QSR VS RETAIL NET LEASE MARKET CAP RATES ASKING CAP RATE BY LEASE TERM REMAINING Q2 2016 Q2 2017 Sector (Previous) (Current) QSR Sector 5.70% 5.56% Retail Net Lease Market 6.18% 6.23% QSR Premium (bps) 48 67 Lease Term Remaining Cap Rate 20+ 5.35% 15-19 5.45% 10-14 5.75% Under 10 6.35% MEDIAN NATIONAL CLOSED CAP RATE SPREAD QSR ASKING CAP RATE BY GUARANTOR Spread Sector Closed Asking (bps) QSR Sector 5.66% 5.40% 26 Corporate Franchise Spread Cap Rate Cap Rate (bps) 5.35% 5.75% -40 FOR MORE INFORMATION AUTHOR John Feeney | Vice President john@bouldergroup.com Randy Blankstein | President randy@bouldergroup.com Jimmy Goodman | Partner jimmy@bouldergroup.com Asher Wenig | Vice President asher@bouldergroup.com CONTRIBUTORS Scott Harris | Analyst scott@bouldergroup.com