SlideShare a Scribd company logo
1 of 3
Download to read offline
www.bouldergroup.com
THE NET LEASE MARKET REPORT
Q1
2019
Q4 2018 Q1 2019 Basis Point
Sector (Previous) (Current) Change
Retail 6.25% 6.27% +2
Office 7.02% 7.10% +8
Industrial 7.07% 7.00% -7
NUMBER OF PROPERTIES
ON THE MARKET
Q4 2018 Q1 2019 Percentage
Sector (Previous) (Current) Change
Retail 4,766 4,358 -8.55%
Office 472 479 +1.59%
Industrial 361 352 -2.52%
MEDIAN NATIONAL ASKING VS
CLOSED CAP RATE SPREAD
MARKET OVERVIEW
Cap rates in the single tenant net lease retail sector increased
slightly by 2 basis points to 6.27% in the first quarter of 2019
when compared to the prior quarter. Cap rates for the office sector
increased by 8 basis points to 7.10% while the industrial sector
experienced a decrease of 7 basis points to 7.00%. Net lease
transaction volume in 2018 finished in excess of $62 billion which
was a 9% increase when compared to the prior year according to
CoStar.
In the first quarter of 2019, the capital markets have shifted to favor
sellers in terms of the net lease asset pricing. In 2018, net lease
investors expected the Federal Reserve to continue raising rates
in 2019 which caused pause for some investors. However, recently
the Federal Reserve has signaled stable rates to the market in
2019. This caused the 10 Year Treasury yield to maintain a level
between 2.40% and 2.70% throughout the first quarter after
breaking the 3.00% level in 2018. The movement in interest rates
has resulted in more favorable borrowing costs and investment
returns for buyers of net lease.
Following the Federal Reserve’s recent announcements, The
Boulder Group conducted a follow up survey to its 4th Quarter
2018 Cap Rate Prediction Poll. During the 4th Quarter of 2018,
62% of survey participants predicted that cap rates would increase
by at least 25 basis points by the end of 2019. In our most recent
poll, there was a significant change in investor sentiment towards
a stabilized cap rate consensus. In the first quarter of 2019, 39%
of poll participants expect cap rates to remain unchanged or
compress in 2019, versus only 5% previously.
A more favorable monetary policy by the Federal Reserve, as
it relates to interest rates, should provide additional certainty in
the net lease markets. Investor demand for the net lease assets
remains strong as investors continue to seek yield and passive
real estate investments.
Q4 2018 Q1 2019 Basis Point
Sector (Previous) (Current) Change
Retail 31 35 +4
Office 29 30 +1
Industrial 26 29 +3
NATIONAL ASKING CAP RATES
www.bouldergroup.com
THE NET LEASE MARKET REPORT
Q1
2019
SELECTED SINGLE TENANT SALES COMPARABLES
Sale
Date Sector Tenant City State Price
Price
Per SF
Cap
Rate
Lease Term
Remaining
Mar-19 Office GSA - Dept. of Education Washington DC $116,550,000 $471 6.35% 7
Feb-19 Retail BJ's Wholesale Revere MA $19,375,000 $161 5.90% 5
Feb-19 Retail CVS Miami Beach FL $18,320,000 $1,472 4.78% 16
Jan-19 Retail DaVita Alhambra CA $14,786,000 $1,047 5.35% 15
Feb-19 Industrial FedEx Freight Bloomingdale GA $13,720,000 $349 5.60% 12
Jan-19 Retail LA Fitness Edina MN $13,650,000 $217 6.70% 12
Feb-19 Retail Walgreens Park Ridge IL $12,000,000 $776 5.83% 17
Feb-19 Retail Jewel Osco Sycamore IL $11,954,000 $194 5.75% 20
Jan-19 Office ADP Tucson AZ $11,025,000 $223 7.36% 6
Feb-19 Retail Fresh Thyme Omaha NE $9,200,000 $317 7.18% 13
Feb-19 Retail Suntrust Bank (GL) Purcellville VA $7,000,000 -- 5.50% 14
Feb-19 Retail Sprouts Lees Summit MO $6,909,753 $258 6.50% 7
Jan-19 Retail Tesla Wexford PA $6,800,000 $370 8.38% 5
Mar-19 Retail Dick's Sporting Goods Appleton WI $6,000,000 $115 7.80% 6
Feb-19 Retail Rite Aid Kingston WA $6,000,000 $347 7.49% 9
Jan-19 Retail CVS North Olmsted OH $5,200,000 $474 5.37% 20
NET LEASE CAP RATE TRENDS
Retail Office Industrial
5.75%
6.25%
6.75%
7.25%
7.75%
8.25%
8.75%
Q1
2004
Q3
2004
Q1
2005
Q3
2005
Q1
2006
Q3
2006
Q1
2007
Q3
2007
Q1
2008
Q3
2008
Q1
2009
Q3
2009
Q1
2010
Q3
2010
Q1
2011
Q3
2011
Q1
2012
Q3
2012
Q1
2013
Q3
2013
Q1
2014
Q3
2014
Q1
2015
Q3
2015
Q1
2016
Q3
2016
Q1
2017
Q3
2017
Q1
2018
Q3
2018
Q1
2019
www.bouldergroup.com
THE NET LEASE MARKET REPORT
Q1
2019
© 2019. The Boulder Group. Information herein has been obtained from databases owned and maintained by The Boulder Group as well as third party sources. We have not verified the
information and we make no guarantee, warranty or representation about it. This information is provided for general illustrative purposes and not for any specific recommendation or purpose
nor under any circumstances shall any of the above information be deemed legal advice or counsel. Reliance on this information is at the risk of the reader and The Boulder Group expressly
disclaims any liability arising from the use of such information. This information is designed exclusively for use by The Boulder Group clients and cannot be reproduced, retransmitted or
distributed without the express written consent of The Boulder Group.
FOR MORE INFORMATION
John Feeney
Senior Vice President
john@bouldergroup.com Scott Harris | Vice President
scott@bouldergroup.com
Jeff Weil | Vice President
jeff@bouldergroup.com
CONTRIBUTORS
Randy Blankstein | President
randy@bouldergroup.com
Jimmy Goodman | Partner
jimmy@bouldergroup.com
AUTHOR
Tenant
2012-2019 2005-2011 2000-2005 Pre 2000
7-Eleven 5.00% 5.45% 6.00% 6.35%
Advance Auto Parts 5.90% 6.80% 7.25% 7.75%
AutoZone 5.30% 5.65% 6.20% 7.00%
Bank of America 5.00% 5.85% 6.15% 6.65%
Chase Bank 4.50% 4.65% 5.15% 5.85%
CVS Pharmacy 5.25% 5.75% 6.15% 7.00%
DaVita Dialysis Center 6.00% 6.50% 6.85% 7.25%
Dollar General 7.10% 7.65% 7.85% 8.50%
Family Dollar 6.50% 7.50% 8.50% 9.00%
FedEx 6.15% 6.50% 6.85% 7.35%
Fresenius 6.00% 6.40% 6.75% 7.25%
McDonald's (GL) 4.00% 4.35% 4.70% 5.00%
O'Reilly Auto Parts 5.25% 5.40% 6.05% 7.00%
Rite Aid 6.50% 6.75% 7.20% 8.50%
Starbucks 5.30% 5.65% 6.35% 6.70%
Walgreens 5.35% 5.70% 6.35% 7.25%
MEDIAN ASKING CAP RATES
BY YEAR BUILT
THE BOULDER GROUP CAP RATE
POLL
WHERE DO YOU EXPECT NET LEASE CAP
RATES TO MOVE BY THE END OF 2019?
Cap rates will
move up 50 bps
or more
Cap rates will
move up 25 bps
to 49 bps
Cap rates will
move up 1 bps
to 24 bps
Cap rates will
remain unchanged
Cap rates will
move down
(10%)
(3%)
(29%)
(29%)
(29%)

More Related Content

What's hot

Net Lease Marker Report Q2 2013
Net Lease Marker Report Q2 2013Net Lease Marker Report Q2 2013
Net Lease Marker Report Q2 2013The Boulder Group
 
net lease big box report | 2016
net lease big box report | 2016net lease big box report | 2016
net lease big box report | 2016The Boulder Group
 
net lease auto parts store research report
 net lease auto parts store research report net lease auto parts store research report
net lease auto parts store research reportThe Boulder Group
 
JLL Dayton Office Report Summer 2020
JLL Dayton Office Report Summer 2020JLL Dayton Office Report Summer 2020
JLL Dayton Office Report Summer 2020Abby Armbruster
 
net lease casual dining report | The Boulder Group
net lease casual dining report | The Boulder Groupnet lease casual dining report | The Boulder Group
net lease casual dining report | The Boulder GroupThe Boulder Group
 
The Blue Sky Report® - A Kerrigan Quarterly – 2019 Year End
The Blue Sky Report® - A Kerrigan Quarterly – 2019 Year EndThe Blue Sky Report® - A Kerrigan Quarterly – 2019 Year End
The Blue Sky Report® - A Kerrigan Quarterly – 2019 Year EndErin Kerrigan
 
Net Lease Big Box Research Report | The Boulder Group
Net Lease Big Box Research Report | The Boulder GroupNet Lease Big Box Research Report | The Boulder Group
Net Lease Big Box Research Report | The Boulder GroupThe Boulder Group
 
JLL Grand Rapids Office Insight & Statistics - Q1 2019
JLL Grand Rapids Office Insight & Statistics - Q1 2019JLL Grand Rapids Office Insight & Statistics - Q1 2019
JLL Grand Rapids Office Insight & Statistics - Q1 2019Harrison West
 
BDKRelease121506
BDKRelease121506BDKRelease121506
BDKRelease121506finance44
 
JLL Pittsburgh Industrial Insight & Statistics - Q4 2018
JLL Pittsburgh Industrial Insight & Statistics - Q4 2018JLL Pittsburgh Industrial Insight & Statistics - Q4 2018
JLL Pittsburgh Industrial Insight & Statistics - Q4 2018Tobiah Bilski
 
The fonolo Top 10 Worst Companies to Call 2019
The fonolo Top 10 Worst Companies to Call 2019The fonolo Top 10 Worst Companies to Call 2019
The fonolo Top 10 Worst Companies to Call 2019Ben Ringshall
 
Industry Challenges: Mortgages & Tariffs - 2018 Hyphen Customer Conference
Industry Challenges: Mortgages & Tariffs - 2018 Hyphen Customer ConferenceIndustry Challenges: Mortgages & Tariffs - 2018 Hyphen Customer Conference
Industry Challenges: Mortgages & Tariffs - 2018 Hyphen Customer ConferenceHyphen Solutions
 
JLL Cleveland Office Outlook: Q3 2019
JLL Cleveland Office Outlook: Q3 2019JLL Cleveland Office Outlook: Q3 2019
JLL Cleveland Office Outlook: Q3 2019Johnathan Miller
 
Pittsburgh Office Insight & Stats Q1 2022
Pittsburgh Office Insight & Stats Q1 2022Pittsburgh Office Insight & Stats Q1 2022
Pittsburgh Office Insight & Stats Q1 2022Tobiah Bilski
 
Game Host Incorporated
Game Host IncorporatedGame Host Incorporated
Game Host Incorporatedjonholt523
 
St. Louis Office Outlook Q3 2016
St. Louis Office Outlook Q3 2016St. Louis Office Outlook Q3 2016
St. Louis Office Outlook Q3 2016Blaise Tomazic
 
JLL Akron Office Outlook - Winter 2019
JLL Akron Office Outlook - Winter 2019JLL Akron Office Outlook - Winter 2019
JLL Akron Office Outlook - Winter 2019Andrew Batson
 

What's hot (20)

Net Lease Marker Report Q2 2013
Net Lease Marker Report Q2 2013Net Lease Marker Report Q2 2013
Net Lease Marker Report Q2 2013
 
Net Lease Big Box Report
Net Lease Big Box Report  Net Lease Big Box Report
Net Lease Big Box Report
 
net lease big box report | 2016
net lease big box report | 2016net lease big box report | 2016
net lease big box report | 2016
 
net lease auto parts store research report
 net lease auto parts store research report net lease auto parts store research report
net lease auto parts store research report
 
JLL Dayton Office Report Summer 2020
JLL Dayton Office Report Summer 2020JLL Dayton Office Report Summer 2020
JLL Dayton Office Report Summer 2020
 
net lease casual dining report | The Boulder Group
net lease casual dining report | The Boulder Groupnet lease casual dining report | The Boulder Group
net lease casual dining report | The Boulder Group
 
The Blue Sky Report® - A Kerrigan Quarterly – 2019 Year End
The Blue Sky Report® - A Kerrigan Quarterly – 2019 Year EndThe Blue Sky Report® - A Kerrigan Quarterly – 2019 Year End
The Blue Sky Report® - A Kerrigan Quarterly – 2019 Year End
 
Net Lease Big Box Research Report | The Boulder Group
Net Lease Big Box Research Report | The Boulder GroupNet Lease Big Box Research Report | The Boulder Group
Net Lease Big Box Research Report | The Boulder Group
 
JLL Grand Rapids Office Insight & Statistics - Q1 2019
JLL Grand Rapids Office Insight & Statistics - Q1 2019JLL Grand Rapids Office Insight & Statistics - Q1 2019
JLL Grand Rapids Office Insight & Statistics - Q1 2019
 
BDKRelease121506
BDKRelease121506BDKRelease121506
BDKRelease121506
 
JLL Pittsburgh Industrial Insight & Statistics - Q4 2018
JLL Pittsburgh Industrial Insight & Statistics - Q4 2018JLL Pittsburgh Industrial Insight & Statistics - Q4 2018
JLL Pittsburgh Industrial Insight & Statistics - Q4 2018
 
The fonolo Top 10 Worst Companies to Call 2019
The fonolo Top 10 Worst Companies to Call 2019The fonolo Top 10 Worst Companies to Call 2019
The fonolo Top 10 Worst Companies to Call 2019
 
The EDGE: Week of May 16, 2011
The EDGE: Week of May 16, 2011The EDGE: Week of May 16, 2011
The EDGE: Week of May 16, 2011
 
Industry Challenges: Mortgages & Tariffs - 2018 Hyphen Customer Conference
Industry Challenges: Mortgages & Tariffs - 2018 Hyphen Customer ConferenceIndustry Challenges: Mortgages & Tariffs - 2018 Hyphen Customer Conference
Industry Challenges: Mortgages & Tariffs - 2018 Hyphen Customer Conference
 
JLL Cleveland Office Outlook: Q3 2019
JLL Cleveland Office Outlook: Q3 2019JLL Cleveland Office Outlook: Q3 2019
JLL Cleveland Office Outlook: Q3 2019
 
Pittsburgh Office Insight & Stats Q1 2022
Pittsburgh Office Insight & Stats Q1 2022Pittsburgh Office Insight & Stats Q1 2022
Pittsburgh Office Insight & Stats Q1 2022
 
Game Host Incorporated
Game Host IncorporatedGame Host Incorporated
Game Host Incorporated
 
St. Louis Office Outlook Q3 2016
St. Louis Office Outlook Q3 2016St. Louis Office Outlook Q3 2016
St. Louis Office Outlook Q3 2016
 
JLL Akron Office Outlook - Winter 2019
JLL Akron Office Outlook - Winter 2019JLL Akron Office Outlook - Winter 2019
JLL Akron Office Outlook - Winter 2019
 
Boise market stats
Boise market statsBoise market stats
Boise market stats
 

Similar to Net lease Research Report Q1 2019

Single Tenant Net Lease Cap Rate Research Report
Single Tenant Net Lease Cap Rate Research ReportSingle Tenant Net Lease Cap Rate Research Report
Single Tenant Net Lease Cap Rate Research ReportThe Boulder Group
 
Single tenant net lease cap rates
Single tenant net lease cap ratesSingle tenant net lease cap rates
Single tenant net lease cap ratesThe Boulder Group
 
Net Lease Investment Outlook
Net Lease Investment OutlookNet Lease Investment Outlook
Net Lease Investment OutlookThe Boulder Group
 
2016 q3 net lease research report | The Boulder Group
2016 q3 net lease research report | The Boulder Group2016 q3 net lease research report | The Boulder Group
2016 q3 net lease research report | The Boulder GroupThe Boulder Group
 
Net Lease Market Research Report Published by The Boulder Group
Net Lease Market Research Report  Published by The Boulder Group Net Lease Market Research Report  Published by The Boulder Group
Net Lease Market Research Report Published by The Boulder Group The Boulder Group
 
The Boulder Group | Q3 2014 Net Lease Research Report2014 q3-net-lease-resear...
The Boulder Group | Q3 2014 Net Lease Research Report2014 q3-net-lease-resear...The Boulder Group | Q3 2014 Net Lease Research Report2014 q3-net-lease-resear...
The Boulder Group | Q3 2014 Net Lease Research Report2014 q3-net-lease-resear...The Boulder Group
 
Q2 2016 Net Lease Research Report | The Boulder Group
Q2 2016 Net Lease Research Report |  The Boulder GroupQ2 2016 Net Lease Research Report |  The Boulder Group
Q2 2016 Net Lease Research Report | The Boulder GroupThe Boulder Group
 
2014 q2-net-lease-research-report
2014 q2-net-lease-research-report2014 q2-net-lease-research-report
2014 q2-net-lease-research-reportThe Boulder Group
 
2015 net lease big box report
2015 net lease big box report2015 net lease big box report
2015 net lease big box reportThe Boulder Group
 
Net Leased Bank Report Q1 2019
Net Leased Bank Report Q1 2019Net Leased Bank Report Q1 2019
Net Leased Bank Report Q1 2019The Boulder Group
 
3rd Quarter Net Lease Market Research Report | The Boulder Group
3rd Quarter Net Lease Market Research Report  | The Boulder Group3rd Quarter Net Lease Market Research Report  | The Boulder Group
3rd Quarter Net Lease Market Research Report | The Boulder GroupThe Boulder Group
 
Jefferies Conference - August 2019
Jefferies Conference -   August 2019Jefferies Conference -   August 2019
Jefferies Conference - August 2019WinnebagoInd
 
2014 q1 net lease research report
2014 q1 net lease research report2014 q1 net lease research report
2014 q1 net lease research reportThe Boulder Group
 
Mercer Capital's Bank Watch | July 2019 | Bank M&A Mid-Year Update
Mercer Capital's Bank Watch | July 2019 | Bank M&A Mid-Year UpdateMercer Capital's Bank Watch | July 2019 | Bank M&A Mid-Year Update
Mercer Capital's Bank Watch | July 2019 | Bank M&A Mid-Year UpdateMercer Capital
 
Cox Automotive Market Insight Overview June & H1 2019
Cox Automotive Market Insight Overview   June & H1 2019Cox Automotive Market Insight Overview   June & H1 2019
Cox Automotive Market Insight Overview June & H1 2019Philip Nothard
 
The Dynamics Changing The World of Automobiles - 2022 Outlook
The Dynamics Changing The World of Automobiles - 2022 OutlookThe Dynamics Changing The World of Automobiles - 2022 Outlook
The Dynamics Changing The World of Automobiles - 2022 OutlookWithum
 
The Blue Sky Report® - A Kerrigan Quarterly – Second Quarter 2019 Preview
The Blue Sky Report® - A Kerrigan Quarterly – Second Quarter 2019 PreviewThe Blue Sky Report® - A Kerrigan Quarterly – Second Quarter 2019 Preview
The Blue Sky Report® - A Kerrigan Quarterly – Second Quarter 2019 PreviewErin Kerrigan
 
Cushman & Wakefield's Americas Market Beat~ Industrial Philadelphia q32016
Cushman & Wakefield's Americas Market Beat~ Industrial Philadelphia q32016Cushman & Wakefield's Americas Market Beat~ Industrial Philadelphia q32016
Cushman & Wakefield's Americas Market Beat~ Industrial Philadelphia q32016Matthew Marshall
 

Similar to Net lease Research Report Q1 2019 (20)

Single Tenant Net Lease Cap Rate Research Report
Single Tenant Net Lease Cap Rate Research ReportSingle Tenant Net Lease Cap Rate Research Report
Single Tenant Net Lease Cap Rate Research Report
 
Single tenant net lease cap rates
Single tenant net lease cap ratesSingle tenant net lease cap rates
Single tenant net lease cap rates
 
Net Lease Investment Outlook
Net Lease Investment OutlookNet Lease Investment Outlook
Net Lease Investment Outlook
 
2016 q3 net lease research report | The Boulder Group
2016 q3 net lease research report | The Boulder Group2016 q3 net lease research report | The Boulder Group
2016 q3 net lease research report | The Boulder Group
 
Net Lease Market Research Report Published by The Boulder Group
Net Lease Market Research Report  Published by The Boulder Group Net Lease Market Research Report  Published by The Boulder Group
Net Lease Market Research Report Published by The Boulder Group
 
The Boulder Group | Q3 2014 Net Lease Research Report2014 q3-net-lease-resear...
The Boulder Group | Q3 2014 Net Lease Research Report2014 q3-net-lease-resear...The Boulder Group | Q3 2014 Net Lease Research Report2014 q3-net-lease-resear...
The Boulder Group | Q3 2014 Net Lease Research Report2014 q3-net-lease-resear...
 
Q2 2016 Net Lease Research Report | The Boulder Group
Q2 2016 Net Lease Research Report |  The Boulder GroupQ2 2016 Net Lease Research Report |  The Boulder Group
Q2 2016 Net Lease Research Report | The Boulder Group
 
2014 q2-net-lease-research-report
2014 q2-net-lease-research-report2014 q2-net-lease-research-report
2014 q2-net-lease-research-report
 
2015 net lease big box report
2015 net lease big box report2015 net lease big box report
2015 net lease big box report
 
Net Leased Bank Report Q1 2019
Net Leased Bank Report Q1 2019Net Leased Bank Report Q1 2019
Net Leased Bank Report Q1 2019
 
3rd Quarter Net Lease Market Research Report | The Boulder Group
3rd Quarter Net Lease Market Research Report  | The Boulder Group3rd Quarter Net Lease Market Research Report  | The Boulder Group
3rd Quarter Net Lease Market Research Report | The Boulder Group
 
Jefferies Conference - August 2019
Jefferies Conference -   August 2019Jefferies Conference -   August 2019
Jefferies Conference - August 2019
 
2014 q1 net lease research report
2014 q1 net lease research report2014 q1 net lease research report
2014 q1 net lease research report
 
2Q19 Global ISG Index™
2Q19 Global ISG Index™2Q19 Global ISG Index™
2Q19 Global ISG Index™
 
Mercer Capital's Bank Watch | July 2019 | Bank M&A Mid-Year Update
Mercer Capital's Bank Watch | July 2019 | Bank M&A Mid-Year UpdateMercer Capital's Bank Watch | July 2019 | Bank M&A Mid-Year Update
Mercer Capital's Bank Watch | July 2019 | Bank M&A Mid-Year Update
 
2015 RCA Office Report
2015 RCA Office Report2015 RCA Office Report
2015 RCA Office Report
 
Cox Automotive Market Insight Overview June & H1 2019
Cox Automotive Market Insight Overview   June & H1 2019Cox Automotive Market Insight Overview   June & H1 2019
Cox Automotive Market Insight Overview June & H1 2019
 
The Dynamics Changing The World of Automobiles - 2022 Outlook
The Dynamics Changing The World of Automobiles - 2022 OutlookThe Dynamics Changing The World of Automobiles - 2022 Outlook
The Dynamics Changing The World of Automobiles - 2022 Outlook
 
The Blue Sky Report® - A Kerrigan Quarterly – Second Quarter 2019 Preview
The Blue Sky Report® - A Kerrigan Quarterly – Second Quarter 2019 PreviewThe Blue Sky Report® - A Kerrigan Quarterly – Second Quarter 2019 Preview
The Blue Sky Report® - A Kerrigan Quarterly – Second Quarter 2019 Preview
 
Cushman & Wakefield's Americas Market Beat~ Industrial Philadelphia q32016
Cushman & Wakefield's Americas Market Beat~ Industrial Philadelphia q32016Cushman & Wakefield's Americas Market Beat~ Industrial Philadelphia q32016
Cushman & Wakefield's Americas Market Beat~ Industrial Philadelphia q32016
 

More from The Boulder Group

The Boulder Group Net Lease Tenant Profile Report 2020
The Boulder Group Net Lease Tenant Profile Report 2020The Boulder Group Net Lease Tenant Profile Report 2020
The Boulder Group Net Lease Tenant Profile Report 2020The Boulder Group
 
Net Lease Tenant Profile Report 2019 | The Boulder Group
Net Lease Tenant Profile Report 2019 | The Boulder GroupNet Lease Tenant Profile Report 2019 | The Boulder Group
Net Lease Tenant Profile Report 2019 | The Boulder GroupThe Boulder Group
 
Net Leased Tenant Profiles 2019
Net Leased Tenant Profiles 2019Net Leased Tenant Profiles 2019
Net Leased Tenant Profiles 2019The Boulder Group
 
Net Lease Medical Research Report 2018
Net Lease Medical Research Report 2018Net Lease Medical Research Report 2018
Net Lease Medical Research Report 2018The Boulder Group
 
net lease drug store cap rate research report
net lease drug store cap rate research reportnet lease drug store cap rate research report
net lease drug store cap rate research reportThe Boulder Group
 
Net Lease QSR Cap Rate Report
Net Lease QSR Cap Rate ReportNet Lease QSR Cap Rate Report
Net Lease QSR Cap Rate ReportThe Boulder Group
 
Net Lease Dollar Store Research Report 2018
Net Lease Dollar Store Research Report 2018Net Lease Dollar Store Research Report 2018
Net Lease Dollar Store Research Report 2018The Boulder Group
 
Net Lease Casual Dining Report 2018 | The Boulder Group
Net Lease Casual Dining  Report 2018 | The Boulder GroupNet Lease Casual Dining  Report 2018 | The Boulder Group
Net Lease Casual Dining Report 2018 | The Boulder GroupThe Boulder Group
 
Net Lease QSR Research Report
 Net Lease QSR Research Report   Net Lease QSR Research Report
Net Lease QSR Research Report The Boulder Group
 
Net Lease Pizza Hut Property For Sale
Net Lease Pizza Hut Property For SaleNet Lease Pizza Hut Property For Sale
Net Lease Pizza Hut Property For SaleThe Boulder Group
 
Net Leased Burger King Property For Sale
Net Leased Burger King Property For SaleNet Leased Burger King Property For Sale
Net Leased Burger King Property For SaleThe Boulder Group
 
Net Lease Dollar Store Research Report
Net Lease Dollar Store Research ReportNet Lease Dollar Store Research Report
Net Lease Dollar Store Research ReportThe Boulder Group
 
Sale Leaseback Property For Sale - The Boulder Group
Sale Leaseback Property For Sale - The Boulder Group Sale Leaseback Property For Sale - The Boulder Group
Sale Leaseback Property For Sale - The Boulder Group The Boulder Group
 
Net Lease KFC Property For Sale
Net Lease KFC Property For SaleNet Lease KFC Property For Sale
Net Lease KFC Property For SaleThe Boulder Group
 
Net Lease McDonalds Property For Sale
Net Lease McDonalds Property For SaleNet Lease McDonalds Property For Sale
Net Lease McDonalds Property For SaleThe Boulder Group
 
Net Lease Goodwill Property For Sale
Net Lease Goodwill Property For SaleNet Lease Goodwill Property For Sale
Net Lease Goodwill Property For SaleThe Boulder Group
 
Net Lease Davita For Sale | The Boulder Group
Net Lease Davita For Sale | The Boulder Group Net Lease Davita For Sale | The Boulder Group
Net Lease Davita For Sale | The Boulder Group The Boulder Group
 
Net Lease Casual Dining Research Report | The Boulder Group
Net Lease Casual Dining Research Report | The Boulder GroupNet Lease Casual Dining Research Report | The Boulder Group
Net Lease Casual Dining Research Report | The Boulder GroupThe Boulder Group
 
Net Lease Bakers Square Property For Sale by The Boulder Group
Net Lease Bakers Square Property For Sale by The Boulder GroupNet Lease Bakers Square Property For Sale by The Boulder Group
Net Lease Bakers Square Property For Sale by The Boulder GroupThe Boulder Group
 
High Cap Rate CVS Net Lease Portfolio
High Cap Rate CVS Net Lease PortfolioHigh Cap Rate CVS Net Lease Portfolio
High Cap Rate CVS Net Lease PortfolioThe Boulder Group
 

More from The Boulder Group (20)

The Boulder Group Net Lease Tenant Profile Report 2020
The Boulder Group Net Lease Tenant Profile Report 2020The Boulder Group Net Lease Tenant Profile Report 2020
The Boulder Group Net Lease Tenant Profile Report 2020
 
Net Lease Tenant Profile Report 2019 | The Boulder Group
Net Lease Tenant Profile Report 2019 | The Boulder GroupNet Lease Tenant Profile Report 2019 | The Boulder Group
Net Lease Tenant Profile Report 2019 | The Boulder Group
 
Net Leased Tenant Profiles 2019
Net Leased Tenant Profiles 2019Net Leased Tenant Profiles 2019
Net Leased Tenant Profiles 2019
 
Net Lease Medical Research Report 2018
Net Lease Medical Research Report 2018Net Lease Medical Research Report 2018
Net Lease Medical Research Report 2018
 
net lease drug store cap rate research report
net lease drug store cap rate research reportnet lease drug store cap rate research report
net lease drug store cap rate research report
 
Net Lease QSR Cap Rate Report
Net Lease QSR Cap Rate ReportNet Lease QSR Cap Rate Report
Net Lease QSR Cap Rate Report
 
Net Lease Dollar Store Research Report 2018
Net Lease Dollar Store Research Report 2018Net Lease Dollar Store Research Report 2018
Net Lease Dollar Store Research Report 2018
 
Net Lease Casual Dining Report 2018 | The Boulder Group
Net Lease Casual Dining  Report 2018 | The Boulder GroupNet Lease Casual Dining  Report 2018 | The Boulder Group
Net Lease Casual Dining Report 2018 | The Boulder Group
 
Net Lease QSR Research Report
 Net Lease QSR Research Report   Net Lease QSR Research Report
Net Lease QSR Research Report
 
Net Lease Pizza Hut Property For Sale
Net Lease Pizza Hut Property For SaleNet Lease Pizza Hut Property For Sale
Net Lease Pizza Hut Property For Sale
 
Net Leased Burger King Property For Sale
Net Leased Burger King Property For SaleNet Leased Burger King Property For Sale
Net Leased Burger King Property For Sale
 
Net Lease Dollar Store Research Report
Net Lease Dollar Store Research ReportNet Lease Dollar Store Research Report
Net Lease Dollar Store Research Report
 
Sale Leaseback Property For Sale - The Boulder Group
Sale Leaseback Property For Sale - The Boulder Group Sale Leaseback Property For Sale - The Boulder Group
Sale Leaseback Property For Sale - The Boulder Group
 
Net Lease KFC Property For Sale
Net Lease KFC Property For SaleNet Lease KFC Property For Sale
Net Lease KFC Property For Sale
 
Net Lease McDonalds Property For Sale
Net Lease McDonalds Property For SaleNet Lease McDonalds Property For Sale
Net Lease McDonalds Property For Sale
 
Net Lease Goodwill Property For Sale
Net Lease Goodwill Property For SaleNet Lease Goodwill Property For Sale
Net Lease Goodwill Property For Sale
 
Net Lease Davita For Sale | The Boulder Group
Net Lease Davita For Sale | The Boulder Group Net Lease Davita For Sale | The Boulder Group
Net Lease Davita For Sale | The Boulder Group
 
Net Lease Casual Dining Research Report | The Boulder Group
Net Lease Casual Dining Research Report | The Boulder GroupNet Lease Casual Dining Research Report | The Boulder Group
Net Lease Casual Dining Research Report | The Boulder Group
 
Net Lease Bakers Square Property For Sale by The Boulder Group
Net Lease Bakers Square Property For Sale by The Boulder GroupNet Lease Bakers Square Property For Sale by The Boulder Group
Net Lease Bakers Square Property For Sale by The Boulder Group
 
High Cap Rate CVS Net Lease Portfolio
High Cap Rate CVS Net Lease PortfolioHigh Cap Rate CVS Net Lease Portfolio
High Cap Rate CVS Net Lease Portfolio
 

Recently uploaded

9990771857 Call Girls in Noida Sector 11 Noida (Call Girls) Delhi
9990771857 Call Girls in Noida Sector 11 Noida (Call Girls) Delhi9990771857 Call Girls in Noida Sector 11 Noida (Call Girls) Delhi
9990771857 Call Girls in Noida Sector 11 Noida (Call Girls) Delhidelhimodel235
 
83770-87607 ۞Call Girls In Near The Park Hotel (Cp) Delhi
83770-87607 ۞Call Girls In Near The Park Hotel (Cp) Delhi83770-87607 ۞Call Girls In Near The Park Hotel (Cp) Delhi
83770-87607 ۞Call Girls In Near The Park Hotel (Cp) Delhidollysharma2066
 
Prestige Sector 94 at Noida E Brochure.pdf
Prestige Sector 94 at Noida E Brochure.pdfPrestige Sector 94 at Noida E Brochure.pdf
Prestige Sector 94 at Noida E Brochure.pdfsarak0han45400
 
Call Girls in Pitampura Delhi 💯Call Us 🔝8264348440🔝
Call Girls in Pitampura Delhi 💯Call Us 🔝8264348440🔝Call Girls in Pitampura Delhi 💯Call Us 🔝8264348440🔝
Call Girls in Pitampura Delhi 💯Call Us 🔝8264348440🔝soniya singh
 
Call Girls In Sahibabad Ghaziabad ❤️8860477959 Low Rate Escorts Service In 24...
Call Girls In Sahibabad Ghaziabad ❤️8860477959 Low Rate Escorts Service In 24...Call Girls In Sahibabad Ghaziabad ❤️8860477959 Low Rate Escorts Service In 24...
Call Girls In Sahibabad Ghaziabad ❤️8860477959 Low Rate Escorts Service In 24...lizamodels9
 
Low Rate Call Girls in Akshardham Delhi Call 9990771857
Low Rate Call Girls in Akshardham   Delhi Call 9990771857Low Rate Call Girls in Akshardham   Delhi Call 9990771857
Low Rate Call Girls in Akshardham Delhi Call 9990771857delhimodel235
 
MADHUGIRI FARM LAND BROCHURES (11)_compressed (1).pdf
MADHUGIRI FARM LAND BROCHURES (11)_compressed (1).pdfMADHUGIRI FARM LAND BROCHURES (11)_compressed (1).pdf
MADHUGIRI FARM LAND BROCHURES (11)_compressed (1).pdfknoxdigital1
 
Nanke Area Estate commercial ( Dir. Kat Kuo)
Nanke Area Estate commercial ( Dir. Kat Kuo)Nanke Area Estate commercial ( Dir. Kat Kuo)
Nanke Area Estate commercial ( Dir. Kat Kuo)jessica288382
 
Call Girls in Model Town Delhi 💯Call Us 🔝8264348440🔝
Call Girls in Model Town Delhi 💯Call Us 🔝8264348440🔝Call Girls in Model Town Delhi 💯Call Us 🔝8264348440🔝
Call Girls in Model Town Delhi 💯Call Us 🔝8264348440🔝soniya singh
 
Low Rate Call Girls in Tughlakabad Delhi Call 9990771857
Low Rate Call Girls in Tughlakabad Delhi Call 9990771857Low Rate Call Girls in Tughlakabad Delhi Call 9990771857
Low Rate Call Girls in Tughlakabad Delhi Call 9990771857delhimodel235
 
Call Girls In Mundka Industrial Metro@꧂8447779280 ↬Enjoy ꧂Escort Service in ...
Call Girls In Mundka Industrial Metro@꧂8447779280 ↬Enjoy ꧂Escort Service in  ...Call Girls In Mundka Industrial Metro@꧂8447779280 ↬Enjoy ꧂Escort Service in  ...
Call Girls In Mundka Industrial Metro@꧂8447779280 ↬Enjoy ꧂Escort Service in ...asmaqueen5
 
Call Girls in Inderpuri Delhi 💯Call Us 🔝8264348440🔝
Call Girls in Inderpuri Delhi 💯Call Us 🔝8264348440🔝Call Girls in Inderpuri Delhi 💯Call Us 🔝8264348440🔝
Call Girls in Inderpuri Delhi 💯Call Us 🔝8264348440🔝soniya singh
 
Call Girls in Nehru Place Delhi 💯Call Us 🔝8264348440🔝
Call Girls in Nehru Place Delhi 💯Call Us 🔝8264348440🔝Call Girls in Nehru Place Delhi 💯Call Us 🔝8264348440🔝
Call Girls in Nehru Place Delhi 💯Call Us 🔝8264348440🔝soniya singh
 
Managed Farmland Brochures to get more in
Managed Farmland Brochures to get more inManaged Farmland Brochures to get more in
Managed Farmland Brochures to get more inknoxdigital1
 
Purva Palm Hills Devanahalli, Bangalore E- Brochure.pdf
Purva Palm Hills Devanahalli, Bangalore E- Brochure.pdfPurva Palm Hills Devanahalli, Bangalore E- Brochure.pdf
Purva Palm Hills Devanahalli, Bangalore E- Brochure.pdffaheemali990101
 
Puravankara Mundhwa Pune E-Brochure.pdf
Puravankara Mundhwa Pune  E-Brochure.pdfPuravankara Mundhwa Pune  E-Brochure.pdf
Puravankara Mundhwa Pune E-Brochure.pdfManishSaxena95
 
SVN Live 4.22.24 Weekly Property Broadcast
SVN Live 4.22.24 Weekly Property BroadcastSVN Live 4.22.24 Weekly Property Broadcast
SVN Live 4.22.24 Weekly Property BroadcastSVN International Corp.
 

Recently uploaded (20)

9990771857 Call Girls in Noida Sector 11 Noida (Call Girls) Delhi
9990771857 Call Girls in Noida Sector 11 Noida (Call Girls) Delhi9990771857 Call Girls in Noida Sector 11 Noida (Call Girls) Delhi
9990771857 Call Girls in Noida Sector 11 Noida (Call Girls) Delhi
 
83770-87607 ۞Call Girls In Near The Park Hotel (Cp) Delhi
83770-87607 ۞Call Girls In Near The Park Hotel (Cp) Delhi83770-87607 ۞Call Girls In Near The Park Hotel (Cp) Delhi
83770-87607 ۞Call Girls In Near The Park Hotel (Cp) Delhi
 
Prestige Sector 94 at Noida E Brochure.pdf
Prestige Sector 94 at Noida E Brochure.pdfPrestige Sector 94 at Noida E Brochure.pdf
Prestige Sector 94 at Noida E Brochure.pdf
 
Call Girls in Pitampura Delhi 💯Call Us 🔝8264348440🔝
Call Girls in Pitampura Delhi 💯Call Us 🔝8264348440🔝Call Girls in Pitampura Delhi 💯Call Us 🔝8264348440🔝
Call Girls in Pitampura Delhi 💯Call Us 🔝8264348440🔝
 
Call Girls In Sahibabad Ghaziabad ❤️8860477959 Low Rate Escorts Service In 24...
Call Girls In Sahibabad Ghaziabad ❤️8860477959 Low Rate Escorts Service In 24...Call Girls In Sahibabad Ghaziabad ❤️8860477959 Low Rate Escorts Service In 24...
Call Girls In Sahibabad Ghaziabad ❤️8860477959 Low Rate Escorts Service In 24...
 
Low Rate Call Girls in Akshardham Delhi Call 9990771857
Low Rate Call Girls in Akshardham   Delhi Call 9990771857Low Rate Call Girls in Akshardham   Delhi Call 9990771857
Low Rate Call Girls in Akshardham Delhi Call 9990771857
 
Call Girls in Mahavir Nagar whatsaap call US +919953056974
Call Girls in Mahavir Nagar  whatsaap call US  +919953056974Call Girls in Mahavir Nagar  whatsaap call US  +919953056974
Call Girls in Mahavir Nagar whatsaap call US +919953056974
 
MADHUGIRI FARM LAND BROCHURES (11)_compressed (1).pdf
MADHUGIRI FARM LAND BROCHURES (11)_compressed (1).pdfMADHUGIRI FARM LAND BROCHURES (11)_compressed (1).pdf
MADHUGIRI FARM LAND BROCHURES (11)_compressed (1).pdf
 
Nanke Area Estate commercial ( Dir. Kat Kuo)
Nanke Area Estate commercial ( Dir. Kat Kuo)Nanke Area Estate commercial ( Dir. Kat Kuo)
Nanke Area Estate commercial ( Dir. Kat Kuo)
 
Call Girls in Model Town Delhi 💯Call Us 🔝8264348440🔝
Call Girls in Model Town Delhi 💯Call Us 🔝8264348440🔝Call Girls in Model Town Delhi 💯Call Us 🔝8264348440🔝
Call Girls in Model Town Delhi 💯Call Us 🔝8264348440🔝
 
Low Rate Call Girls in Tughlakabad Delhi Call 9990771857
Low Rate Call Girls in Tughlakabad Delhi Call 9990771857Low Rate Call Girls in Tughlakabad Delhi Call 9990771857
Low Rate Call Girls in Tughlakabad Delhi Call 9990771857
 
Call Girls In Mundka Industrial Metro@꧂8447779280 ↬Enjoy ꧂Escort Service in ...
Call Girls In Mundka Industrial Metro@꧂8447779280 ↬Enjoy ꧂Escort Service in  ...Call Girls In Mundka Industrial Metro@꧂8447779280 ↬Enjoy ꧂Escort Service in  ...
Call Girls In Mundka Industrial Metro@꧂8447779280 ↬Enjoy ꧂Escort Service in ...
 
Call Girls in Inderpuri Delhi 💯Call Us 🔝8264348440🔝
Call Girls in Inderpuri Delhi 💯Call Us 🔝8264348440🔝Call Girls in Inderpuri Delhi 💯Call Us 🔝8264348440🔝
Call Girls in Inderpuri Delhi 💯Call Us 🔝8264348440🔝
 
Call Girls in Nehru Place Delhi 💯Call Us 🔝8264348440🔝
Call Girls in Nehru Place Delhi 💯Call Us 🔝8264348440🔝Call Girls in Nehru Place Delhi 💯Call Us 🔝8264348440🔝
Call Girls in Nehru Place Delhi 💯Call Us 🔝8264348440🔝
 
Managed Farmland Brochures to get more in
Managed Farmland Brochures to get more inManaged Farmland Brochures to get more in
Managed Farmland Brochures to get more in
 
Purva Palm Hills Devanahalli, Bangalore E- Brochure.pdf
Purva Palm Hills Devanahalli, Bangalore E- Brochure.pdfPurva Palm Hills Devanahalli, Bangalore E- Brochure.pdf
Purva Palm Hills Devanahalli, Bangalore E- Brochure.pdf
 
Puravankara Mundhwa Pune E-Brochure.pdf
Puravankara Mundhwa Pune  E-Brochure.pdfPuravankara Mundhwa Pune  E-Brochure.pdf
Puravankara Mundhwa Pune E-Brochure.pdf
 
9953056974 Low Rate Call Girls In Saket, Delhi NCR
9953056974 Low Rate Call Girls In Saket, Delhi NCR9953056974 Low Rate Call Girls In Saket, Delhi NCR
9953056974 Low Rate Call Girls In Saket, Delhi NCR
 
SVN Live 4.22.24 Weekly Property Broadcast
SVN Live 4.22.24 Weekly Property BroadcastSVN Live 4.22.24 Weekly Property Broadcast
SVN Live 4.22.24 Weekly Property Broadcast
 
Low Rate Call Girls in Triveni Complex Delhi Call 9873940964
Low Rate Call Girls in Triveni Complex Delhi Call 9873940964Low Rate Call Girls in Triveni Complex Delhi Call 9873940964
Low Rate Call Girls in Triveni Complex Delhi Call 9873940964
 

Net lease Research Report Q1 2019

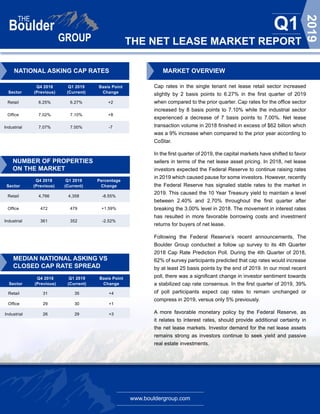
  • 1. www.bouldergroup.com THE NET LEASE MARKET REPORT Q1 2019 Q4 2018 Q1 2019 Basis Point Sector (Previous) (Current) Change Retail 6.25% 6.27% +2 Office 7.02% 7.10% +8 Industrial 7.07% 7.00% -7 NUMBER OF PROPERTIES ON THE MARKET Q4 2018 Q1 2019 Percentage Sector (Previous) (Current) Change Retail 4,766 4,358 -8.55% Office 472 479 +1.59% Industrial 361 352 -2.52% MEDIAN NATIONAL ASKING VS CLOSED CAP RATE SPREAD MARKET OVERVIEW Cap rates in the single tenant net lease retail sector increased slightly by 2 basis points to 6.27% in the first quarter of 2019 when compared to the prior quarter. Cap rates for the office sector increased by 8 basis points to 7.10% while the industrial sector experienced a decrease of 7 basis points to 7.00%. Net lease transaction volume in 2018 finished in excess of $62 billion which was a 9% increase when compared to the prior year according to CoStar. In the first quarter of 2019, the capital markets have shifted to favor sellers in terms of the net lease asset pricing. In 2018, net lease investors expected the Federal Reserve to continue raising rates in 2019 which caused pause for some investors. However, recently the Federal Reserve has signaled stable rates to the market in 2019. This caused the 10 Year Treasury yield to maintain a level between 2.40% and 2.70% throughout the first quarter after breaking the 3.00% level in 2018. The movement in interest rates has resulted in more favorable borrowing costs and investment returns for buyers of net lease. Following the Federal Reserve’s recent announcements, The Boulder Group conducted a follow up survey to its 4th Quarter 2018 Cap Rate Prediction Poll. During the 4th Quarter of 2018, 62% of survey participants predicted that cap rates would increase by at least 25 basis points by the end of 2019. In our most recent poll, there was a significant change in investor sentiment towards a stabilized cap rate consensus. In the first quarter of 2019, 39% of poll participants expect cap rates to remain unchanged or compress in 2019, versus only 5% previously. A more favorable monetary policy by the Federal Reserve, as it relates to interest rates, should provide additional certainty in the net lease markets. Investor demand for the net lease assets remains strong as investors continue to seek yield and passive real estate investments. Q4 2018 Q1 2019 Basis Point Sector (Previous) (Current) Change Retail 31 35 +4 Office 29 30 +1 Industrial 26 29 +3 NATIONAL ASKING CAP RATES
  • 2. www.bouldergroup.com THE NET LEASE MARKET REPORT Q1 2019 SELECTED SINGLE TENANT SALES COMPARABLES Sale Date Sector Tenant City State Price Price Per SF Cap Rate Lease Term Remaining Mar-19 Office GSA - Dept. of Education Washington DC $116,550,000 $471 6.35% 7 Feb-19 Retail BJ's Wholesale Revere MA $19,375,000 $161 5.90% 5 Feb-19 Retail CVS Miami Beach FL $18,320,000 $1,472 4.78% 16 Jan-19 Retail DaVita Alhambra CA $14,786,000 $1,047 5.35% 15 Feb-19 Industrial FedEx Freight Bloomingdale GA $13,720,000 $349 5.60% 12 Jan-19 Retail LA Fitness Edina MN $13,650,000 $217 6.70% 12 Feb-19 Retail Walgreens Park Ridge IL $12,000,000 $776 5.83% 17 Feb-19 Retail Jewel Osco Sycamore IL $11,954,000 $194 5.75% 20 Jan-19 Office ADP Tucson AZ $11,025,000 $223 7.36% 6 Feb-19 Retail Fresh Thyme Omaha NE $9,200,000 $317 7.18% 13 Feb-19 Retail Suntrust Bank (GL) Purcellville VA $7,000,000 -- 5.50% 14 Feb-19 Retail Sprouts Lees Summit MO $6,909,753 $258 6.50% 7 Jan-19 Retail Tesla Wexford PA $6,800,000 $370 8.38% 5 Mar-19 Retail Dick's Sporting Goods Appleton WI $6,000,000 $115 7.80% 6 Feb-19 Retail Rite Aid Kingston WA $6,000,000 $347 7.49% 9 Jan-19 Retail CVS North Olmsted OH $5,200,000 $474 5.37% 20 NET LEASE CAP RATE TRENDS Retail Office Industrial 5.75% 6.25% 6.75% 7.25% 7.75% 8.25% 8.75% Q1 2004 Q3 2004 Q1 2005 Q3 2005 Q1 2006 Q3 2006 Q1 2007 Q3 2007 Q1 2008 Q3 2008 Q1 2009 Q3 2009 Q1 2010 Q3 2010 Q1 2011 Q3 2011 Q1 2012 Q3 2012 Q1 2013 Q3 2013 Q1 2014 Q3 2014 Q1 2015 Q3 2015 Q1 2016 Q3 2016 Q1 2017 Q3 2017 Q1 2018 Q3 2018 Q1 2019
  • 3. www.bouldergroup.com THE NET LEASE MARKET REPORT Q1 2019 © 2019. The Boulder Group. Information herein has been obtained from databases owned and maintained by The Boulder Group as well as third party sources. We have not verified the information and we make no guarantee, warranty or representation about it. This information is provided for general illustrative purposes and not for any specific recommendation or purpose nor under any circumstances shall any of the above information be deemed legal advice or counsel. Reliance on this information is at the risk of the reader and The Boulder Group expressly disclaims any liability arising from the use of such information. This information is designed exclusively for use by The Boulder Group clients and cannot be reproduced, retransmitted or distributed without the express written consent of The Boulder Group. FOR MORE INFORMATION John Feeney Senior Vice President john@bouldergroup.com Scott Harris | Vice President scott@bouldergroup.com Jeff Weil | Vice President jeff@bouldergroup.com CONTRIBUTORS Randy Blankstein | President randy@bouldergroup.com Jimmy Goodman | Partner jimmy@bouldergroup.com AUTHOR Tenant 2012-2019 2005-2011 2000-2005 Pre 2000 7-Eleven 5.00% 5.45% 6.00% 6.35% Advance Auto Parts 5.90% 6.80% 7.25% 7.75% AutoZone 5.30% 5.65% 6.20% 7.00% Bank of America 5.00% 5.85% 6.15% 6.65% Chase Bank 4.50% 4.65% 5.15% 5.85% CVS Pharmacy 5.25% 5.75% 6.15% 7.00% DaVita Dialysis Center 6.00% 6.50% 6.85% 7.25% Dollar General 7.10% 7.65% 7.85% 8.50% Family Dollar 6.50% 7.50% 8.50% 9.00% FedEx 6.15% 6.50% 6.85% 7.35% Fresenius 6.00% 6.40% 6.75% 7.25% McDonald's (GL) 4.00% 4.35% 4.70% 5.00% O'Reilly Auto Parts 5.25% 5.40% 6.05% 7.00% Rite Aid 6.50% 6.75% 7.20% 8.50% Starbucks 5.30% 5.65% 6.35% 6.70% Walgreens 5.35% 5.70% 6.35% 7.25% MEDIAN ASKING CAP RATES BY YEAR BUILT THE BOULDER GROUP CAP RATE POLL WHERE DO YOU EXPECT NET LEASE CAP RATES TO MOVE BY THE END OF 2019? Cap rates will move up 50 bps or more Cap rates will move up 25 bps to 49 bps Cap rates will move up 1 bps to 24 bps Cap rates will remain unchanged Cap rates will move down (10%) (3%) (29%) (29%) (29%)