Net Lease QSR Cap Rate Report
•
1 like•162 views

The Boulder Group has released its Net Lease QSR Cap Rate Market Report for 2018.

Recommended
More Related Content
Similar to Net Lease QSR Cap Rate Report
Similar to Net Lease QSR Cap Rate Report (20)
More from The Boulder Group
More from The Boulder Group (19)
Recently uploaded
Recently uploaded (20)
Net Lease QSR Cap Rate Report
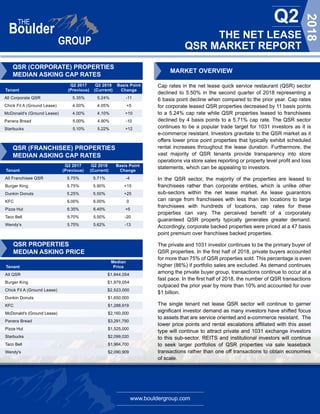
- 1. www.bouldergroup.com THE NET LEASE QSR MARKET REPORT Q2 2018 Q2 2017 Q2 2018 Basis Point Tenant (Previous) (Current) Change All Corporate QSR 5.35% 5.24% -11 Chick Fil A (Ground Lease) 4.00% 4.05% +5 McDonald's (Ground Lease) 4.00% 4.10% +10 Panera Bread 5.00% 4.90% -10 Starbucks 5.10% 5.22% +12 QSR (FRANCHISEE) PROPERTIES MEDIAN ASKING CAP RATES QSR PROPERTIES MEDIAN ASKING PRICE MARKET OVERVIEW Cap rates in the net lease quick service restaurant (QSR) sector declined to 5.50% in the second quarter of 2018 representing a 6 basis point decline when compared to the prior year. Cap rates for corporate leased QSR properties decreased by 11 basis points to a 5.24% cap rate while QSR properties leased to franchisees declined by 4 basis points to a 5.71% cap rate. The QSR sector continues to be a popular trade target for 1031 investors as it is e-commerce resistant. Investors gravitate to the QSR market as it offers lower price point properties that typically exhibit scheduled rental increases throughout the lease duration. Furthermore, the vast majority of QSR tenants provide transparency into store operations via store sales reporting or property level profit and loss statements, which can be appealing to investors. In the QSR sector, the majority of the properties are leased to franchisees rather than corporate entities, which is unlike other sub-sectors within the net lease market. As lease guarantors can range from franchisees with less than ten locations to large franchisees with hundreds of locations, cap rates for these properties can vary. The perceived benefit of a corporately guaranteed QSR property typically generates greater demand. Accordingly, corporate backed properties were priced at a 47 basis point premium over franchisee backed properties. The private and 1031 investor continues to be the primary buyer of QSR properties. In the first half of 2018, private buyers accounted for more than 75% of QSR properties sold. This percentage is even higher (86%) if portfolio sales are excluded. As demand continues among the private buyer group, transactions continue to occur at a fast pace. In the first half of 2018, the number of QSR transactions outpaced the prior year by more than 10% and accounted for over $1 billion. The single tenant net lease QSR sector will continue to garner significant investor demand as many investors have shifted focus to assets that are service oriented and e-commerce resistant. The lower price points and rental escalations affiliated with this asset type will continue to attract private and 1031 exchange investors to this sub-sector. REITS and institutional investors will continue to seek larger portfolios of QSR properties via sale leaseback transactions rather than one off transactions to obtain economies of scale. QSR (CORPORATE) PROPERTIES MEDIAN ASKING CAP RATES Q2 2017 Q2 2018 Basis Point Tenant (Previous) (Current) Change All Franchisee QSR 5.75% 5.71% -4 Burger King 5.75% 5.90% +15 Dunkin Donuts 5.25% 5.50% +25 KFC 6.00% 6.00% 0 Pizza Hut 6.35% 6.40% +5 Taco Bell 5.70% 5.50% -20 Wendy's 5.75% 5.62% -13 Median Tenant Price All QSR $1,944,054 Burger King $1,979,054 Chick Fil A (Ground Lease) $2,523,000 Dunkin Donuts $1,650,000 KFC $1,288,919 McDonald's (Ground Lease) $2,160,000 Panera Bread $3,291,750 Pizza Hut $1,525,000 Starbucks $2,099,020 Taco Bell $1,964,700 Wendy's $2,090,909
- 2. www.bouldergroup.com THE NET LEASE QSR MARKET REPORT Q2 2018 SELECTED COMPANY COMPARISON Tenant Number of Locations Ticker Symbol Market Cap Arby's 3,400 Private Private Burger King 15,000 QSR $27 B Carl's Jr. 1,490 Private Private Chick Fil A 2,200 Private Private Chipotle 2,250 CMG $14 B Dunkin' Donuts 11,000+ DNKN $6 B Hardee's 1,860 Private Private Jack in the Box 2,255 JACK $2.5 B KFC 20,400 YUM $27 B McDonald's 37,200 MCD $127 B Panda Express 2,000+ Private Private Panera Bread 2,100 Private Private Pizza Hut 16,748 YUM $27 B Popeyes 2,730 QSR $27 B Sonic Drive-In 3,557 SONC $1.2 B Starbucks 28,218 SBUX $75 B Taco Bell 7,000 YUM $27 B Wendy's 6,500 WEN $4.4 B Whataburger 824 Private Private NET LEASE QSR PROPERTIES MEDIAN ASKING CAP RATE BY REGION WEST MOUNTAIN MIDWEST SOUTH NO RTHEAST 5.50% 5.50% 5.45% 5.79% 4.32% WEST MOUNTAIN MIDWEST SOUTH NO RTHEAST Leases can be guaranteed by franchisees or corporations.
- 3. www.bouldergroup.com THE NET LEASE QSR MARKET REPORT Q2 2018 © 2018. The Boulder Group. Information herein has been obtained from databases owned and maintained by The Boulder Group as well as third party sources. We have not verified the information and we make no guarantee, warranty or representation about it. This information is provided for general illustrative purposes and not for any specific recommendation or purpose nor under any circumstances shall any of the above information be deemed legal advice or counsel. Reliance on this information is at the risk of the reader and The Boulder Group expressly disclaims any liability arising from the use of such information. This information is designed exclusively for use by The Boulder Group clients and cannot be reproduced, retransmitted or distributed without the express written consent of The Boulder Group. FOR MORE INFORMATION John Feeney | Senior Vice President john@bouldergroup.com Scott Harris | Senior Analyst scott@bouldergroup.com Jeff Weil | Analyst jeff@bouldergroup.com CONTRIBUTORS Randy Blankstein | President randy@bouldergroup.com Jimmy Goodman | Partner jimmy@bouldergroup.com AUTHOR Spread Sector Closed Asking (bps) QSR Sector 5.68% 5.50% 18 QSR ASKING CAP RATE BY GUARANTOR MEDIAN NATIONAL CLOSED CAP RATE SPREAD Corporate Franchise Spread Cap Rate Cap Rate (bps) 5.24% 5.71% 47 Q2 2017 Q2 2018 Sector (Previous) (Current) QSR Sector 5.56% 5.50% Retail Net Lease Market 6.23% 6.20% QSR Premium (bps) 67 70 MEDIAN ASKING CAP RATE BY LEASE TERM REMAINING QSR VS RETAIL NET LEASE MARKET CAP RATES Cap Lease Term Remaining Rate 20+ 5.25% 15-19 5.42% 10-14 5.70% Under 10 6.40%