Introduction
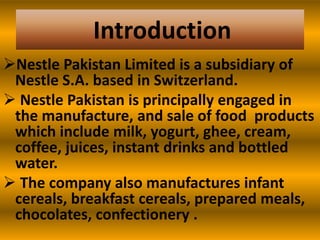
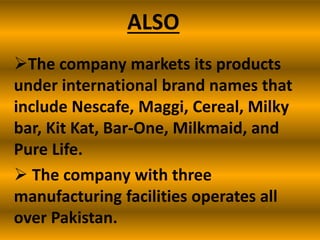
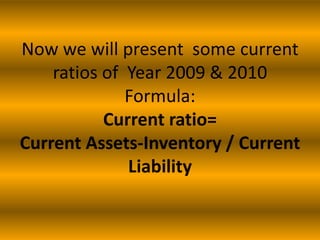
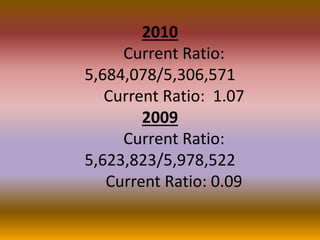
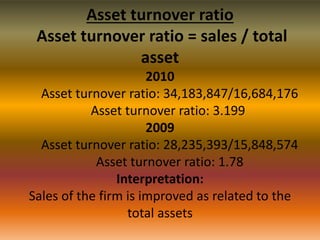
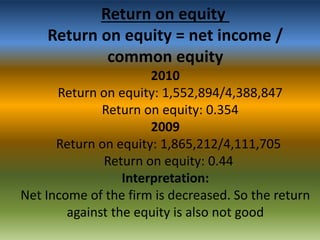
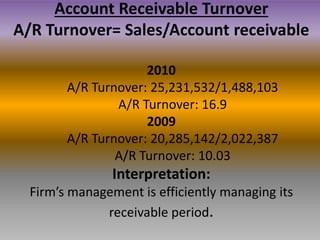
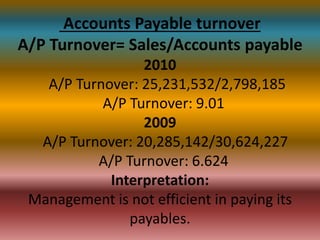
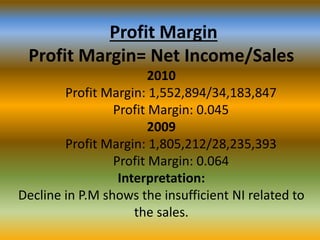
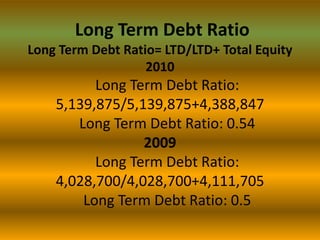
Nestle Pakistan Limited is a subsidiary of
Nestle S.A. based in Switzerland.
 Nestle Pakistan is principally engaged in
the manufacture, and sale of food products
which include milk, yogurt, ghee, cream,
coffee, juices, instant drinks and bottled
water.
 The company also manufactures infant
cereals, breakfast cereals, prepared meals,
chocolates, confectionery .
ALSO
The company markets its products
under international brand names that
include Nescafe, Maggi, Cereal, Milky
bar, Kit Kat, Bar-One, Milkmaid, and
Pure Life.
 The company with three
manufacturing facilities operates all
over Pakistan.
NESTLE MISSION STATEMENT
 We want Nestlé products to be within reach for
every single Pakistani. Yet nutritional value and
quality remain the most essential ingredients in
all our brands.
 Nestlé brands are designed to suit your lifestyle
and your needs. You can take advantage of the
best nutrition in a way that is suitable for your
tastes and lifestyle .
.
Now we will present some current
ratios of Year 2009 & 2010
Formula:
Current ratio=
Current Assets-Inventory / Current
Liability
2010
Current Ratio:
5,684,078/5,306,571
Current Ratio: 1.07
2009
Current Ratio:
5,623,823/5,978,522
Current Ratio: 0.09
Asset turnover ratio
Asset turnover ratio = sales / total
asset
2010
Asset turnover ratio: 34,183,847/16,684,176
Asset turnover ratio: 3.199
2009
Asset turnover ratio: 28,235,393/15,848,574
Asset turnover ratio: 1.78
Interpretation:
Sales of the firm is improved as related to the
total assets
Return on equity
Return on equity = net income /
common equity
2010
Return on equity: 1,552,894/4,388,847
Return on equity: 0.354
2009
Return on equity: 1,865,212/4,111,705
Return on equity: 0.44
Interpretation:
Net Income of the firm is decreased. So the return
against the equity is also not good
Account Receivable Turnover
A/R Turnover= Sales/Account receivable
2010
A/R Turnover: 25,231,532/1,488,103
A/R Turnover: 16.9
2009
A/R Turnover: 20,285,142/2,022,387
A/R Turnover: 10.03

Interpretation:
Firm’s management is efficiently managing its
receivable period.
Accounts Payable turnover
A/P Turnover= Sales/Accounts payable
2010
A/P Turnover: 25,231,532/2,798,185
A/P Turnover: 9.01
2009
A/P Turnover: 20,285,142/30,624,227
A/P Turnover: 6.624
Interpretation:
Management is not efficient in paying its
payables.
Profit Margin
Profit Margin= Net Income/Sales
2010
Profit Margin: 1,552,894/34,183,847
Profit Margin: 0.045
2009
Profit Margin: 1,805,212/28,235,393
Profit Margin: 0.064
Interpretation:
Decline in P.M shows the insufficient NI related to
the sales.
Long Term Debt Ratio
Long Term Debt Ratio= LTD/LTD+ Total Equity
2010

Long Term Debt Ratio:
5,139,875/5,139,875+4,388,847
Long Term Debt Ratio: 0.54
2009
Long Term Debt Ratio:
4,028,700/4,028,700+4,111,705
Long Term Debt Ratio: 0.5
SWOT ANALYSIS
 SWOT stands for strength, weakness,
opportunities and threats for the
company. Following is the SWOT
analysis of Nestle
 Repeatedly ranked as the world's largest
bottled water company and have set up
facilities to operate water resources in a
responsible manner.
CONCLUSION
 Its prices are high against its
competitors but it matches its quality.
 Nestle is largest food and beverage
company with its mission to provide
healthy life style.
 Their excellent distribution channels
make it available at any retailer store.
 Ethical standard are big issue in Nestle
US.
Nestle presentation.

Nestle presentation.

  • 4.
    Introduction Nestle Pakistan Limitedis a subsidiary of Nestle S.A. based in Switzerland.  Nestle Pakistan is principally engaged in the manufacture, and sale of food products which include milk, yogurt, ghee, cream, coffee, juices, instant drinks and bottled water.  The company also manufactures infant cereals, breakfast cereals, prepared meals, chocolates, confectionery .
  • 5.
    ALSO The company marketsits products under international brand names that include Nescafe, Maggi, Cereal, Milky bar, Kit Kat, Bar-One, Milkmaid, and Pure Life.  The company with three manufacturing facilities operates all over Pakistan.
  • 7.
    NESTLE MISSION STATEMENT We want Nestlé products to be within reach for every single Pakistani. Yet nutritional value and quality remain the most essential ingredients in all our brands.  Nestlé brands are designed to suit your lifestyle and your needs. You can take advantage of the best nutrition in a way that is suitable for your tastes and lifestyle . .
  • 9.
    Now we willpresent some current ratios of Year 2009 & 2010 Formula: Current ratio= Current Assets-Inventory / Current Liability
  • 10.
    2010 Current Ratio: 5,684,078/5,306,571 Current Ratio:1.07 2009 Current Ratio: 5,623,823/5,978,522 Current Ratio: 0.09
  • 11.
    Asset turnover ratio Assetturnover ratio = sales / total asset 2010 Asset turnover ratio: 34,183,847/16,684,176 Asset turnover ratio: 3.199 2009 Asset turnover ratio: 28,235,393/15,848,574 Asset turnover ratio: 1.78 Interpretation: Sales of the firm is improved as related to the total assets
  • 12.
    Return on equity Returnon equity = net income / common equity 2010 Return on equity: 1,552,894/4,388,847 Return on equity: 0.354 2009 Return on equity: 1,865,212/4,111,705 Return on equity: 0.44 Interpretation: Net Income of the firm is decreased. So the return against the equity is also not good
  • 13.
    Account Receivable Turnover A/RTurnover= Sales/Account receivable 2010 A/R Turnover: 25,231,532/1,488,103 A/R Turnover: 16.9 2009 A/R Turnover: 20,285,142/2,022,387 A/R Turnover: 10.03 Interpretation: Firm’s management is efficiently managing its receivable period.
  • 15.
    Accounts Payable turnover A/PTurnover= Sales/Accounts payable 2010 A/P Turnover: 25,231,532/2,798,185 A/P Turnover: 9.01 2009 A/P Turnover: 20,285,142/30,624,227 A/P Turnover: 6.624 Interpretation: Management is not efficient in paying its payables.
  • 16.
    Profit Margin Profit Margin=Net Income/Sales 2010 Profit Margin: 1,552,894/34,183,847 Profit Margin: 0.045 2009 Profit Margin: 1,805,212/28,235,393 Profit Margin: 0.064 Interpretation: Decline in P.M shows the insufficient NI related to the sales.
  • 18.
    Long Term DebtRatio Long Term Debt Ratio= LTD/LTD+ Total Equity 2010 Long Term Debt Ratio: 5,139,875/5,139,875+4,388,847 Long Term Debt Ratio: 0.54 2009 Long Term Debt Ratio: 4,028,700/4,028,700+4,111,705 Long Term Debt Ratio: 0.5
  • 20.
    SWOT ANALYSIS  SWOTstands for strength, weakness, opportunities and threats for the company. Following is the SWOT analysis of Nestle  Repeatedly ranked as the world's largest bottled water company and have set up facilities to operate water resources in a responsible manner.
  • 21.
    CONCLUSION  Its pricesare high against its competitors but it matches its quality.  Nestle is largest food and beverage company with its mission to provide healthy life style.  Their excellent distribution channels make it available at any retailer store.  Ethical standard are big issue in Nestle US.