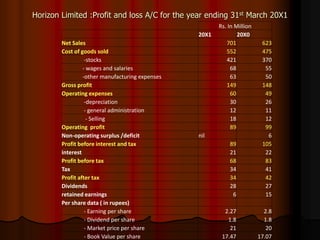
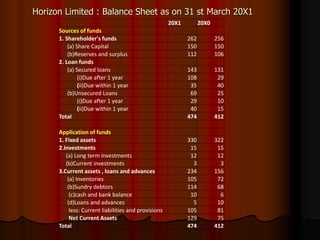
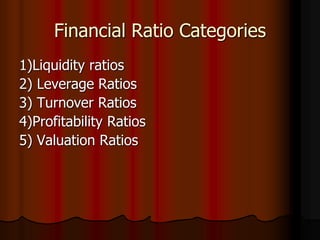
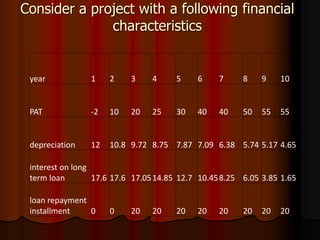
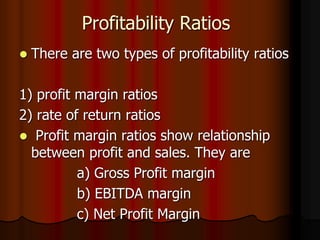
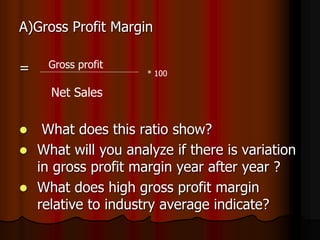
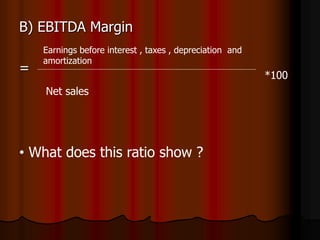
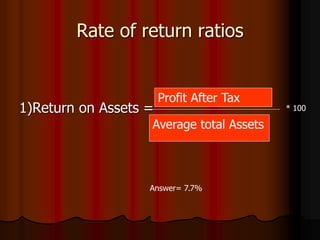
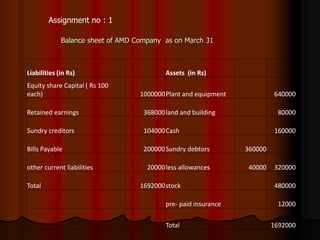
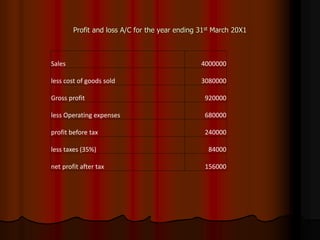
Ratio Analysis
Why do we need ratio Analysis?
- If you want to compare financial statements of
one company with that of the other company,
you would have a problem because of the
differences in size– ratio eliminates the size
problem as the size effectively divides out.
Horizon Limited :Profit and loss A/C for the year ending 31st March 20X1
Rs. In Million
20X1 20X0
Net Sales 701 623
Cost of goods sold 552 475
-stocks 421 370
- wages and salaries 68 55
-other manufacturing expenses 63 50
Gross profit 149 148
Operating expenses 60 49
-depreciation 30 26
- general administration 12 11
- Selling 18 12
Operating profit 89 99
Non-operating surplus /deficit nil 6
Profit before interest and tax 89 105
interest 21 22
Profit before tax 68 83
Tax 34 41
Profit after tax 34 42
Dividends 28 27
retained earnings 6 15
Per share data ( in rupees)
- Earning per share 2.27 2.8
- Dividend per share 1.8 1.8
- Market price per share 21 20
- Book Value per share 17.47 17.07
Horizon Limited : Balance Sheet as on 31 st March 20X1
20X1 20X0
Sources of funds
1. Shareholder's funds 262 256
(a) Share Capital 150 150
(b)Reserves and surplus 112 106
2. Loan funds
(a) Secured loans 143 131
(i)Due after 1 year 108 29
(ii)Due within 1 year 35 40
(b)Unsecured Loans 69 25
(i)Due after 1 year 29 10
(ii)Due within 1 year 40 15
Total 474 412
Application of funds
1. Fixed assets 330 322
2.Investments 15 15
(a) Long term investments 12 12
(b)Current investments 3 3
3.Current assets , loans and advances 234 156
(a) Inventories 105 72
(b)Sundry debtors 114 68
(c)cash and bank balance 10 6
(d)Loans and advances 5 10
less: Current liabilities and provisions 105 81
Net Current Assets 129 75
Total 474 412
Financial Ratio Categories
1)Liquidity ratios
2) Leverage Ratios
3) Turnover Ratios
4)Profitability Ratios
5) Valuation Ratios
Liquidity Ratio
 It shows firms ability to meet current
obligations.
1) Current ratio= ( CA/CL)
2) Quick ratio or acid-test ratio = ( CA-
inventories) / CL
Consider a project with a following financial
characteristics
year 1 2 3 4 5 6 7 8 9 10
PAT -2 10 20 25 30 40 40 50 55 55
depreciation 12 10.8 9.72 8.75 7.87 7.09 6.38 5.74 5.17 4.65
interest on long
term loan 17.6 17.6 17.0514.85 12.7 10.458.25 6.05 3.85 1.65
loan repayment
installment 0 0 20 20 20 20 20 20 20 20
Profitability Ratios
 There are two types of profitability ratios
1) profit margin ratios
2) rate of return ratios
 Profit margin ratios show relationship
between profit and sales. They are
a) Gross Profit margin
b) EBITDA margin
c) Net Profit Margin
 Rate of return ratios reflect the
relationship between profit and
investment.
a) return on assets
b) Earning power
c) Return on Capital employed
d) Return on equity
A)Gross Profit Margin
=
 What does this ratio show?
 What will you analyze if there is variation
in gross profit margin year after year ?
 What does high gross profit margin
relative to industry average indicate?
Gross profit
Net Sales
* 100
B) EBITDA Margin
=
Earnings before interest , taxes , depreciation and
amortization
Net sales
*100
• What does this ratio show ?
 C) Net Profit Margin
=
Net Profit
Net Sales
*100
 What does this ratio show?
 this ratio also indicates firms capacity to
face adverse economic conditions.
 Gross profit margin has increased over
years but net profit margin has either
remained constant or declined ….what do
u make of it ?
Rate of return ratios
1)Return on Assets =
Average total Assets
Profit After Tax
* 100
Answer= 7.7%
2 ) Earning power = Profit before interest and tax
Average total assets
* 100
Answer= 20.1%
 3 )Return on Capital Employed
=
Profit before interest and tax ( 1- tax rate )
Average Total Assets
*100
Answer=10.1%
What do you think of this result?
 Well, the question we have to ask is :
Could we have earned more money ( profit)
If we had invested in a different business or
simply put on money in the bank?
 ROCE should be compared to what ?
 Suppose you had a choice to put Rs
10,000 in a fixed deposit, either with Bank
A, which offers 8 per cent interest per
annum, or with Bank B, which offers 10
per cent per annum. Everything else
(including risk) being equal, which bank
would you opt for?
 Bank B, it should be, since it gives you
more ‘‘bang for your buck''
4) Return on equity
“The income you earn on your funds — the bang for the buck — is in
essence, your return on equity (the funds invested by you).”
Return of equity
=
Equity Earnings
Average Equity
* 100
=
PAT – preference
dividends
Average Equity
* 100
Answer= 13.1%
 What does this ratio measure?
 Example : Paint Company
 Benchmarks and Variants : Q: What ROE
can be compared with?
 While there is no single ideal ROE for a
company, a metric in excess of sector
averages is considered desirable
Valuation Ratios
 Valuation ratios indicate how the equity
stock of the company is assessed in the
capital markets.
1) PE ratio ( price – earnings ratio)
= Market price per share
Earnings per share
 Q: What does it tell ?
 A: Theoretically, a stock's P/E tells us how much investors are
willing to pay per rupee of earnings.
 Q: what does stock price reflect?
 Example : Microsoft
 Cheap or Expensive?
The P/E ratio is a much better indicator of
the value of a stock than the market price
alone. For example, all things being equal,
a Rs.10 stock with a P/E of 75 is much
more "expensive" than a Rs.100 stock
with a P/E of 20.
 Q:Historical P/E Ratio ( Also called “trailing
PE”)
 A: Devide current market price by its last
year EPS .
 Q: Forward P/E Multiple
 A: Devide current market price by its estimated
next year EPS.
 it is forward PE that holds more relevance to
investors when evaluating a company.
 companies perceived as “risky “usually trade at
lower multiples, as the market expects
fluctuations in their operating results.
.
 The quality of the P/E ratio is only as good
as the quality of the underlying earnings
number.
 It's also worthwhile to look at the current P/E ratio for the
overall market (Sensex, nifty), the company's industry
segment, and two or three direct competitor companies.
This comparative exercise can help investors evaluate the
P/E of their prospective stock purchase as being in a high,
low or moderate price range.
 Can a stock have a negative P/E ratio?
 how to use PE ratio to decide whether
shares of the company are undervalued or
over valued?
 P/E, as a standalone number, means
little.
 Q: What do you mean when you say that
company is “ billion dollar “ company?
 A: what you are actually talking about is “
Enterprise Value”
 Enterprise value is the sum of the market
value of equity and market value of debt .
 2) EV- EBITDA Ratio
=
Enterprise Value
Earnings before interest , tax , depreciation
and amortisation
 What is main advantage of EV- EBITDA
ratio over PE multiple ?
 ( Hint : Consider what happens if a
company issues shares and uses the
money it raises to pay off its debt?)
3) Market Value to Book Value ratio :
=
Market Value per share
Book Value per share
• Q: What is book value?
• A: It is the price paid for a particular
asset…..eg. House
•Q: Why book values are useful ?
• A: to track profit and loss
• Book Value = Assets- Liabilities
•( More Specifically, Book Value= Total Assets
–intangible assets and liabilities.)
• Assume a company has Rs.100 million in
assets on the balance sheet and Rs.75 million
in liabilities. The book value of that company
would be ?
 Rs.25 million
 If there are 10 million shares outstanding,
book value per share would be?
 Rs 2.5
 In other words, if you wanted to close the
doors, how much would be left after you
settled all the outstanding obligations and
sold off all the assets.
.
 Q: Types of investors ?
 A: Value investors and Growth investors
 Value investing : It is the strategy of
selecting stocks that trade for less than
what they are really worth.
 Value investors typically take into
consideration attributes like low price to
earnings ratio (P/E), price to book ratio
(P/B), price to sales ratio (P/S) and high
dividend yields.
 What Does P/B Tell Us?
For value investors, P/B remains a tried
and tested method for finding low-priced
stocks that the market has neglected.
 Q:What does lower P/B ratio mean?
 A: A lower P/B ratio could mean the price
that the market is quoting does not justify
the current value of the assets of the
company that it presently holds.
 Q:But how this ratio is useful to you and
me?
• A: This ratio guards you against paying a very high
price for a company because it compares the price to
what you could recover if the company were to suddenly
close down.
 If a company's ROE is growing, its
P/B ratio should be doing the same.
Balance sheet of AMD Company as on March 31
Liabilities (in Rs) Assets (in Rs)
Equity share Capital ( Rs 100
each) 1000000Plant and equipment 640000
Retained earnings 368000land and building 80000
Sundry creditors 104000Cash 160000
Bills Payable 200000Sundry debtors 360000
other current liabilities 20000less allowances 40000 320000
Total 1692000stock 480000
pre- paid insurance 12000
Total 1692000
Assignment no : 1
Profit and loss A/C for the year ending 31st March 20X1
Sales 4000000
less cost of goods sold 3080000
Gross profit 920000
less Operating expenses 680000
profit before tax 240000
less taxes (35%) 84000
net profit after tax 156000
Sundry Debtors and stock at the beginning of the year
were Rs. 300000 and Rs. 400000, respectively .
Determine the following ratios :
a) Current ratio
b) Acid test ratio
c) stock turnover
d) debtors’ turnover
e) Gross profit ratio
f) Net profit ratio
g) Earnings per share
i) Rate of return on equity capital
j)Market Value of the share if P/E ratio is 10 times.

Ratio Analysis Power Point Presentation .ppt

  • 1.
  • 2.
    Why do weneed ratio Analysis? - If you want to compare financial statements of one company with that of the other company, you would have a problem because of the differences in size– ratio eliminates the size problem as the size effectively divides out.
  • 3.
    Horizon Limited :Profitand loss A/C for the year ending 31st March 20X1 Rs. In Million 20X1 20X0 Net Sales 701 623 Cost of goods sold 552 475 -stocks 421 370 - wages and salaries 68 55 -other manufacturing expenses 63 50 Gross profit 149 148 Operating expenses 60 49 -depreciation 30 26 - general administration 12 11 - Selling 18 12 Operating profit 89 99 Non-operating surplus /deficit nil 6 Profit before interest and tax 89 105 interest 21 22 Profit before tax 68 83 Tax 34 41 Profit after tax 34 42 Dividends 28 27 retained earnings 6 15 Per share data ( in rupees) - Earning per share 2.27 2.8 - Dividend per share 1.8 1.8 - Market price per share 21 20 - Book Value per share 17.47 17.07
  • 4.
    Horizon Limited :Balance Sheet as on 31 st March 20X1 20X1 20X0 Sources of funds 1. Shareholder's funds 262 256 (a) Share Capital 150 150 (b)Reserves and surplus 112 106 2. Loan funds (a) Secured loans 143 131 (i)Due after 1 year 108 29 (ii)Due within 1 year 35 40 (b)Unsecured Loans 69 25 (i)Due after 1 year 29 10 (ii)Due within 1 year 40 15 Total 474 412 Application of funds 1. Fixed assets 330 322 2.Investments 15 15 (a) Long term investments 12 12 (b)Current investments 3 3 3.Current assets , loans and advances 234 156 (a) Inventories 105 72 (b)Sundry debtors 114 68 (c)cash and bank balance 10 6 (d)Loans and advances 5 10 less: Current liabilities and provisions 105 81 Net Current Assets 129 75 Total 474 412
  • 5.
    Financial Ratio Categories 1)Liquidityratios 2) Leverage Ratios 3) Turnover Ratios 4)Profitability Ratios 5) Valuation Ratios
  • 6.
    Liquidity Ratio  Itshows firms ability to meet current obligations. 1) Current ratio= ( CA/CL) 2) Quick ratio or acid-test ratio = ( CA- inventories) / CL
  • 7.
    Consider a projectwith a following financial characteristics year 1 2 3 4 5 6 7 8 9 10 PAT -2 10 20 25 30 40 40 50 55 55 depreciation 12 10.8 9.72 8.75 7.87 7.09 6.38 5.74 5.17 4.65 interest on long term loan 17.6 17.6 17.0514.85 12.7 10.458.25 6.05 3.85 1.65 loan repayment installment 0 0 20 20 20 20 20 20 20 20
  • 8.
    Profitability Ratios  Thereare two types of profitability ratios 1) profit margin ratios 2) rate of return ratios  Profit margin ratios show relationship between profit and sales. They are a) Gross Profit margin b) EBITDA margin c) Net Profit Margin
  • 9.
     Rate ofreturn ratios reflect the relationship between profit and investment. a) return on assets b) Earning power c) Return on Capital employed d) Return on equity
  • 10.
    A)Gross Profit Margin = What does this ratio show?  What will you analyze if there is variation in gross profit margin year after year ?  What does high gross profit margin relative to industry average indicate? Gross profit Net Sales * 100
  • 11.
    B) EBITDA Margin = Earningsbefore interest , taxes , depreciation and amortization Net sales *100 • What does this ratio show ?
  • 12.
     C) NetProfit Margin = Net Profit Net Sales *100
  • 13.
     What doesthis ratio show?  this ratio also indicates firms capacity to face adverse economic conditions.  Gross profit margin has increased over years but net profit margin has either remained constant or declined ….what do u make of it ?
  • 14.
    Rate of returnratios 1)Return on Assets = Average total Assets Profit After Tax * 100 Answer= 7.7%
  • 15.
    2 ) Earningpower = Profit before interest and tax Average total assets * 100 Answer= 20.1%
  • 16.
     3 )Returnon Capital Employed = Profit before interest and tax ( 1- tax rate ) Average Total Assets *100 Answer=10.1%
  • 17.
    What do youthink of this result?  Well, the question we have to ask is : Could we have earned more money ( profit) If we had invested in a different business or simply put on money in the bank?  ROCE should be compared to what ?
  • 18.
     Suppose youhad a choice to put Rs 10,000 in a fixed deposit, either with Bank A, which offers 8 per cent interest per annum, or with Bank B, which offers 10 per cent per annum. Everything else (including risk) being equal, which bank would you opt for?  Bank B, it should be, since it gives you more ‘‘bang for your buck'' 4) Return on equity
  • 19.
    “The income youearn on your funds — the bang for the buck — is in essence, your return on equity (the funds invested by you).” Return of equity = Equity Earnings Average Equity * 100 = PAT – preference dividends Average Equity * 100 Answer= 13.1%
  • 20.
     What doesthis ratio measure?  Example : Paint Company  Benchmarks and Variants : Q: What ROE can be compared with?  While there is no single ideal ROE for a company, a metric in excess of sector averages is considered desirable
  • 21.
    Valuation Ratios  Valuationratios indicate how the equity stock of the company is assessed in the capital markets. 1) PE ratio ( price – earnings ratio) = Market price per share Earnings per share
  • 22.
     Q: Whatdoes it tell ?  A: Theoretically, a stock's P/E tells us how much investors are willing to pay per rupee of earnings.  Q: what does stock price reflect?  Example : Microsoft
  • 23.
     Cheap orExpensive? The P/E ratio is a much better indicator of the value of a stock than the market price alone. For example, all things being equal, a Rs.10 stock with a P/E of 75 is much more "expensive" than a Rs.100 stock with a P/E of 20.  Q:Historical P/E Ratio ( Also called “trailing PE”)  A: Devide current market price by its last year EPS .  Q: Forward P/E Multiple
  • 24.
     A: Devidecurrent market price by its estimated next year EPS.  it is forward PE that holds more relevance to investors when evaluating a company.  companies perceived as “risky “usually trade at lower multiples, as the market expects fluctuations in their operating results. .
  • 25.
     The qualityof the P/E ratio is only as good as the quality of the underlying earnings number.  It's also worthwhile to look at the current P/E ratio for the overall market (Sensex, nifty), the company's industry segment, and two or three direct competitor companies. This comparative exercise can help investors evaluate the P/E of their prospective stock purchase as being in a high, low or moderate price range.
  • 26.
     Can astock have a negative P/E ratio?  how to use PE ratio to decide whether shares of the company are undervalued or over valued?  P/E, as a standalone number, means little.
  • 27.
     Q: Whatdo you mean when you say that company is “ billion dollar “ company?  A: what you are actually talking about is “ Enterprise Value”  Enterprise value is the sum of the market value of equity and market value of debt .
  • 28.
     2) EV-EBITDA Ratio = Enterprise Value Earnings before interest , tax , depreciation and amortisation
  • 29.
     What ismain advantage of EV- EBITDA ratio over PE multiple ?  ( Hint : Consider what happens if a company issues shares and uses the money it raises to pay off its debt?)
  • 30.
    3) Market Valueto Book Value ratio : = Market Value per share Book Value per share
  • 31.
    • Q: Whatis book value? • A: It is the price paid for a particular asset…..eg. House •Q: Why book values are useful ? • A: to track profit and loss • Book Value = Assets- Liabilities •( More Specifically, Book Value= Total Assets –intangible assets and liabilities.) • Assume a company has Rs.100 million in assets on the balance sheet and Rs.75 million in liabilities. The book value of that company would be ?
  • 32.
     Rs.25 million If there are 10 million shares outstanding, book value per share would be?  Rs 2.5  In other words, if you wanted to close the doors, how much would be left after you settled all the outstanding obligations and sold off all the assets. .
  • 33.
     Q: Typesof investors ?  A: Value investors and Growth investors  Value investing : It is the strategy of selecting stocks that trade for less than what they are really worth.  Value investors typically take into consideration attributes like low price to earnings ratio (P/E), price to book ratio (P/B), price to sales ratio (P/S) and high dividend yields.
  • 34.
     What DoesP/B Tell Us? For value investors, P/B remains a tried and tested method for finding low-priced stocks that the market has neglected.  Q:What does lower P/B ratio mean?  A: A lower P/B ratio could mean the price that the market is quoting does not justify the current value of the assets of the company that it presently holds.
  • 35.
     Q:But howthis ratio is useful to you and me? • A: This ratio guards you against paying a very high price for a company because it compares the price to what you could recover if the company were to suddenly close down.  If a company's ROE is growing, its P/B ratio should be doing the same.
  • 36.
    Balance sheet ofAMD Company as on March 31 Liabilities (in Rs) Assets (in Rs) Equity share Capital ( Rs 100 each) 1000000Plant and equipment 640000 Retained earnings 368000land and building 80000 Sundry creditors 104000Cash 160000 Bills Payable 200000Sundry debtors 360000 other current liabilities 20000less allowances 40000 320000 Total 1692000stock 480000 pre- paid insurance 12000 Total 1692000 Assignment no : 1
  • 37.
    Profit and lossA/C for the year ending 31st March 20X1 Sales 4000000 less cost of goods sold 3080000 Gross profit 920000 less Operating expenses 680000 profit before tax 240000 less taxes (35%) 84000 net profit after tax 156000
  • 38.
    Sundry Debtors andstock at the beginning of the year were Rs. 300000 and Rs. 400000, respectively . Determine the following ratios : a) Current ratio b) Acid test ratio c) stock turnover d) debtors’ turnover e) Gross profit ratio f) Net profit ratio g) Earnings per share i) Rate of return on equity capital j)Market Value of the share if P/E ratio is 10 times.