Download to read offline

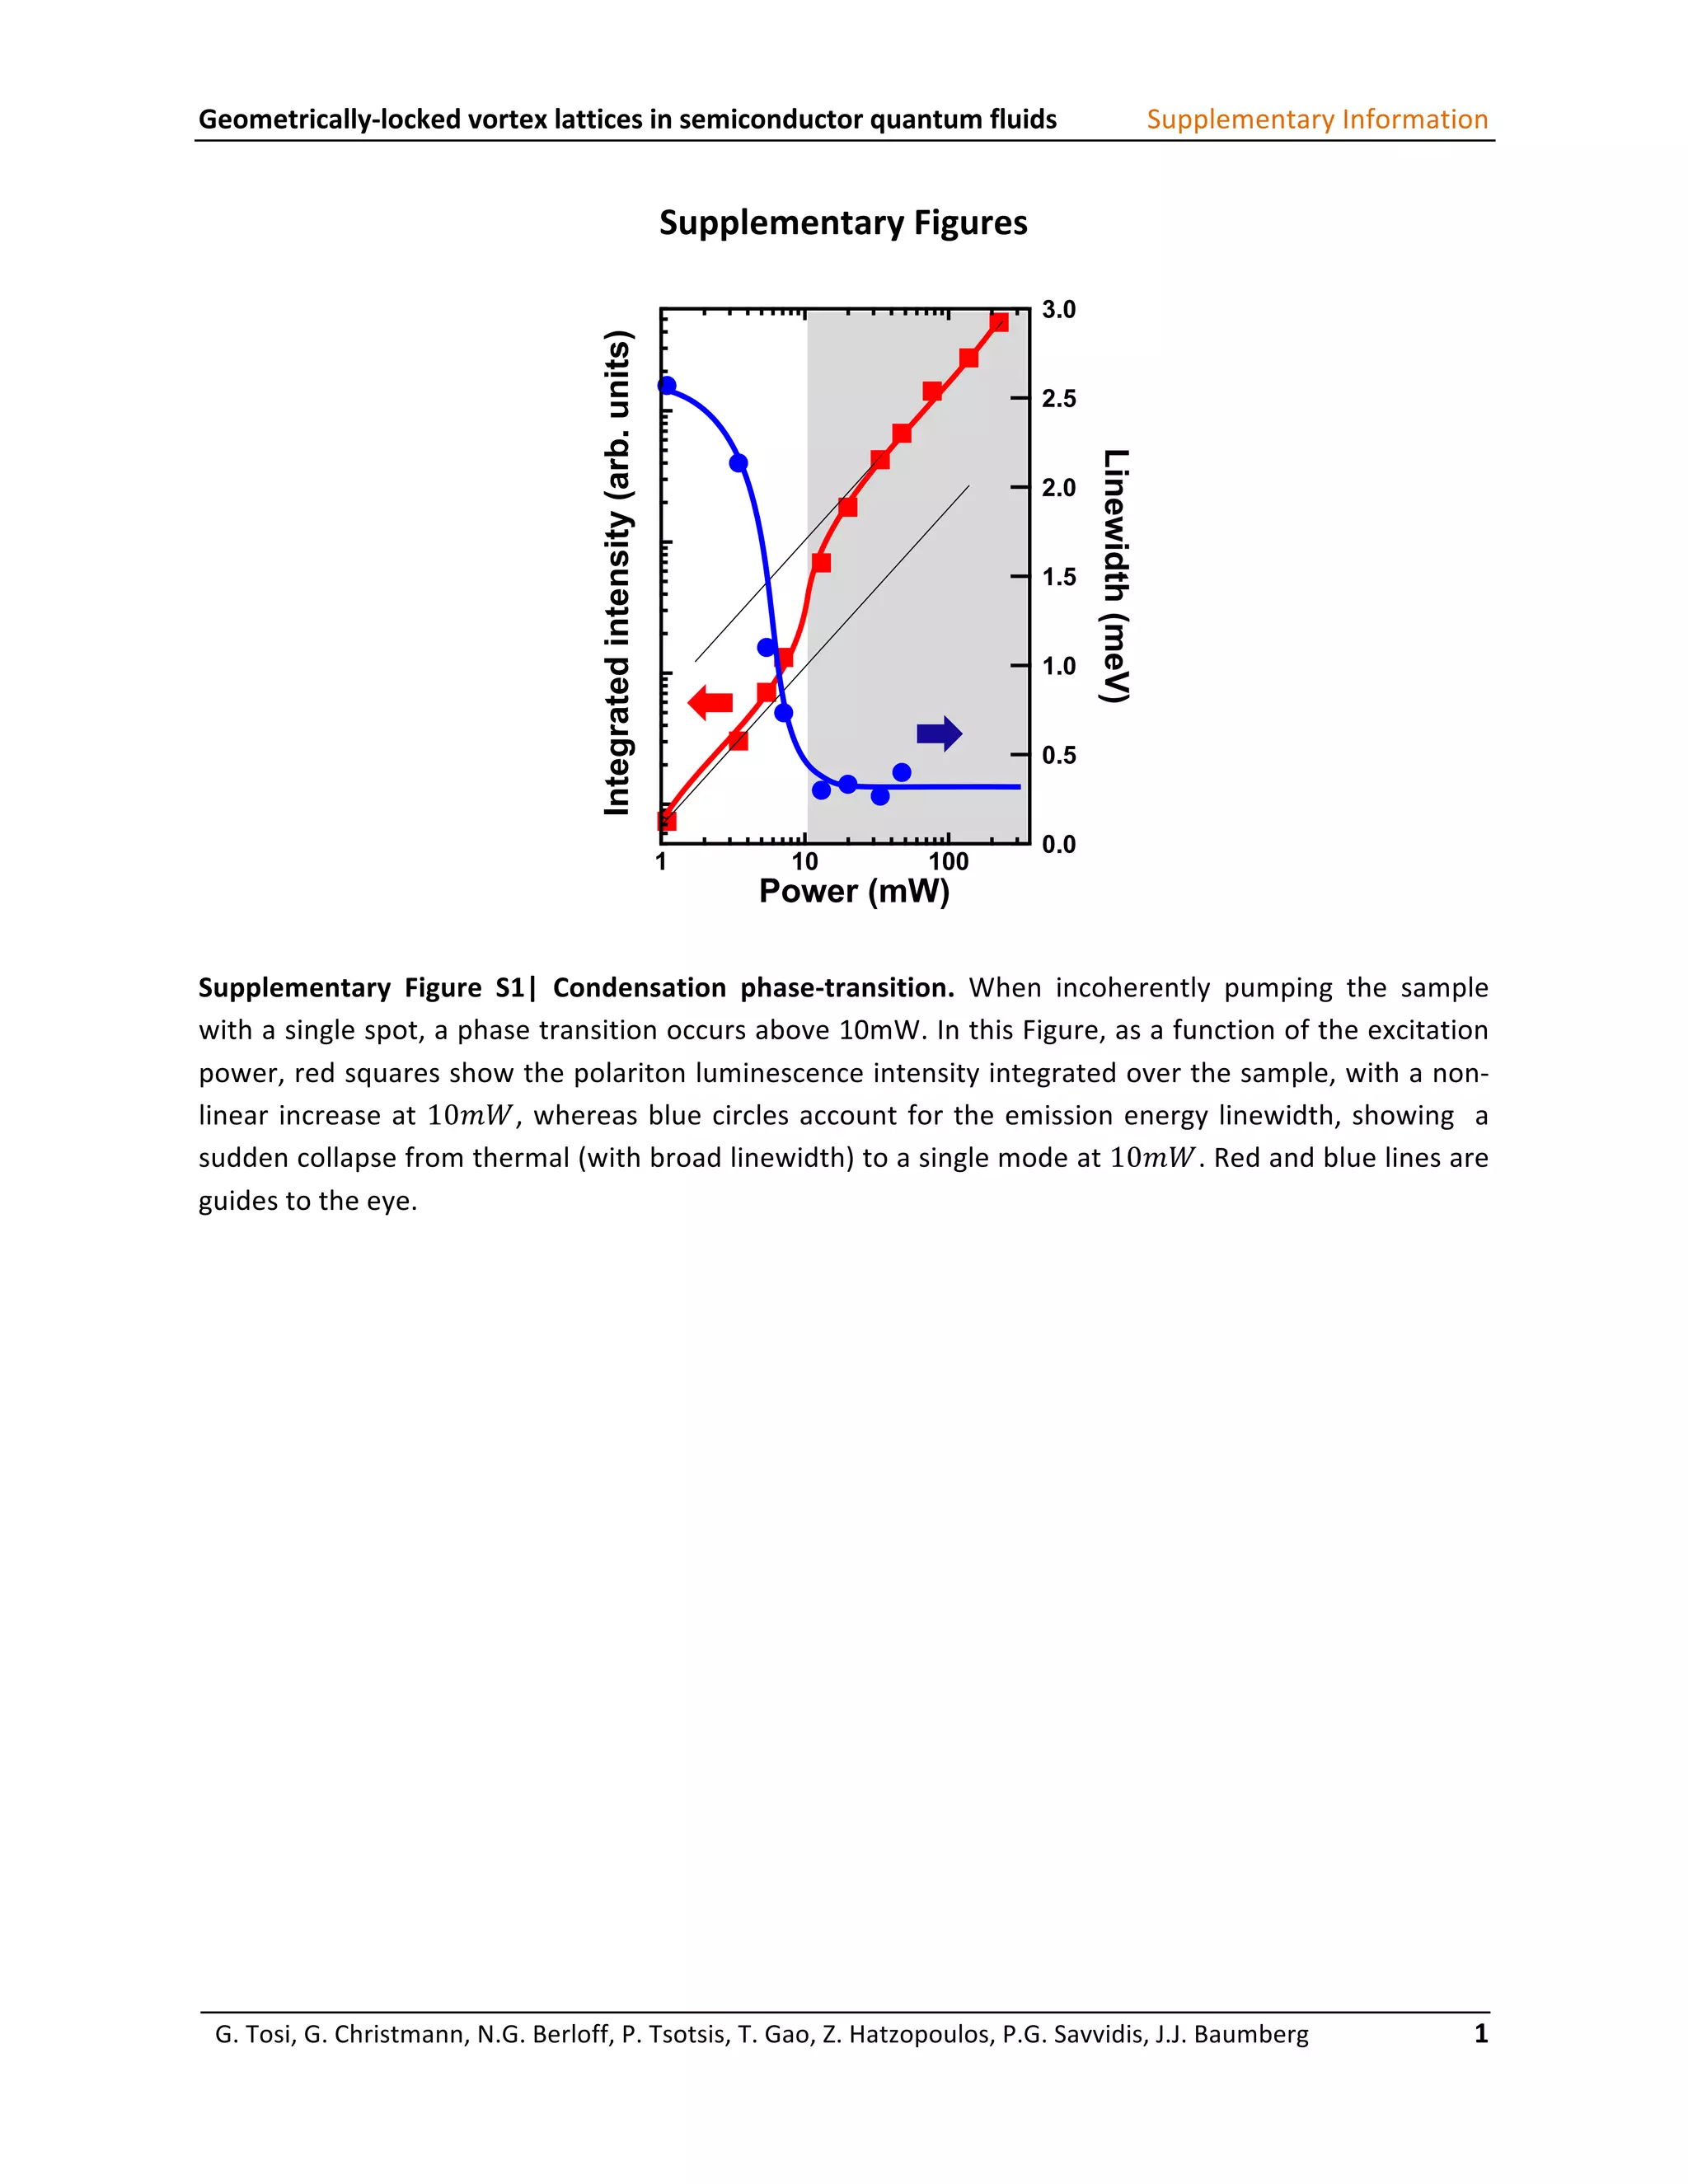
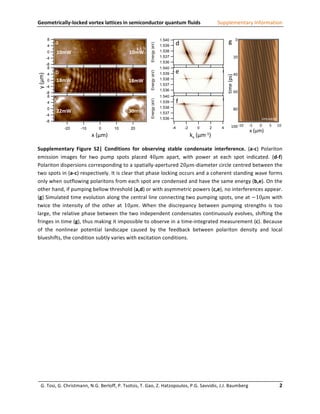
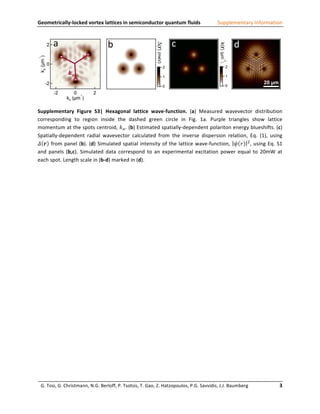
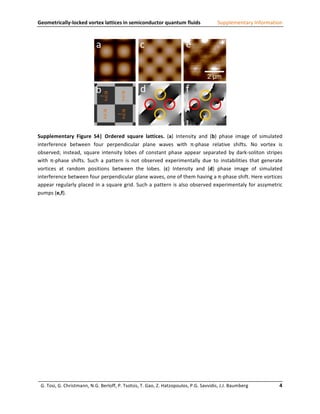
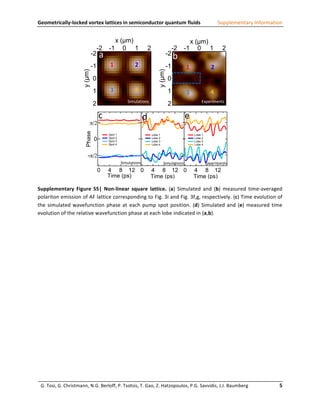

This document provides supplementary information to support a study on geometrically-locked vortex lattices in semiconductor quantum fluids. Figure S1 shows experimental data on the condensation phase transition that occurs in the quantum fluid above 10 mW of pumping power. Figure S2 demonstrates the conditions needed to observe stable interference between condensates from two pump spots, including the requirement that they have the same energy level. Figure S3 simulates the hexagonal lattice wavefunction that arises from the interference pattern. Figure S4 shows simulations of ordered square lattices that can form from interference between four plane waves.


![[iGEM Workshop] Coming up with a Project](https://cdn.slidesharecdn.com/ss_thumbnails/igemworkshopcomingupwithaproject-111228021259-phpapp02-thumbnail.jpg?width=640&height=640&fit=bounds)


