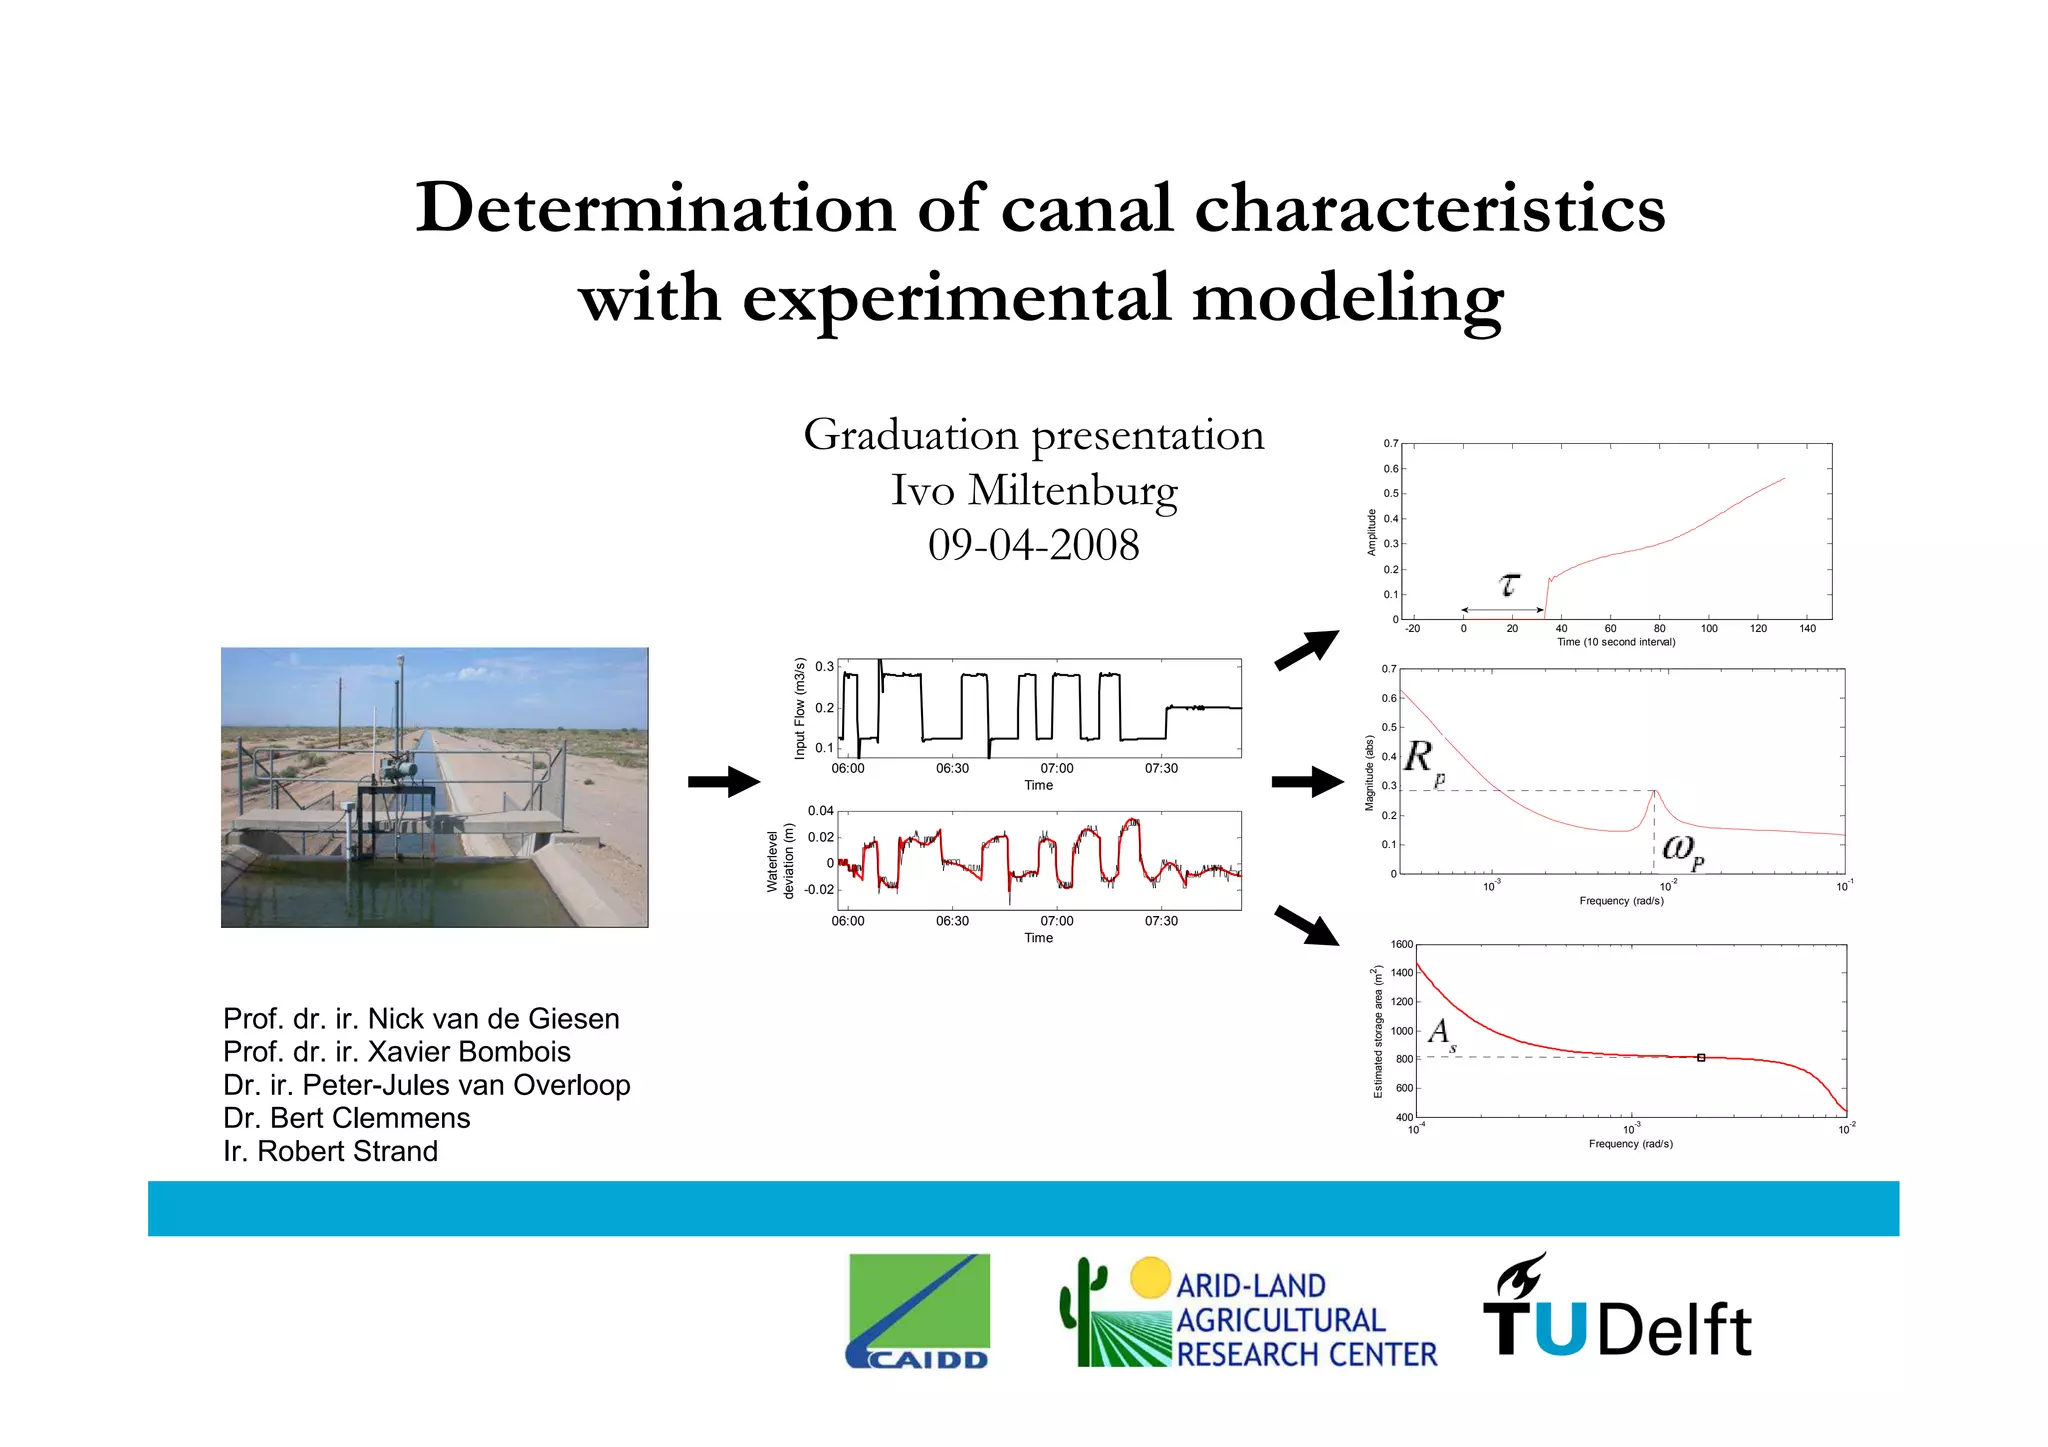
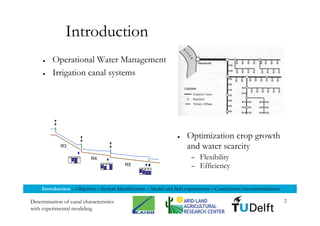
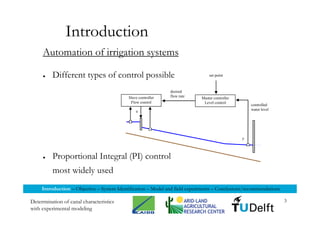
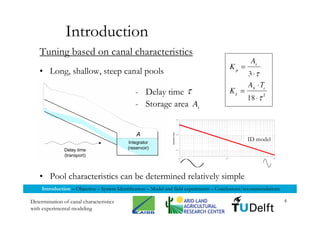
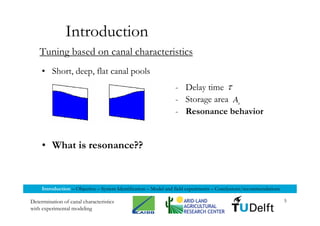
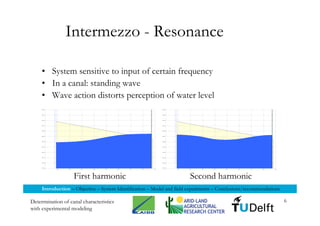
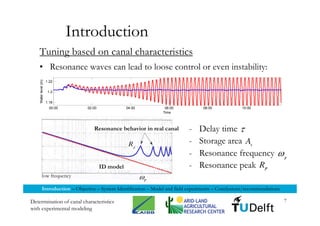
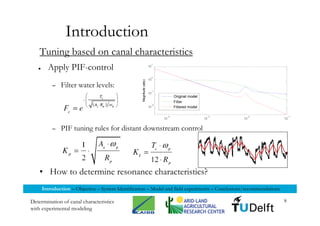
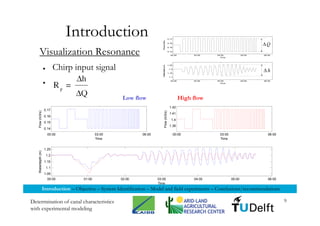
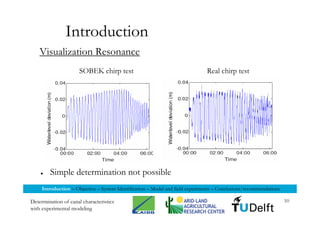
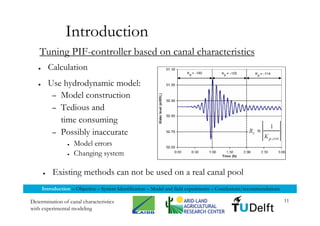
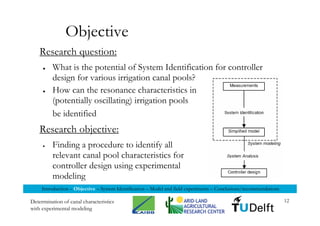
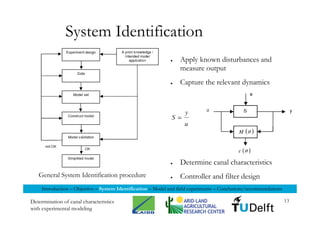
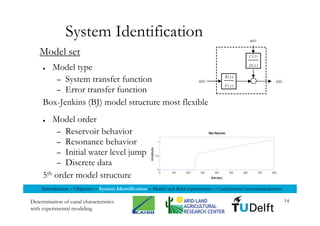
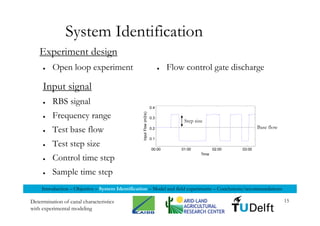
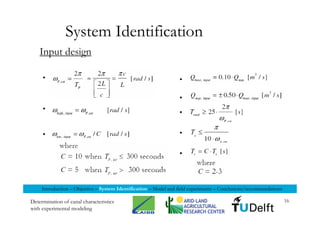
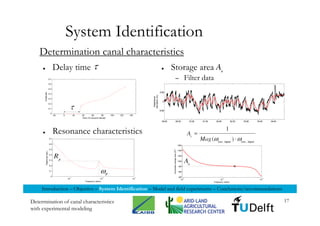
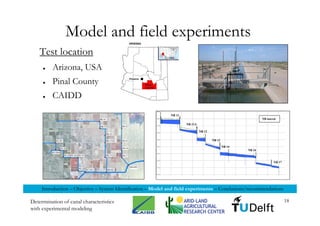
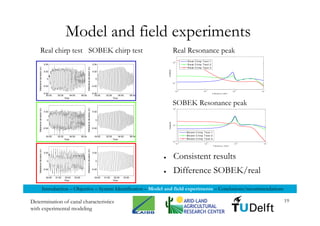
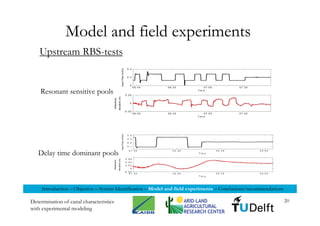
Presentation of my M.Sc. graduation work, titled "Determination of canal pool characteristics with experimental modeling". It describes the use of System Identification techniques to identify (irrigation) canal pool characteristics needed for automatic controller design from tests on the real canal rather than on model representations. There is a special focus on potential resonance behavior of canal pools and the identification of these characteristics. Experiments on irrigation canal pools in Arizona, USA are described.
This document discusses using boosted decision trees to select important hyperspectral bands for geology classification. It aims to reduce dimensionality and processing time while maintaining classification accuracy. The method embeds band selection within the boosting process to identify the most informative bands. Experiments are conducted on hyperspectral data from an iron ore mine to evaluate the approach.
The document presents preliminary results on daily radiation forecasting using statistical methods. It explores using linear and non-linear prediction techniques like TAG(p) and discusses using historical piranometric data from 1996-2003 to predict daily global solar radiation values and analyze the data through partial autocorrelation. The goals are to characterize and predict solar radiation as an energy resource for applications like short and medium term forecasting.
This document reviews different techniques for predicting solar irradiance levels including:
1) Numerical weather prediction models and statistical prediction for short to long term forecasting.
2) MOS (Model Output Statistics) techniques using sky cover products from weather centers for short term prediction.
3) Satellite-based methods comparing different approaches and error analysis for short term forecasting.
4) Signal analysis techniques including wavelet transforms and artificial neural networks combined with recurrent networks for improved prediction.
Future work proposed includes combining these methods along with normalized data and forecasts from weather centers to improve prediction accuracy across timescales.
The presentation I gave for my 2011 annual review to the key stakeholders in the division. I put a good amount of time into working on the composition, structure & delivery of this presentation, and was very happy with how it went. If you're looking for ideas on how to present yourself in the best possible way to your managers, here's the ticket!
This document provides an overview of three-dimensional displays, from physiological depth cues to electronic holograms. It discusses depth cues our eyes use to perceive depth, including psychological cues like occlusion and physiological cues like binocular disparity. Examples of 3D displays that provide some depth cues, like lenticular sheets, are described. The document also covers holograms, including how they can provide all depth cues by reconstructing the original wavefront. It discusses challenges like the large amount of information in holograms and methods to reduce it, like rainbow and multiplex holograms. Computer generated and electronic holograms using dynamic modulators are also summarized.
This document is a Smith chart that was created in 2009 by Alberto Tama Franco from ESPOL. The chart maps the normalized impedance and admittance coordinates used for analyzing electric circuits. It includes scales for resistance, conductance, capacitive reactance, and inductive reactance components.
NCRI - Latest Evidence For Screening In Cancer (March08)Alex J Mitchell
This is a briefing given to the COMPASS group http://www.compasscollaborative.com/ part of the NCRI regarding the latest methods of screening for distress in cancer.
Econstor is a subject repository for economics that contains over 700,000 documents and 25,000 working/discussion paper series. It aggregates scholarly literature in economics including articles, books, book parts, reviews, conferences papers, theses, reports, and working papers. The repository supports research in economics and ensures long-term preservation and open access to economic literature. It is built on the DSpace platform and manages content acquisition, community management, dissemination of information, and integration into broader research networks.
Honkela. Lagus & Kanner: Parallel Conceptual Spaces and Systems in Health and...Timo Honkela
Timo Honkela, Krista Lagus & Antti Kanner from the University of Helsinki presented on parallel conceptual spaces and systems in health and wellbeing at Södertörn University, Sweden on August 26, 2016. They discussed using conceptual spaces to integrate different frameworks for understanding health and wellbeing, including Western medicine, Ayurvedic medicine, and traditional Chinese medicine. They proposed using high-dimensional conceptual spaces and unsupervised machine learning to map relationships between concepts across frameworks in order to complement existing systems and uncover previously unknown conceptual systems.
The document discusses the benefits of exercise for mental health. It states that regular physical activity can help reduce anxiety and depression and improve mood and cognitive function. Exercise causes chemical changes in the brain that may help alleviate symptoms of mental illness.
Great plains Parts manual 3 s 4000f section folding drillPartCatalogs Net
This document is a parts manual for a Great Plains 40' 3-section folding drill. It provides an overview of the manual and instructions on its use. The manual contains detailed diagrams and part listings for all components of the drill, including the tongue, transport axle, toolbars, fertilizer boxes, seed cups, gauge wheels, drives, openers, and press wheels. Safety warnings are prominently marked. The manufacturer provides the manual without warranty and reserves the right to revise it over time.
An Inter Laboratory Comparison Study on Biological Products for Bacterial End...Pradeep Ganganala
This document summarizes the results of an inter-laboratory comparison study coordinated by the Quality Management Unit of the National Institute of Biologicals in India to evaluate laboratories' ability to perform the bacterial endotoxin test by gel clot method. Eight laboratories participated in the study and were provided four test samples to analyze. Six laboratories produced satisfactory results, following the test protocol correctly and reporting results as expected. Two laboratories made errors, such as incorrectly calculating the maximum valid dilution or expressing results at the wrong dilution, showing a need for improvement in technical competence for this important safety test. The study assessed laboratories' performance on this quality control parameter to help identify deficiencies and facilitate laboratory improvement.
Manufacturing companies need an innovative solution to manage small part inventory levels and prevent production line halts caused by stock outs. Inventory Management by Weight uses load cell bin scales connected to sensors to digitally monitor the weight of individual part bins and alert companies when stocks are low, saving costs while improving visibility and ensuring no stock outs.
Aprendizado de Máquina e Visualização de Informação para otimização de Sistem...Robson Motta
[Apresentação feita no TDC 2015 em Porto Alegre]
Sistemas de Recomendação motivam grande quantidade e diversidade de pesquisas, tanto na academia como no meio corporativo. Porém, ao se tratar de seu uso prático, até mesmo os melhores resultados científicos apresentam problemas que exigem otimização para o domínio específico. Nesta palestra teremos uma introdução da construção de recomendações no contexto de produtos em e-commerces, e de forma mais aprofundada veremos como executar uma otimização dos resultados utilizando outras técnicas de Aprendizado de Máquina com apoio de Visualização de Informação.
Timo Honkela: Models for Self-Organization of Health CareTimo Honkela
This document discusses models for self-organizing healthcare systems and describes a real case example of a patient visiting 29 doctors over 4 months, receiving 17 prescriptions, and taking 5 periods of sick leave due to difficulties diagnosing and treating their condition. It proposes a system with bottom-up elements where individuals are responsible for themselves while experts provide recommendations and all parties can contribute information monitored for its effectiveness. An architectural outline is presented with a "broker" helping match people with health problems to providers based on a "content vector" of individualized information. Continuous evaluation of outcomes is suggested to improve the system over time.
This document contains a portfolio for an ES 342 GIS course. It includes sections on coordinate systems, raster analysis, Python basics, editing skills, networks, geocoding, ethics, and metadata. For the coordinate systems section, the document discusses working with different projections and resolving coordinate system issues. The raster analysis section covers contouring, digital elevation models, and performing analysis in raster format. Python scripting is demonstrated for generating a buffer. The basics of editing terminology and skills are reviewed. Other sections discuss network analysis, geocoding addresses, spatial confidentiality and ethics, and metadata standards. Screenshots and maps from exercises are included throughout.
This document provides an overview of water disinfection, focusing on chlorination and chloramination. It discusses why disinfection is needed to kill pathogens, and the purpose of maintaining disinfectant residuals in distribution systems. It then covers various disinfectants and their characteristics, including chlorine, chloramines, chlorine dioxide, ozone and UV. The basics of chlorination and chloramination processes are explained in detail. The document also addresses unintended consequences like nitrification that can occur with chloramination and how to control it.
This document discusses Brazil's earth observation programs and deforestation monitoring efforts. It summarizes INPE's role in monitoring deforestation in the Amazon using Landsat images to produce annual deforestation rates. It also discusses bilateral and multilateral agreements related to earth observation. Furthermore, it provides details on deforestation monitoring programs in the state of Acre, including high resolution imagery analysis and developing biomass estimates using field plots. Considerations for baseline setting and ensuring transparency, consistency and integration between national and sub-national monitoring systems are also outlined.
Apos11 defining dt cut-offs using function [p p1-52 fri]AJMitchell_Posters
This study aimed to empirically define cut-points for mild, moderate, and severe distress using the Distress Thermometer (DT) scale by examining levels of daily functioning. The researchers analyzed data from over 1000 cancer patients in the UK assessing DT scores and levels of difficulty with daily activities. They found that average DT scores increased with greater functional impairment, from 2.1 for those unimpaired to 6.5 for those severely impaired. Based on these results, the researchers concluded that DT scores of 4-5 could indicate mild distress, 6-7 moderate distress, and 8-10 severe distress.
This document describes the development and extension of hull girder progressive collapse analysis methods for lightweight naval vessels. It presents the Smith Progressive Collapse Method and introduces the Extended Progressive Collapse Method, which adapts the approach to consider compartment-level elements rather than assuming independent interframe behavior. A case study analysis of an aluminum multihull vessel's longitudinal bending capacity is performed using the extended method and compared to nonlinear finite element analysis results, showing close agreement. The extended method and its ProColl implementation provide a simplified but accurate means of assessing the ultimate strength and collapse behavior of lightweight hull structures.
The document discusses using quasi-Monte Carlo integration to generate molecular shape fingerprints for efficient comparison of molecular shapes. Shape fingerprints represent the shape of a molecule as a bit string based on whether quasi-random points fall inside or outside the van der Waals surface. This allows for fast generation and comparison of shape fingerprints to enable large-scale virtual screening and clustering based on molecular shape. Examples are given analyzing shape clusters of ROCK2 inhibitors from PubChem. Future work may explore different shape representations and point distributions.
This is MOH Deputy Director Dr Rozita Halina Tun Hussein's presentation at the Prince Mahidol Award Conference, January 2012.
She is speaking on Malaysia's experience in formulating a health care rationing method.
Healthcare rationing is a well-known fact of Insurance based healthcare systems. But the government insists that Malaysians will get all the healthcare they need for free.
This is a blatant lie!
In July 2012, India had 679.05 million total GSM subscribers, an increase of 1.7 million from the previous month. Airtel added the most subscribers in July at 1.5 million, primarily in the state of Karnataka. Airtel also had the most total GSM subscribers of any operator at 188.81 million. The state of Uttar Pradesh East had the most total subscribers of any state at 58.96 million. The circle of A saw the fastest subscriber growth of any circle at 0.27%.
The document contains graphs and charts showing weather forecasts for Carcavelos, Portugal over a 3 day period from April 4th to July 7th. It includes predictions for wave height, tide height, wind speed and direction, temperature, precipitation, cloud cover and other weather variables that impact surf conditions. The forecasts are provided in 6 hour intervals to allow surfers to plan their sessions.
The document discusses the effects of salt mining on rivers in Catalonia, Spain. 1) Salt mining has contaminated rivers like the Riera de Conangles and Torrent Soldevila with conductivity over 50 mS/cm and reduced biodiversity. 2) Salt water percolates from waste deposits through rocks, increasing conductivity of the Riu d'Or to over 10 mS/cm. 3) Downstream of the mines, the Llobregat river's conductivity is over 2.5 mS/cm and biodiversity is moderately impacted even 15 km away. The salt contamination threatens water supply and ecosystem health.
This document provides a monthly viewership and monitoring overview for February 2011 in Pakistan Urban. It shows that viewership was highest during prime time and post prime time hours. In terms of genres, local entertainment had the highest share of total viewership at 20.9%, followed by foreign entertainment and in-house programming. News aired the most air time at 57552 minutes for the month.
The document provides viewership data for TV channels in Pakistan for March 2011. Some key findings are:
- Viewership was highest during prime time and post-prime time hours.
- For total individuals, local entertainment had the highest average rating, while for connected & satellite households, foreign entertainment and in-house programming were most viewed.
- News channels aired the most commercials at over 553,000 minutes for the month.
PTV Home, ARY Digital, and Geo Entertainment were among the top local entertainment channels by rating, reach, and air time. GEO News topped ratings for local news channels.
The document contains graphs and charts forecasting weather conditions like wave height, tide, wind speed, temperature, and precipitation over a 3 day period for surfing at Carcavelos beach. The charts include predictions for these elements from March 12 to June 12 at 3 hour intervals and provide surfers with information to plan their sessions.
The document contains a graph showing wind speed and direction forecasts for Carcavelos, Portugal between March 12 and May 5. The y-axis ranges from 0 to 12.5 meters per second (m/s) in wind speed. The x-axis shows the forecast times at 3 hour intervals. Lines radiate outward from the center representing wind direction in degrees.
Evaluation Of 2 Motor Hybrid Architecturesjimpotter
The document evaluates 2-motor hybrid architectures, including single planetary gear set systems like the input summing hybrid seen in the Ford Escape and Toyota Prius, and dual planetary gear set systems. It provides details on the operation and features of input summing hybrid systems, and notes that while marketed as a combination of parallel and series hybrids, the engine remains mechanically coupled to the drive axle. The document also briefly discusses output split hybrid systems like in the Chevrolet Volt.
Integrated Cost / Schedule Risk Analysis presented methods for analyzing risks in project schedules and costs using simulation techniques like Monte Carlo. It discussed how considering duration risks of individual activities and combining them using simulations captures schedule risks better than deterministic critical path methods. It also showed that schedules with parallel paths merging have higher risks (merge bias) than single path schedules due to uncertainties accumulating at merge points.
This document contains a timesheet for an employee tracking their work hours over multiple weeks. It includes details of billable hours, non-billable hours, overtime hours, and total hours worked each day for various clients and projects. The timesheet tracks time spent on tasks, projects, and administrative work, along with notes on sick days and holidays. It requires both the employee and supervisor's signature for approval.
This document contains a timesheet for an employee tracking their work hours over multiple weeks. It includes sections for the employee name and contact details, the week dates, client and project details, tasks performed each day, and a breakdown of billable, non-billable, overtime and total hours. At the bottom are spaces for the employee and supervisor signatures to approve the timesheet.
The document appears to be a timesheet template containing fields for an employee to enter their name, contact information, the week's dates, clients, projects, tasks, hours worked each day categorized as billable, non-billable, or overtime, and spaces for employee and supervisor signatures with dates at the bottom. It provides a breakdown of hours spent on different clients, projects, and tasks on an hourly basis over the course of a week or multiple weeks. Dropdown menus are included to select from standard clients, projects, tasks, and billing categories for consistency and ease of data entry.
The document appears to be a timesheet template containing fields for an employee to enter their name, contact information, the week's dates, clients, projects, tasks, hours worked each day categorized as billable, non-billable, or overtime, and spaces for the employee and supervisor's signatures with dates at the bottom. It provides a way for an employee to track their time spent on different clients, projects, and tasks on an hourly basis over the course of a week. The timesheet template includes dropdown menus for clients, projects, tasks, and billing categories to simplify and standardize the data entry process.
The document shows a chart comparing average system load and renewable generation capacity over a winter weekday. Renewable generation from wind and solar photovoltaics is highest during the middle of the day and lowest at night, inversely matching the daily load pattern. Wind provides a more consistent generation level than solar. The chart illustrates the variability of renewable generation compared to customer load.
Similar to Miltenburg M Sc Presentation Tu Delft (20)
Dive into this presentation and learn about the ways in which you can buy an engagement ring. This guide will help you choose the perfect engagement rings for women.
IMPACT Silver is a pure silver zinc producer with over $260 million in revenue since 2008 and a large 100% owned 210km Mexico land package - 2024 catalysts includes new 14% grade zinc Plomosas mine and 20,000m of fully funded exploration drilling.
Profiles of Iconic Fashion Personalities.pdfTTop Threads
The fashion industry is dynamic and ever-changing, continuously sculpted by trailblazing visionaries who challenge norms and redefine beauty. This document delves into the profiles of some of the most iconic fashion personalities whose impact has left a lasting impression on the industry. From timeless designers to modern-day influencers, each individual has uniquely woven their thread into the rich fabric of fashion history, contributing to its ongoing evolution.
❼❷⓿❺❻❷❽❷❼❽ Dpboss Matka Result Satta Matka Guessing Satta Fix jodi Kalyan Final ank Satta Matka Dpbos Final ank Satta Matta Matka 143 Kalyan Matka Guessing Final Matka Final ank Today Matka 420 Satta Batta Satta 143 Kalyan Chart Main Bazar Chart vip Matka Guessing Dpboss 143 Guessing Kalyan night
Best Competitive Marble Pricing in Dubai - ☎ 9928909666Stone Art Hub
Stone Art Hub offers the best competitive Marble Pricing in Dubai, ensuring affordability without compromising quality. With a wide range of exquisite marble options to choose from, you can enhance your spaces with elegance and sophistication. For inquiries or orders, contact us at ☎ 9928909666. Experience luxury at unbeatable prices.
Digital Marketing with a Focus on Sustainabilitysssourabhsharma
Digital Marketing best practices including influencer marketing, content creators, and omnichannel marketing for Sustainable Brands at the Sustainable Cosmetics Summit 2024 in New York
SATTA MATKA SATTA FAST RESULT KALYAN TOP MATKA RESULT KALYAN SATTA MATKA FAST RESULT MILAN RATAN RAJDHANI MAIN BAZAR MATKA FAST TIPS RESULT MATKA CHART JODI CHART PANEL CHART FREE FIX GAME SATTAMATKA ! MATKA MOBI SATTA 143 spboss.in TOP NO1 RESULT FULL RATE MATKA ONLINE GAME PLAY BY APP SPBOSS
Brian Fitzsimmons on the Business Strategy and Content Flywheel of Barstool S...Neil Horowitz
On episode 272 of the Digital and Social Media Sports Podcast, Neil chatted with Brian Fitzsimmons, Director of Licensing and Business Development for Barstool Sports.
What follows is a collection of snippets from the podcast. To hear the full interview and more, check out the podcast on all podcast platforms and at www.dsmsports.net
4 Benefits of Partnering with an OnlyFans Agency for Content Creators.pdfonlyfansmanagedau
In the competitive world of content creation, standing out and maximising revenue on platforms like OnlyFans can be challenging. This is where partnering with an OnlyFans agency can make a significant difference. Here are five key benefits for content creators considering this option:
Part 2 Deep Dive: Navigating the 2024 Slowdownjeffkluth1
Introduction
The global retail industry has weathered numerous storms, with the financial crisis of 2008 serving as a poignant reminder of the sector's resilience and adaptability. However, as we navigate the complex landscape of 2024, retailers face a unique set of challenges that demand innovative strategies and a fundamental shift in mindset. This white paper contrasts the impact of the 2008 recession on the retail sector with the current headwinds retailers are grappling with, while offering a comprehensive roadmap for success in this new paradigm.
The Genesis of BriansClub.cm Famous Dark WEb PlatformSabaaSudozai
BriansClub.cm, a famous platform on the dark web, has become one of the most infamous carding marketplaces, specializing in the sale of stolen credit card data.
Garments ERP Software in Bangladesh _ Pridesys IT Ltd.pdfPridesys IT Ltd.
Pridesys Garments ERP is one of the leading ERP solution provider, especially for Garments industries which is integrated with
different modules that cover all the aspects of your Garments Business. This solution supports multi-currency and multi-location
based operations. It aims at keeping track of all the activities including receiving an order from buyer, costing of order, resource
planning, procurement of raw materials, production management, inventory management, import-export process, order
reconciliation process etc. It’s also integrated with other modules of Pridesys ERP including finance, accounts, HR, supply-chain etc.
With this automated solution you can easily track your business activities and entire operations of your garments manufacturing
proces
The APCO Geopolitical Radar - Q3 2024 The Global Operating Environment for Bu...APCO
The Radar reflects input from APCO’s teams located around the world. It distils a host of interconnected events and trends into insights to inform operational and strategic decisions. Issues covered in this edition include:
Anny Serafina Love - Letter of Recommendation by Kellen Harkins, MS.AnnySerafinaLove
This letter, written by Kellen Harkins, Course Director at Full Sail University, commends Anny Love's exemplary performance in the Video Sharing Platforms class. It highlights her dedication, willingness to challenge herself, and exceptional skills in production, editing, and marketing across various video platforms like YouTube, TikTok, and Instagram.
Anny Serafina Love - Letter of Recommendation by Kellen Harkins, MS.
Miltenburg M Sc Presentation Tu Delft
1. Determination of canal characteristics
with experimental modeling
Graduation presentation 0.7
0.6
Ivo Miltenburg 0.5
Amplitude
0.4
09-04-2008 0.3
0.2
0.1
0
-20 0 20 40 60 80 100 120 140
Time (10 second interval)
Input Flow (m3/s)
0.3 0.7
0.6
0.2
0.5
Magnitude (abs)
0.1
0.4
06:00 06:30 07:00 07:30 Rp
Time 0.3
0.04 0.2
deviation (m)
Waterlevel
0.02
0.1 ωp
0
0
-3 -2 -1
-0.02 10 10 10
Frequency (rad/s)
06:00 06:30 07:00 07:30
Time 1600
Estimated storage area (m )
1400
2
1200
Prof. dr. ir. Nick van de Giesen 1000
Prof. dr. ir. Xavier Bombois 800
Dr. ir. Peter-Jules van Overloop 600
Dr. Bert Clemmens 400
10
-4
10
-3
10
-2
Frequency (rad/s)
Ir. Robert Strand
2. Introduction
● Operational Water Management
● Irrigation canal systems
● Optimization crop growth
R3 and water scarcity
R4 – Flexibility
R5 – Efficiency
Introduction – Objective – System Identification – Model and field experiments – Conclusions/recommendations
Determination of canal characteristics 2
with experimental modeling
3. Introduction
Automation of irrigation systems
● Different types of control possible set point
desired
Slave controller flow rate Master controller
Flow control Level control
controlled
u water level
y
● Proportional Integral (PI) control
most widely used
Introduction – Objective – System Identification – Model and field experiments – Conclusions/recommendations
Determination of canal characteristics 3
with experimental modeling
4. Introduction
Tuning based on canal characteristics
• Long, shallow, steep canal pools
- Delay time
- Storage area
1
10
A
Magnitude (abs)
0
10
Integrator
ID model
Delay time (reservoir) -1
10
(transport) -4 -3 -2
10 10 10
• Pool characteristics can be determined relatively simple
Introduction – Objective – System Identification – Model and field experiments – Conclusions/recommendations
Determination of canal characteristics 4
with experimental modeling
5. Introduction
Tuning based on canal characteristics
• Short, deep, flat canal pools
- Delay time
- Storage area
- Resonance behavior
• What is resonance??
Introduction – Objective – System Identification – Model and field experiments – Conclusions/recommendations
Determination of canal characteristics 5
with experimental modeling
6. Intermezzo - Resonance
• System sensitive to input of certain frequency
• In a canal: standing wave
• Wave action distorts perception of water level
First harmonic Second harmonic
Introduction – Objective – System Identification – Model and field experiments – Conclusions/recommendations
Determination of canal characteristics 6
with experimental modeling
7. Introduction
Tuning based on canal characteristics
• Resonance waves can lead to loose control or even instability:
Water level (m)
1.22
1.2
1.18
00:00 02:00 04:00 06:00 08:00 10:00
Time
Resonance behavior in real canal - Delay time
- Storage area
- Resonance frequency
ID model - Resonance peak
low frequency
Introduction – Objective – System Identification – Model and field experiments – Conclusions/recommendations
Determination of canal characteristics 7
with experimental modeling
8. Introduction
Tuning based on canal characteristics
Apply PIF-control
1
10
●
0
10
Magnitude (abs)
– Filter water levels:
-1
10
Original model
Filter
-2
10 Filtered model
-4 -3 -2 -1
10 10 10 10
– PIF tuning rules for distant downstream control
• How to determine resonance characteristics?
Introduction – Objective – System Identification – Model and field experiments – Conclusions/recommendations
Determination of canal characteristics 8
with experimental modeling
9. Introduction 0.17
F w(m /s)
∆Q
3
0.16
∆Q
0.15
lo
Visualization Resonance 0.14
02:00 03:00 04:00
Time
05:00 06:00
Chirp input signal 1.25
W te e th (m)
● 1.2
∆h
∆h
a rd p
1.15
1.1
02:00 03:00 04:00 05:00 06:00
● Time
Low flow High flow
1.42
0.17
Flow (m3/s)
Flow (m3/s)
1.41
0.16
1.4
0.15
1.39
0.14
00:00 03:00 06:00 00:00 03:00 06:00
Time Time
1.25
Waterdepth (m)
1.2
1.15
1.1
1.05
00:00 01:00 02:00 03:00 04:00 05:00 06:00
Time
Introduction – Objective – System Identification – Model and field experiments – Conclusions/recommendations
Determination of canal characteristics 9
with experimental modeling
10. Introduction
Visualization Resonance
SOBEK chirp test Real chirp test
● Simple determination not possible
Introduction – Objective – System Identification – Model and field experiments – Conclusions/recommendations
Determination of canal characteristics 10
with experimental modeling
11. Introduction
Tuning PIF-controller based on canal characteristics
● Calculation
● Use hydrodynamic model:
– Model construction
– Tedious and
time consuming
– Possibly inaccurate
● Model errors
● Changing system
● Existing methods can not be used on a real canal pool
Introduction – Objective – System Identification – Model and field experiments – Conclusions/recommendations
Determination of canal characteristics 11
with experimental modeling
12. Objective
Research question:
● What is the potential of System Identification for controller
design for various irrigation canal pools?
● How can the resonance characteristics in
(potentially oscillating) irrigation pools
be identified
Research objective:
• Finding a procedure to identify all
relevant canal pool characteristics for
controller design using experimental
modeling
Introduction – Objective – System Identification – Model and field experiments – Conclusions/recommendations
Determination of canal characteristics 12
with experimental modeling
13. System Identification
● Apply known disturbances and
measure output
● Capture the relevant dynamics
● Determine canal characteristics
General System Identification procedure ● Controller and filter design
Introduction – Objective – System Identification – Model and field experiments – Conclusions/recommendations
Determination of canal characteristics 13
with experimental modeling
14. System Identification
Model set
● Model type
– System transfer function
– Error transfer function
Box-Jenkins (BJ) model structure most flexible
● Model order
– Reservoir behavior Step Response
– Resonance behavior 1
– Initial water level jump Amplitude
0.5
– Discrete data
0
5th order model structure 0 100 200 300 400
tim (sec)
e
500 600 700 800
Introduction – Objective – System Identification – Model and field experiments – Conclusions/recommendations
Determination of canal characteristics 14
with experimental modeling
15. System Identification
Experiment design
● Open loop experiment ● Flow control gate discharge
Input signal
● RBS signal
0.4
Frequency range
Input Flow (m3/s)
● 0.3
Step size
Base flow
● Test base flow 0.2
0.1
● Test step size 00:00 01:00 02:00 03:00
Time
● Control time step
● Sample time step
Introduction – Objective – System Identification – Model and field experiments – Conclusions/recommendations
Determination of canal characteristics 15
with experimental modeling
16. System Identification
Input design
● ●
●
●
●
● ●
●
Introduction – Objective – System Identification – Model and field experiments – Conclusions/recommendations
Determination of canal characteristics 16
with experimental modeling
17. System Identification
Determination canal characteristics
● Delay time ● Storage area
0.7 – Filter data
0.6
0.5
m
A
u
p
d
e
t
l
i
0
.
6
5
0
.
4
3
0.05
Amplitude
0.4
deviation (m)
Waterlevel
0.3
0
0.2
0.1
-0.05
0
-20 0 20 40 60 80 100 120 140
Time (10 second interval)
00:00 00:30 01:00 01:30 02:00 02:30 03:00 03:30 04:00
● Resonance characteristics
0.7
0.6
1600
0.5
Estimated storage area (m2)
1400
Magnitude (abs)
0.4
1200
Rp
0.3
1000
0.2 800
0.1 600
ωp
0 400
-3 -2 -1
10 10 10 -4 -3 -2
10 10 10
Frequency (rad/s) Frequency (rad/s)
Introduction – Objective – System Identification – Model and field experiments – Conclusions/recommendations
Determination of canal characteristics 17
with experimental modeling
18. Model and field experiments
Test location
● Arizona, USA
● Pinal County
● CAIDD
NB 11
NB lateral
NB 11A
NB 12
NB 13
NB 14
NB 16
NB 17
Introduction – Objective – System Identification – Model and field experiments – Conclusions/recommendations
Determination of canal characteristics 18
with experimental modeling
19. Model and field experiments
Real chirp test SOBEK chirp test Real Resonance peak
10
0 R e a l C h irp T e s t 1
0.04 0.04 R e a l C h irp T e s t 2
R e a l C h irp T e s t 3
Waterlevel deviation (m)
Amplitude
0.02 0.02
0 0
-1
10
-0.02 -0.02
-4 -3 -2 -1
10 10 10 10
-0.04 -0.04 F re q u e n c y (ra d / )
00:00 02:00 04:00 06:00 00:00 02:00 04:00 06:00
Time Time
SOBEK Resonance peak
0
Waterlevel deviation (m)
10
0.02 0.02
0 0
Amplitude
-1
10
-0.02 -0.02
M o d e l C h irp T e s t 1
00:00 02:00 04:00 06:00 00:00 02:00 04:00 06:00 M o d e l C h irp T e s t 2
Time Time M o d e l C h irp T e s t 3
-2
10
-4 -3 -2 -1
10 10 10 10
F re q u e n c y (ra d / )
Waterlevel deviation (m)
0.02 0.02
0 0
● Consistent results
-0.02 -0.02
● Difference SOBEK/real
00:00 01:00 02:00 03:00 00:00 01:00 02:00 03:00
Time Time
Introduction – Objective – System Identification – Model and field experiments – Conclusions/recommendations
Determination of canal characteristics 19
with experimental modeling
20. Model and field experiments
Upstream RBS-tests
Input Flow (m3/s)
0 .4
0 .2
0
06 :00 06 :30 07 :00 07 :30
Resonant sensitive pools 0.0 5
Tim e
deviation (m)
Waterlevel
0
-0 . 0 5
06 :00 06 :30 07 :00 07 :30
Tim e
Input Flow (m3/s)
0 .4
0 .3
0 .2
0 .1
Delay time dominant pools 0 1 :3 0 0 2 :0 0
T im e
0 2 :3 0 0 3 :0 0
0 .0 6
deviation (m)
Waterlevel
0 .0 4
0 .0 2
0
-0 . 0 2
0 1 :3 0 0 2 :0 0 0 2 :3 0 0 3 :0 0
T im e
Introduction – Objective – System Identification – Model and field experiments – Conclusions/recommendations
Determination of canal characteristics 20
with experimental modeling
21. Model and field experiments
Upstream RBS-tests
Real US RBS-tests SOBEK US RBS-tests
Characteristics NB-12 NB-11A Characteristics NB-12 NB-11A
Delay time τ 330 770 [s] Delay time τ 320 720 [s]
not
Storage Area As 2750
possible [m ]
2 Storage Area As 2950 2100 [m ]
2
Resonance period TP 750 - [s] Resonance period TP 680 - [s]
Resonance frequency ωP 0.008418 - [ rad /s] Resonance frequency ωP 0.009257 - [ rad /s]
−2
Resonance peak RP 0.29 0 [s⋅m ]
−2 Resonance peak RP 0.34 0 [s⋅m ]
● Procedure works
● Difference SOBEK/real,
but consistent
● Experiments can fail
Introduction – Objective – System Identification – Model and field experiments – Conclusions/recommendations
Determination of canal characteristics 21
with experimental modeling
22. Conclusions
● Resonance plays an important role
● 5th order BJ-model captures all relevant dynamics
● Pool characteristics can be estimated
● Resonance peak and storage area sensitive to flow conditions
● Resonance frequency stable
● Different pool behavior for US and DS disturbance (culvert)
● Differences between SOBEK/real experiments stipulate the
importance of experimental modeling
Introduction – Objective – System Identification – Model and field experiments – Conclusions/recommendations
Determination of canal characteristics 22
with experimental modeling
23. Recommendations
● Research closed loop experiments
● Investigate difference between US-DS canal pool reaction
● Apply PIF-control on a real canal
● Investigate ‘plug-and-play’-control based on proposed
procedure
Introduction – Objective – System Identification – Model and field experiments – Conclusions/recommendations
Determination of canal characteristics 23
with experimental modeling
24. “Only a fool measures the depth of the water with both feet”
- African proverb -
Determination of canal characteristics 24
with experimental modeling
25. Thanks for your attention
Drinks:
Delftsche Studenten Bond (DSB)
Oude Delft 123
Determination of canal characteristics 25
with experimental modeling