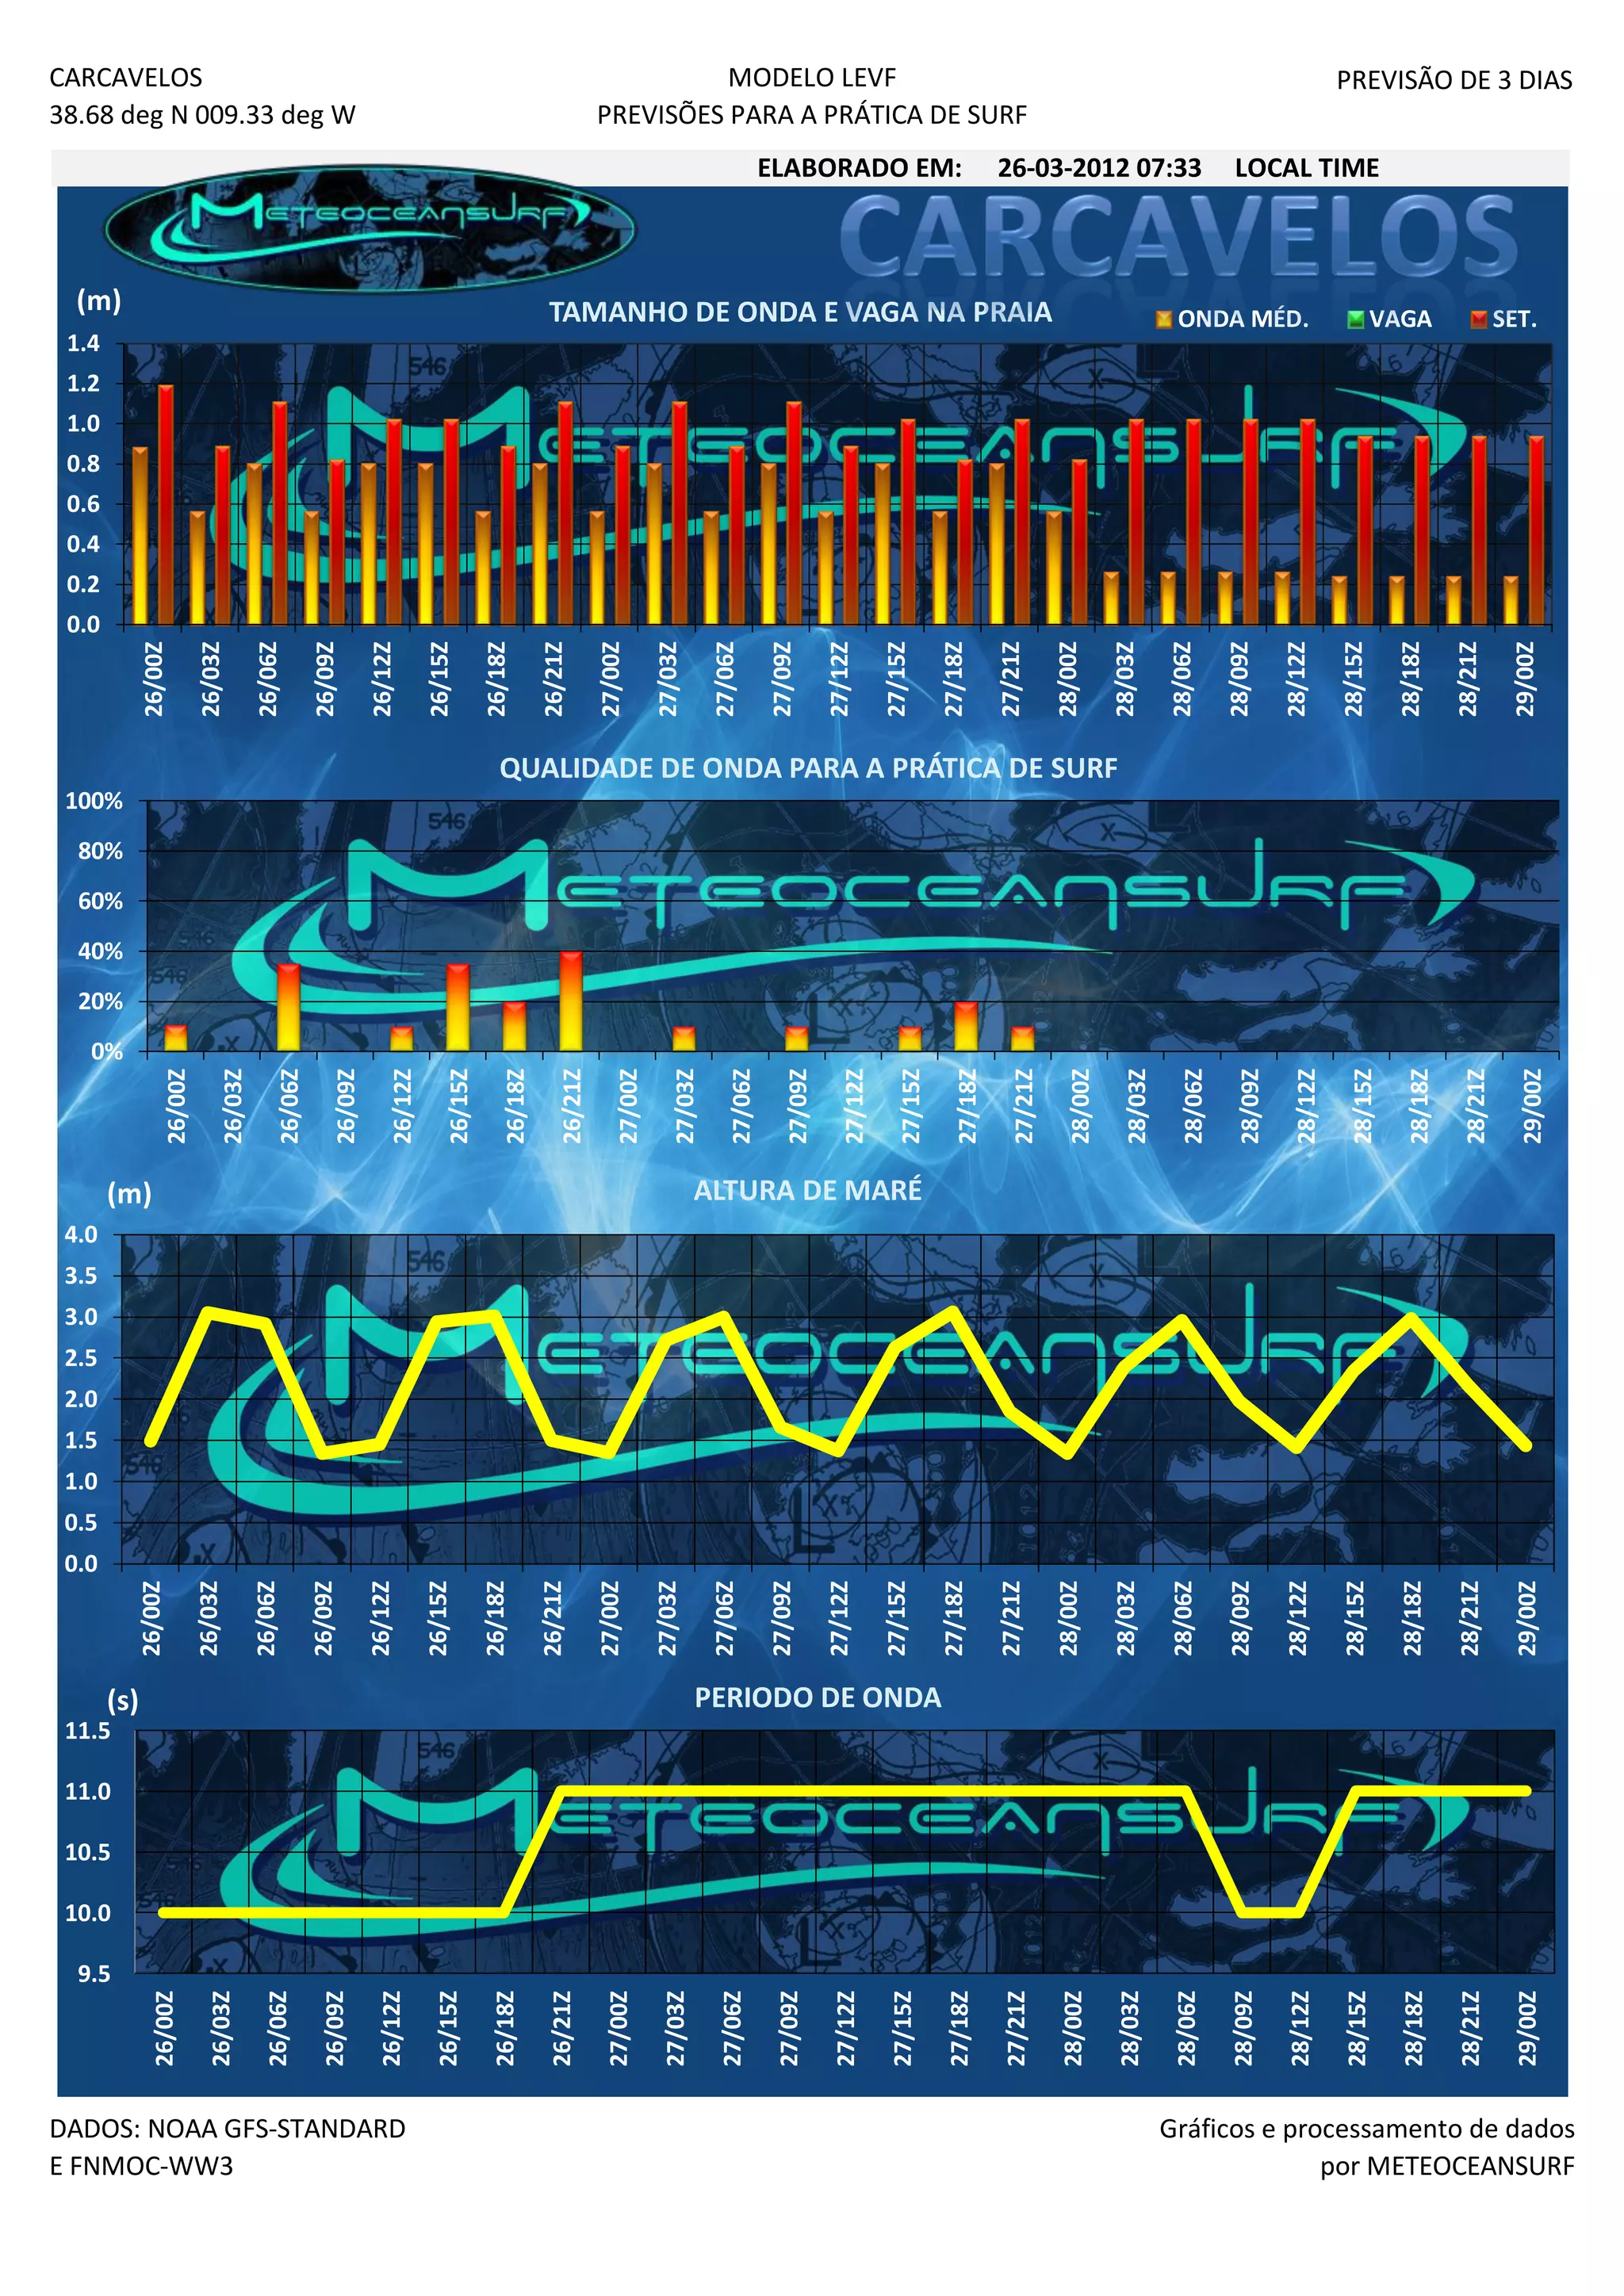
This document appears to be a graph showing wave height data from the NOAA GFS model at a location near Carcavelos, Portugal between January 26th and January 27th. The graph has lines showing significant wave height every 3 hours, with heights ranging from around 0 to 11 meters. It indicates wave conditions gradually increasing over the period shown, with the highest waves nearing 11 meters at some points.


![Apos11 defining dt cut-offs using function [p p1-52 fri]](https://cdn.slidesharecdn.com/ss_thumbnails/apos11-definingdtcut-offsusingfunctionpp1-52fri-110207180353-phpapp01-thumbnail.jpg?width=640&height=640&fit=bounds)


