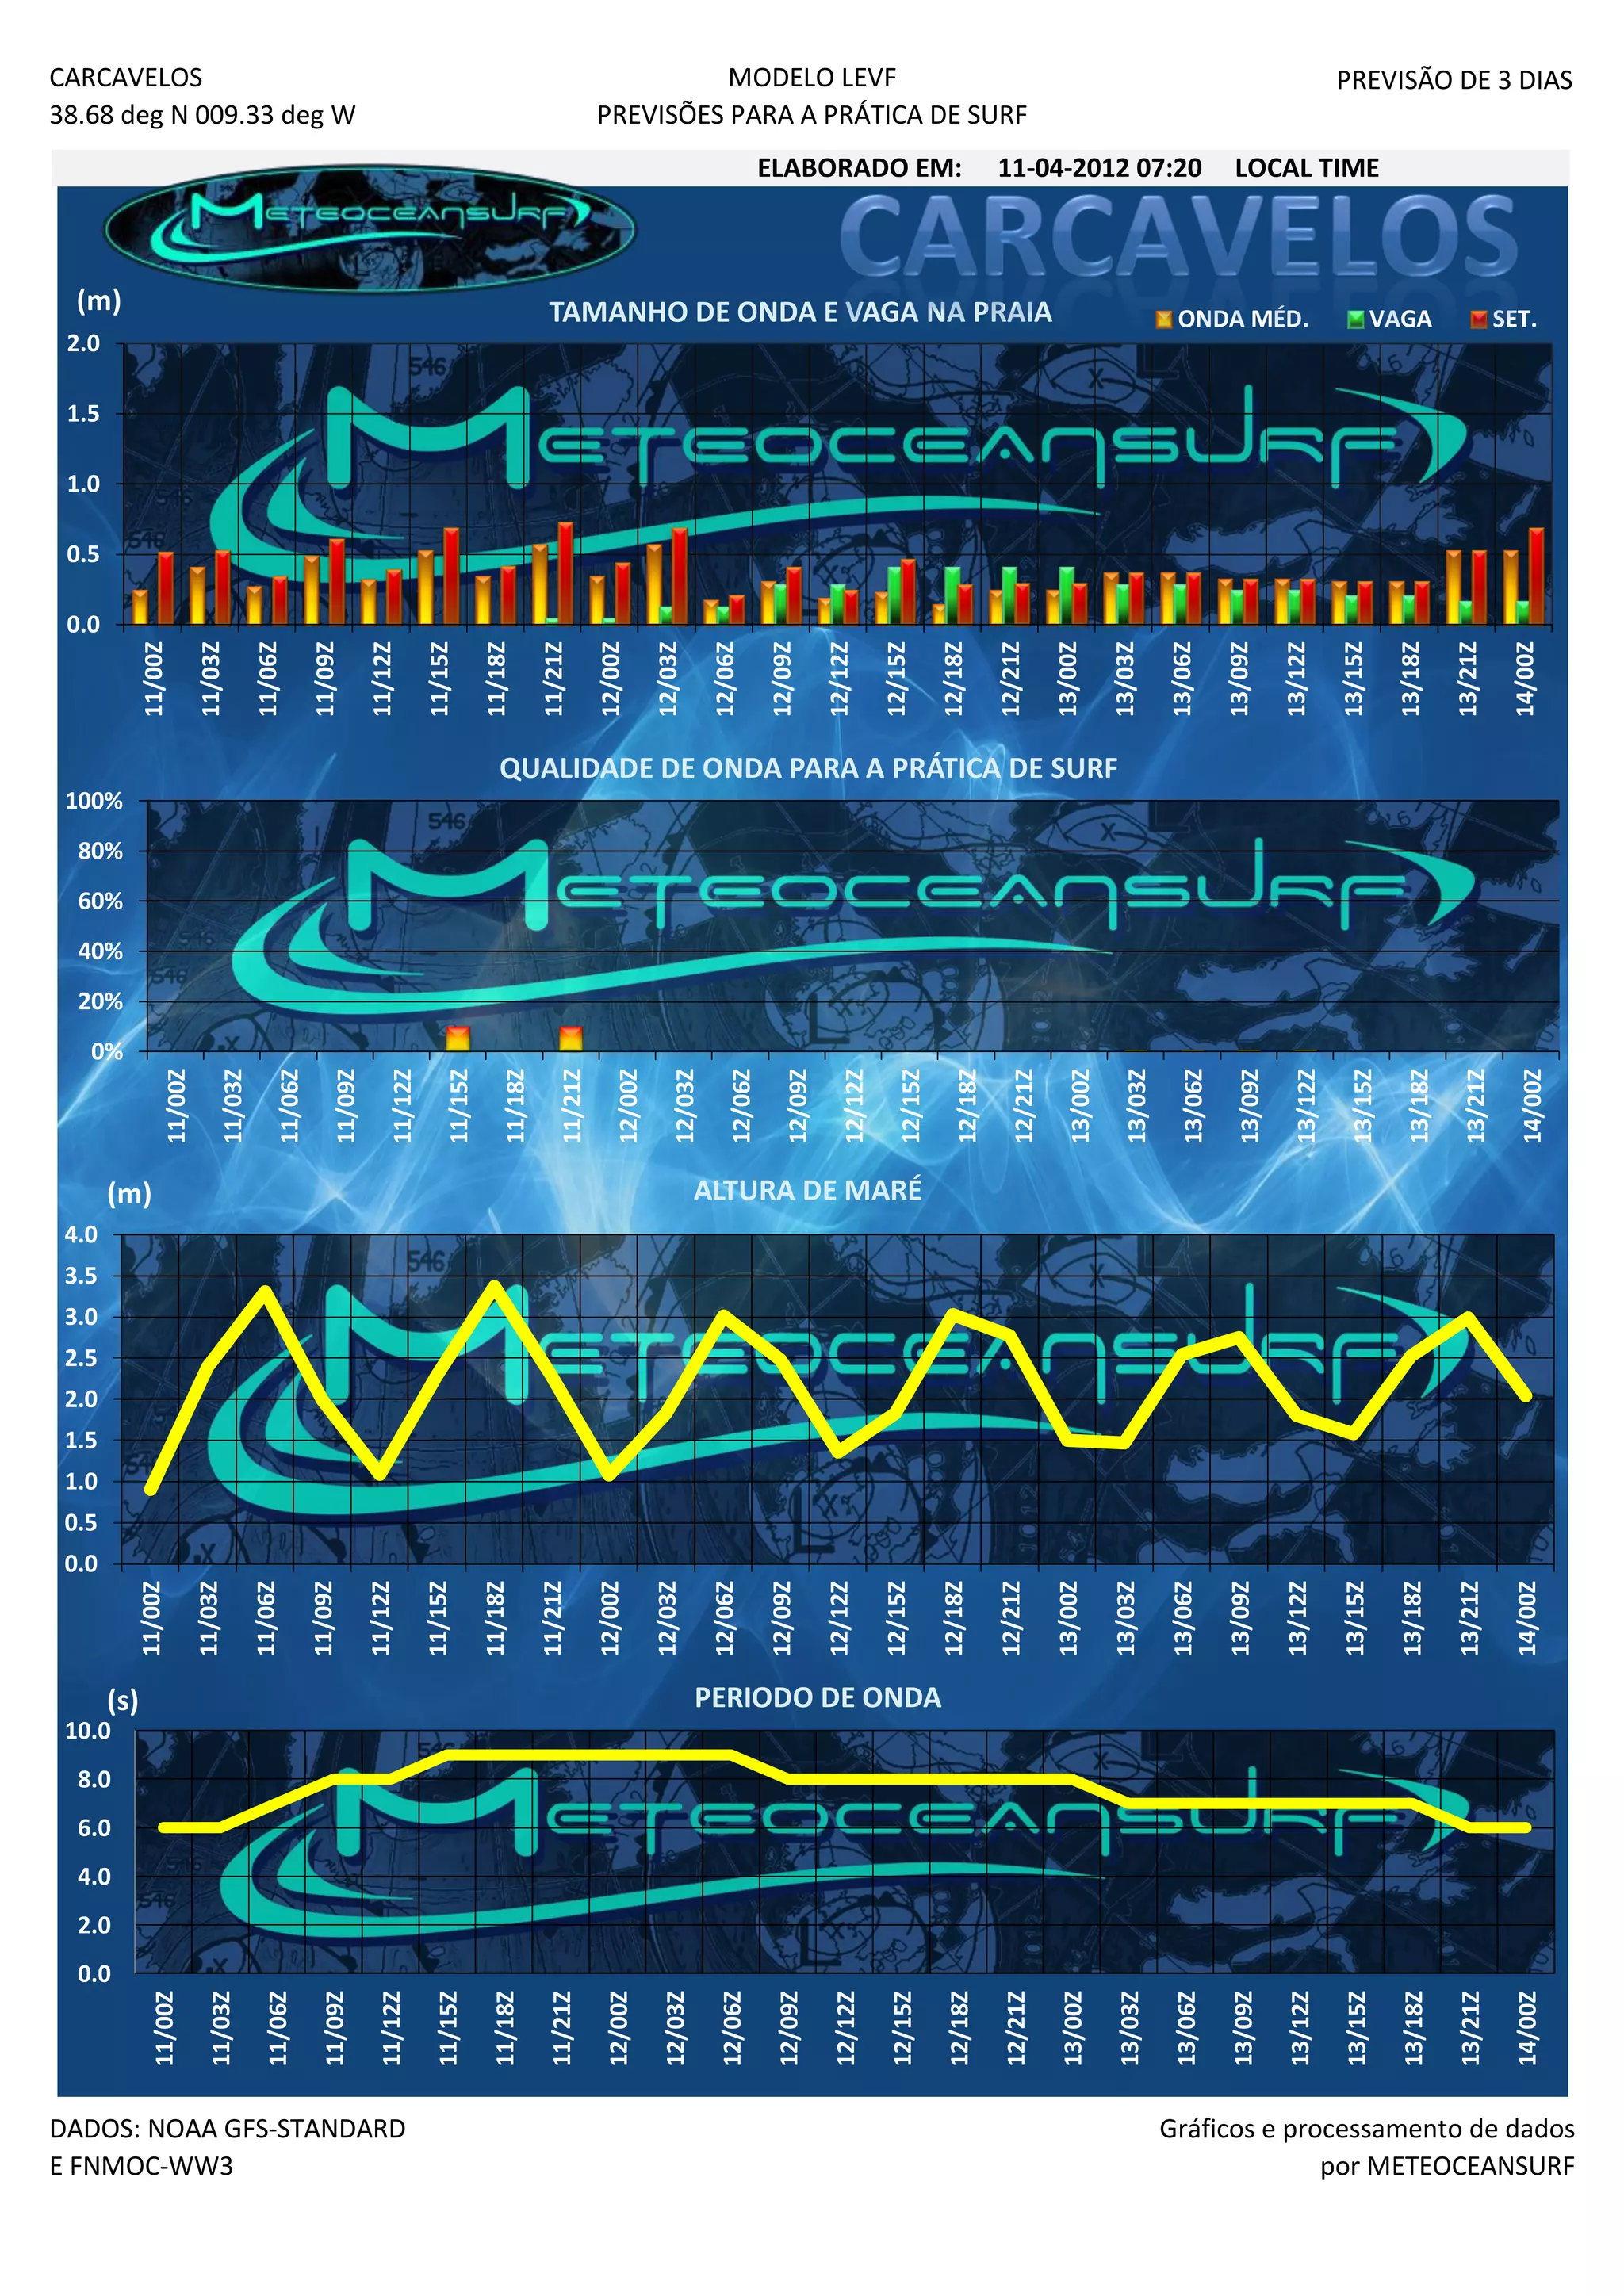
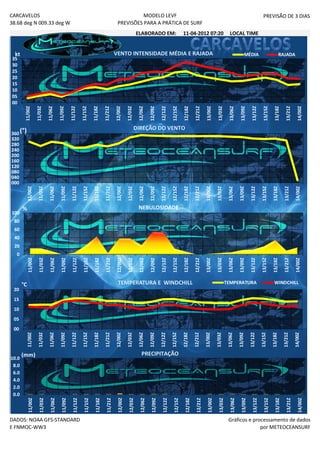
This document contains graphs showing wave height predictions for Carcavelos, Portugal over a 3 day period from November 11th to December 3rd. The graphs show wave height predictions every 3 hours on the y-axis ranging from 0 to 10 meters with time on the x-axis. Lines on the graphs indicate the predicted 20%, 40%, 60%, and 80% exceedance probabilities for wave heights during the period.