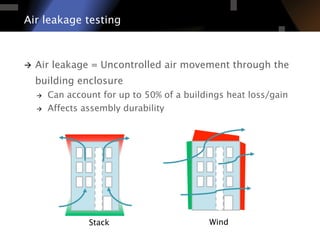
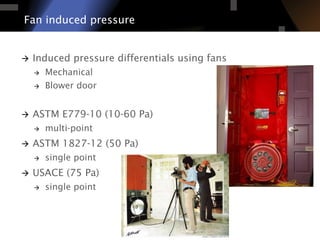
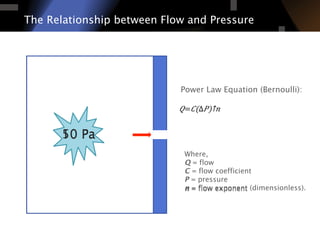
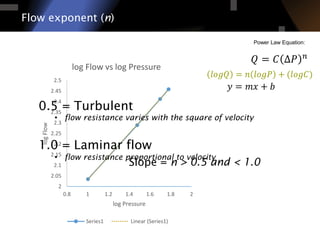
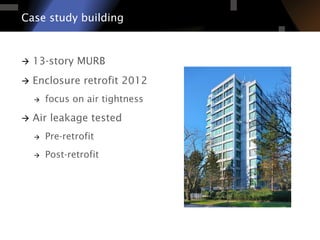
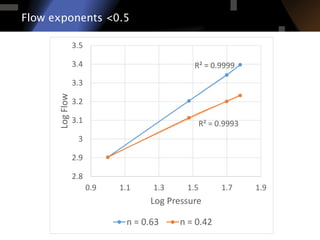
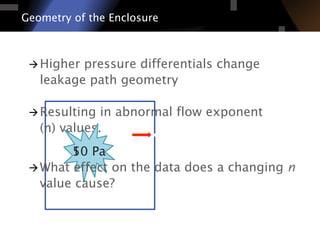
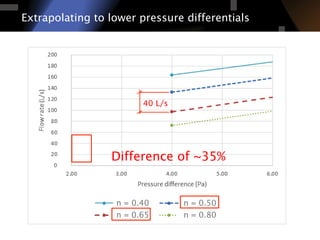
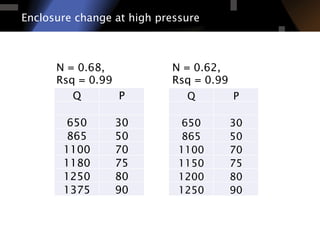
Flow Exponent Values and
Implications for Air Leakage
Testing
NBEC 2014
ROBIN URQUHART, MBSC, MA NRES, RDH BUILDING ENGINEERING
DR. RUSSELL RICHMAN, P.ENG, RYERSON UNIVERSITY
Outline
à  Introduction to air leakage testing
à  Relationship between flow and pressure
à  Case study building
à  Abnormal flow exponents
à  Data extrapolation to operating pressures
à  Conclusions/Implications
à  Further study
Air leakage testing
à  Air leakage = Uncontrolled air movement through the
building enclosure
à  Can account for up to 50% of a buildings heat loss/gain
à  Affects assembly durability
Stack Wind
Fan induced pressure
à  Induced pressure differentials using fans
à  Mechanical
à  Blower door
à  ASTM E779-10 (10-60 Pa)
à  multi-point
à  ASTM 1827-12 (50 Pa)
à  single point
à  USACE (75 Pa)
à  single point
Why test?
à  Evaluate performance and determine retrofit options
à  Single building
à  Building stock
à  Determine leakage rates for energy models
à  4 Pa – 10 Pa
à  Code or other
specification compliance
à  LEED, Energuide, etc.
The Relationship between Flow and Pressure
Pressure (P) and Flow (Q)
10 Pa50 Pa
Power Law Equation (Bernoulli):
𝑄= 𝐶​(∆ 𝑃)↑𝑛 
Where,
Q = flow
C = flow coefficient
P = pressure
n = flow exponent (dimensionless).n = flow exponent
Flow exponent (n)
Power Law Equation:
2
2.05
2.1
2.15
2.2
2.25
2.3
2.35
2.4
2.45
2.5
0.8 1 1.2 1.4 1.6 1.8 2
log	
  Flow
log	
  Pressure
log	
  Flow	
  vs	
  log	
  Pressure
Series1 Linear	
  (Series1)
> 0.5 and < 1.0Slope = n
0.5 = Turbulent
•  flow resistance varies with the square of velocity
1.0 = Laminar flow
•  flow resistance proportional to velocity
𝑦 = 𝑚𝑥 + 𝑏	
  
à  13-story MURB
à  Enclosure retrofit 2012
à  focus on air tightness
à  Air leakage tested
à  Pre-retrofit
à  Post-retrofit
Case study building
Guarded-zone method
Flow exponent values – Case study buildingSuite 101 Suite 102 Suite 301 Suite 302 Suite 303
Pre-press 0.59 0.56 0.60 0.68 0.54
Post-press 0.56 0.67 0.75 0.85 0.85
Change2
-0.03 +0.11 +0.15 +0.17 +0.31
Pre-depress 0.92 0.80 0.50 0.62 0.61
Post-depress 0.79 0.69 0.60 0.57 0.37
Change -0.13 -0.11 +0.10 -0.05 -0.24
Suite 1101 Suite 1102 Suite 1103 Suite 1301 Suite 1302
Pre-press 0.52 0.49 0.53 0.74 0.52
Post-press 0.71 0.56 0.64 0.77 0.72
Change +0.19 +0.07 +0.11 +0.03 +0.20
Pre-depress 0.47 0.46 0.78 0.57 0.63
Post-depress 0.61 0.43 0.59 0.57 0.47
Change +0.14 -0.03 -0.19 0.00 -0.16
1 pre-press = pre-retrofit pressurization, post-press = post-retrofit depressurization, pre-depress = pre-retrofit depressurization,
post-depress = post-retrofit depressurization
2
positive change indicates a move towards laminar flow (smaller cracks), negative change indicates a move towards turbulent
flow (larger cracks)
“…blower door tests occasionally yield exponents less than the
Bernoulli limit of 0.5. In fact, it is physically impossible for such
low exponents to occur.”
Sherman, Wilson and Kiel. 1986
Flow exponents outside of theoretical range
So why do we get them?
Flow Exponents <0.5
Series 1: n=0.5-1.0 Series 2: n<0.5
Q P logQ logP n r-sq Q P logQ logP n r-sq
800 10 2.9	
   1	
   0.63 0.999 800 10 2.9	
   1	
   0.42 0.999
1600 30 3.2	
   1.48	


1300 30 3.11	
   1.48	


2200 50 3.34	
   1.7	
   1590 50 3.2	
   1.7	
  
2500 60 3.4	
   1.78	
   1710 60 3.23	
   1.78	
  
Flow exponents <0.5
R²	
  =	
  0.9999
R²	
  =	
  0.9993
2.8
2.9
3
3.1
3.2
3.3
3.4
3.5
0.9 1.1 1.3 1.5 1.7 1.9
Log	
  Flow
Log	
  Pressure
n	
  =	
  0.63 n	
  =	
  0.42
Geometry of the Enclosure
à Higher pressure differentials change
leakage path geometry
à Resulting in abnormal flow exponent
(n) values.
50 Pa10 Pa
à What effect on the data does a changing n
value cause?
Extrapolating to lower pressure differentials
40 L/s
Difference of ~35%
n = 0.40
n = 0.65
n = 0.50
n = 0.80
Q	
   P	
  
650	
   30	
  
865	
   50	
  
1100	
   70	
  
1180	
   75	
  
1250	
   80	
  
1375	
   90	
  
Enclosure change at high pressure
Q	
   P	
  
650	
   30	
  
865	
   50	
  
1100	
   70	
  
1150	
   75	
  
1200	
   80	
  
1250	
   90	
  
N = 0.68,
Rsq = 0.99
N = 0.62,
Rsq = 0.99
600
700
800
900
1000
1100
1200
1300
1400
1500
20 40 60 80 100
Flow
Pressure
static	
  enclosure enclosure	
  changes
Enclosure change at higher pressures
1000
1050
1100
1150
1200
1250
1300
1350
1400
65 70 75 80 85 90 95
Flow
Pressure
static	
  enclosure enclosure	
  changes
600
700
800
900
1000
1100
1200
1300
1400
1500
20 40 60 80 100
Flow
Pressure
static	
  enclosure enclosure	
  changes
Adjusted values using n
0
200
400
600
800
1000
1200
1400
0 20 40 60 80
Flow
Pressure
static	
  enclosure changing	
  enclosure
0
50
100
150
200
250
2 3 4 5 6
Flow
Pressure
static	
  enclosure changing	
  enclosure
25 l/s
14% difference
à  The enclosure may not remain static throughout the
test
à  The linear relationship may not be accurate at operating
pressure
à  Substituting n values can have magnified impacts at
lower/higher pressure differentials
à  R-squared values not perfect indicators
Conclusions
à  Sizing mechanical systems
for predicted in operation
flow rates
à  Retrofit options
Implications for the industry
à  Energy models using extrapolated flow rates
may be inaccurate
à  Multi-point testing still important
à  Order of magnitude for comparison purposes
à  Flow exponents tell us something, we might not know
exactly what it is
à  Standards at higher pressures can be used for
compliance purposes
The Good
In-test corrections
à  Check R-squared values during testing
à  Check n values at the termination of each test
Post-test corrections
à  Review data points and remove lowest pressure
differential point(s)
à  If not reconciled, single point test at 50 Pa
Flow exponent corrections
à  Sensitivity analysis: R-value threshold
à  The use of flow exponent values in forensics
à  Standardized leakage metric and pressure differential
for comparison purposes
à  Effect on flow exponent of enclosure geometry
changes
Further study
Questions
ROBIN URQUHART
RURQUHART@RDH.COM

NBEC 2014 - Flow Exponent Values and Implications for Air Leakage Testing

  • 1.
    Flow Exponent Valuesand Implications for Air Leakage Testing NBEC 2014 ROBIN URQUHART, MBSC, MA NRES, RDH BUILDING ENGINEERING DR. RUSSELL RICHMAN, P.ENG, RYERSON UNIVERSITY
  • 2.
    Outline à  Introduction toair leakage testing à  Relationship between flow and pressure à  Case study building à  Abnormal flow exponents à  Data extrapolation to operating pressures à  Conclusions/Implications à  Further study
  • 3.
    Air leakage testing à Air leakage = Uncontrolled air movement through the building enclosure à  Can account for up to 50% of a buildings heat loss/gain à  Affects assembly durability Stack Wind
  • 4.
    Fan induced pressure à Induced pressure differentials using fans à  Mechanical à  Blower door à  ASTM E779-10 (10-60 Pa) à  multi-point à  ASTM 1827-12 (50 Pa) à  single point à  USACE (75 Pa) à  single point
  • 5.
    Why test? à  Evaluateperformance and determine retrofit options à  Single building à  Building stock à  Determine leakage rates for energy models à  4 Pa – 10 Pa à  Code or other specification compliance à  LEED, Energuide, etc.
  • 6.
    The Relationship betweenFlow and Pressure Pressure (P) and Flow (Q) 10 Pa50 Pa Power Law Equation (Bernoulli): 𝑄= 𝐶​(∆ 𝑃)↑𝑛  Where, Q = flow C = flow coefficient P = pressure n = flow exponent (dimensionless).n = flow exponent
  • 7.
    Flow exponent (n) PowerLaw Equation: 2 2.05 2.1 2.15 2.2 2.25 2.3 2.35 2.4 2.45 2.5 0.8 1 1.2 1.4 1.6 1.8 2 log  Flow log  Pressure log  Flow  vs  log  Pressure Series1 Linear  (Series1) > 0.5 and < 1.0Slope = n 0.5 = Turbulent •  flow resistance varies with the square of velocity 1.0 = Laminar flow •  flow resistance proportional to velocity 𝑦 = 𝑚𝑥 + 𝑏  
  • 8.
    à  13-story MURB à Enclosure retrofit 2012 à  focus on air tightness à  Air leakage tested à  Pre-retrofit à  Post-retrofit Case study building
  • 9.
  • 10.
    Flow exponent values– Case study buildingSuite 101 Suite 102 Suite 301 Suite 302 Suite 303 Pre-press 0.59 0.56 0.60 0.68 0.54 Post-press 0.56 0.67 0.75 0.85 0.85 Change2 -0.03 +0.11 +0.15 +0.17 +0.31 Pre-depress 0.92 0.80 0.50 0.62 0.61 Post-depress 0.79 0.69 0.60 0.57 0.37 Change -0.13 -0.11 +0.10 -0.05 -0.24 Suite 1101 Suite 1102 Suite 1103 Suite 1301 Suite 1302 Pre-press 0.52 0.49 0.53 0.74 0.52 Post-press 0.71 0.56 0.64 0.77 0.72 Change +0.19 +0.07 +0.11 +0.03 +0.20 Pre-depress 0.47 0.46 0.78 0.57 0.63 Post-depress 0.61 0.43 0.59 0.57 0.47 Change +0.14 -0.03 -0.19 0.00 -0.16 1 pre-press = pre-retrofit pressurization, post-press = post-retrofit depressurization, pre-depress = pre-retrofit depressurization, post-depress = post-retrofit depressurization 2 positive change indicates a move towards laminar flow (smaller cracks), negative change indicates a move towards turbulent flow (larger cracks)
  • 11.
    “…blower door testsoccasionally yield exponents less than the Bernoulli limit of 0.5. In fact, it is physically impossible for such low exponents to occur.” Sherman, Wilson and Kiel. 1986 Flow exponents outside of theoretical range So why do we get them?
  • 12.
    Flow Exponents <0.5 Series1: n=0.5-1.0 Series 2: n<0.5 Q P logQ logP n r-sq Q P logQ logP n r-sq 800 10 2.9   1   0.63 0.999 800 10 2.9   1   0.42 0.999 1600 30 3.2   1.48           1300 30 3.11   1.48           2200 50 3.34   1.7   1590 50 3.2   1.7   2500 60 3.4   1.78   1710 60 3.23   1.78  
  • 13.
    Flow exponents <0.5 R²  =  0.9999 R²  =  0.9993 2.8 2.9 3 3.1 3.2 3.3 3.4 3.5 0.9 1.1 1.3 1.5 1.7 1.9 Log  Flow Log  Pressure n  =  0.63 n  =  0.42
  • 14.
    Geometry of theEnclosure à Higher pressure differentials change leakage path geometry à Resulting in abnormal flow exponent (n) values. 50 Pa10 Pa à What effect on the data does a changing n value cause?
  • 15.
    Extrapolating to lowerpressure differentials 40 L/s Difference of ~35% n = 0.40 n = 0.65 n = 0.50 n = 0.80
  • 16.
    Q   P   650   30   865   50   1100   70   1180   75   1250   80   1375   90   Enclosure change at high pressure Q   P   650   30   865   50   1100   70   1150   75   1200   80   1250   90   N = 0.68, Rsq = 0.99 N = 0.62, Rsq = 0.99
  • 17.
    600 700 800 900 1000 1100 1200 1300 1400 1500 20 40 6080 100 Flow Pressure static  enclosure enclosure  changes Enclosure change at higher pressures 1000 1050 1100 1150 1200 1250 1300 1350 1400 65 70 75 80 85 90 95 Flow Pressure static  enclosure enclosure  changes
  • 18.
    600 700 800 900 1000 1100 1200 1300 1400 1500 20 40 6080 100 Flow Pressure static  enclosure enclosure  changes Adjusted values using n 0 200 400 600 800 1000 1200 1400 0 20 40 60 80 Flow Pressure static  enclosure changing  enclosure 0 50 100 150 200 250 2 3 4 5 6 Flow Pressure static  enclosure changing  enclosure 25 l/s 14% difference
  • 19.
    à  The enclosuremay not remain static throughout the test à  The linear relationship may not be accurate at operating pressure à  Substituting n values can have magnified impacts at lower/higher pressure differentials à  R-squared values not perfect indicators Conclusions
  • 20.
    à  Sizing mechanicalsystems for predicted in operation flow rates à  Retrofit options Implications for the industry à  Energy models using extrapolated flow rates may be inaccurate
  • 21.
    à  Multi-point testingstill important à  Order of magnitude for comparison purposes à  Flow exponents tell us something, we might not know exactly what it is à  Standards at higher pressures can be used for compliance purposes The Good
  • 22.
    In-test corrections à  CheckR-squared values during testing à  Check n values at the termination of each test Post-test corrections à  Review data points and remove lowest pressure differential point(s) à  If not reconciled, single point test at 50 Pa Flow exponent corrections
  • 23.
    à  Sensitivity analysis:R-value threshold à  The use of flow exponent values in forensics à  Standardized leakage metric and pressure differential for comparison purposes à  Effect on flow exponent of enclosure geometry changes Further study
  • 24.