National Franchise Report: June 2015
•
1 like•482 views

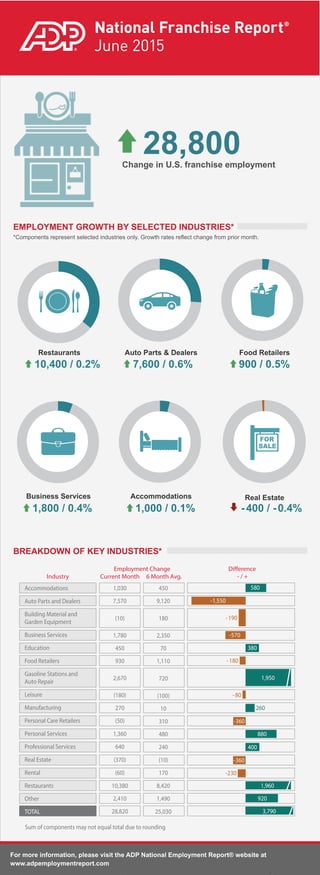
The U.S. added 28,800 franchise jobs in June, according to ADP national franchise report.
Recommended

Recommended
More Related Content
What's hot
Viewers also liked
Viewers also liked (11)
Similar to National Franchise Report: June 2015
Similar to National Franchise Report: June 2015 (20)
More from ADP, LLC
More from ADP, LLC (20)
Recently uploaded
Recently uploaded (20)
National Franchise Report: June 2015
- 1. National Franchise Report® June 2015 Change in U.S. franchise employment *Components represent selected industries only. Growth rates reflect change from prior month. EMPLOYMENT GROWTH BY SELECTED INDUSTRIES* BREAKDOWN OF KEY INDUSTRIES* Restaurants Auto Parts & Dealers Food Retailers Business Services Accommodations Real Estate 10,400 / 0.2% 7,600 / 0.6% 900 / 0.5% 1,800 / 0.4% 1,000 / 0.1% -400 / -0.4% Industry Current Month Employment Change 6 Month Avg. Difference - / + Accommodations Auto Parts and Dealers Building Material and Garden Equipment Business Services Education Food Retailers Gasoline Stations and Auto Repair Leisure Manufacturing Personal Care Retailers Personal Services Professional Services Real Estate Rental Restaurants Other TOTAL 1,030 7,570 (10) 1,780 450 930 2,670 (180) 270 (50) 1,360 640 (370) (60) 10,380 2,410 28,820 450 9,120 180 2,350 70 1,110 720 (100) 10 310 480 240 (10) 170 8,420 1,490 25,030 580 -1,550 -190 -570 380 -180 1,950 -80 260 -360 880 400 -360 -230 1,960 920 3,790 Sum of components may not equal total due to rounding 28,800