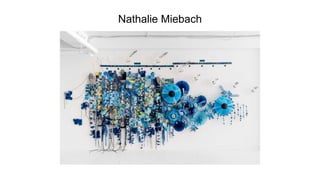
This document describes a series of artworks by Nathalie Miebach that translate weather data, environmental data, and COVID-19 data into weavings, sculptures, and other pieces. The artworks visualize patterns in the data and document events like the COVID-19 pandemic and hurricanes. Many of the pieces were created during residencies where the artist recorded on-site weather, sound, and environmental data that were then translated visually.
.
A “drought” is an extended period of deficient rainfall relative to the statistical multi-year average for a region. But because of the various ways it is measured, an objective drought definition has yet to be produced upon which everyone can agree.
The four types are: meteorological (lack of precipitation), agricultural, (lack of moisture in the soil where crops grow), hydrological (low levels of water in lakes and reservoirs), and socioeconomic (water shortages in drinking and running water).
Only .003% of water on Earth is freshwater available for human consumption. Save water by challenging friends to only use 13 gallons of water in a day. (It’s harder than it sounds!) Sign up for 13 Gallon Challenge.
Meteorologists predict drought based on precipitation patterns, stream flow, and moisture of soil over long periods of time.
In the United States, droughts are most likely to occur in the Midwest and the South.
1. My career from technician to scientist-engineer
2. How Climate Change Impacts Hurricanes and Weather Extremes
3. Finding Truth, Evaluating “Fake News” which confuses Weather & Climate.
4. What we can do to stop global warming.
Visualizing climate change through dataZachary Labe
18 November 2023…
NJ State Museum Planetarium (Presentation): Visualizing climate change through data, Trenton, NJ.
References...
Eischeid, J.K., M.P. Hoerling, X.-W. Quan, A. Kumar, J. Barsugli, Z.M. Labe, K.E. Kunkel, C.J. Schreck III, D.R. Easterling, T. Zhang, J. Uehling, and X. Zhang (2023). Why has the summertime central U.S. warming hole not disappeared? Journal of Climate, DOI:10.1175/JCLI-D-22-0716.1, https://journals.ametsoc.org/view/journals/clim/36/20/JCLI-D-22-0716.1.xml
Career pathways and research opportunities in the Earth sciencesZachary Labe
20 April 2023…
Mercer County Community College (Presentation): Career pathways and research opportunities in the Earth sciences, West Windsor Township, NJ, USA.
Monitoring indicators of climate change through data-driven visualizationZachary Labe
19 June 2023…
La Uni Climática - IV Edition (Presentation): Monitoring indicators of climate change through data-driven visualization. Remote Presentation.
Understanding and responding to the New Normal. This presentation was given at the Natural Hazard Mitigation Association's annual Symposium held every July in Broomfield, Colorado.
This presentation was given by Bob Henson of Weather Underground. You can watch the whole presentation here: https://www.youtube.com/watch?v=8qaq0PEs74o
Back to the Future: The Climate for Change and the Hydrographer of the FutureRobert (Bob) Williams
This presentation was given at Hydrospatial 2021 held in February 2022 at Cairns, Queensland. The presentation looks at capability of the futuristic Oceania Infrastructure and Environmental Support System.
Ringing true: The scientific and societal relevance of dendrochronology at th...Scott St. George
Tree rings and other natural archives empower us to extend our perspective on environmental change, resources, and hazards. But many contemporary applications of paleoclimatology and paleohydrology are useful because of the lasting disruption to our collective environmental memory caused by colonization.
Climate change extremes by season in the United StatesZachary Labe
11 September 2023…
Hershey Horticulture Society (Presentation): Climate change extremes by season in the United States, Hershey, PA, USA.
References...
Eischeid, J.K., M.P. Hoerling, X.-W. Quan, A. Kumar, J. Barsugli, Z.M. Labe, K.E. Kunkel, C.J. Schreck III, D.R. Easterling, T. Zhang, J. Uehling, and X. Zhang (2023). Why has the summertime central U.S. warming hole not disappeared? Journal of Climate, DOI:10.1175/JCLI-D-22-0716.1
Labe, Z.M., T.R. Ault, and R. Zurita-Milla (2016), Identifying Anomalously Early Spring Onsets in the CESM Large Ensemble Project, R. Clim Dyn, DOI:10.1007/s00382-016-3313-2
Labe, Z.M., N.C. Johnson, and T.L Delworth (2023). Changes in United States summer temperatures revealed by explainable neural networks. Preprint. DOI: 10.22541/essoar.168987129.98069596/v1
Barack Obama Climate Change Speech at Georgetown University - June 25, 2013Marcellus Drilling News
The full text of remarks/speech by President Barack H. Obama, delivered at Georgetown University in Washington, D.C. on June 25, 2013. The speech addresses the so-called issue of climate change and outlines his excuse for trashing the U.S. Constitution in pursuit of lowering carbon (the stuff you breathe out with every exhale) because carbon is causing global warming (even though the earth stopped warming 15 years ago, conveniently left of of this speech).
Pablo Suarez - Become a Disaster Manager: Red Cross VR Explorations for Flood...SeriousGamesAssoc
Pablo Suarez, Red Cross/Red Crescent Climate Change Center
This presentation was given at the 2017 Serious Play Conference, hosted by the George Mason University - Virginia Serious Play Institute.
Can you help save lives and money by taking action before a disaster hits? A new virtual reality (VR) game created by the Red Cross/Red Crescent Climate Centre puts users in the shoes of decision makers, letting them decide whether or not to ring an alarm bell, stamp papers for aid delivery, and load supplies into a relief truck – all from a virtual hill overlooking the green valley and the surging waters of the dam.
Presentation by David Bromwich, Professor of Atmospheric Sciences Program of the Department of Geography at The Ohio State University for The Risk Institute's Executive Education Series, "Weather Disruption and Risk Management" at The Ohio State University Fisher College of Business.
The French Revolution, which began in 1789, was a period of radical social and political upheaval in France. It marked the decline of absolute monarchies, the rise of secular and democratic republics, and the eventual rise of Napoleon Bonaparte. This revolutionary period is crucial in understanding the transition from feudalism to modernity in Europe.
For more information, visit-www.vavaclasses.com
The Roman Empire A Historical Colossus.pdfkaushalkr1407
The Roman Empire, a vast and enduring power, stands as one of history's most remarkable civilizations, leaving an indelible imprint on the world. It emerged from the Roman Republic, transitioning into an imperial powerhouse under the leadership of Augustus Caesar in 27 BCE. This transformation marked the beginning of an era defined by unprecedented territorial expansion, architectural marvels, and profound cultural influence.
The empire's roots lie in the city of Rome, founded, according to legend, by Romulus in 753 BCE. Over centuries, Rome evolved from a small settlement to a formidable republic, characterized by a complex political system with elected officials and checks on power. However, internal strife, class conflicts, and military ambitions paved the way for the end of the Republic. Julius Caesar’s dictatorship and subsequent assassination in 44 BCE created a power vacuum, leading to a civil war. Octavian, later Augustus, emerged victorious, heralding the Roman Empire’s birth.
Under Augustus, the empire experienced the Pax Romana, a 200-year period of relative peace and stability. Augustus reformed the military, established efficient administrative systems, and initiated grand construction projects. The empire's borders expanded, encompassing territories from Britain to Egypt and from Spain to the Euphrates. Roman legions, renowned for their discipline and engineering prowess, secured and maintained these vast territories, building roads, fortifications, and cities that facilitated control and integration.
The Roman Empire’s society was hierarchical, with a rigid class system. At the top were the patricians, wealthy elites who held significant political power. Below them were the plebeians, free citizens with limited political influence, and the vast numbers of slaves who formed the backbone of the economy. The family unit was central, governed by the paterfamilias, the male head who held absolute authority.
Culturally, the Romans were eclectic, absorbing and adapting elements from the civilizations they encountered, particularly the Greeks. Roman art, literature, and philosophy reflected this synthesis, creating a rich cultural tapestry. Latin, the Roman language, became the lingua franca of the Western world, influencing numerous modern languages.
Roman architecture and engineering achievements were monumental. They perfected the arch, vault, and dome, constructing enduring structures like the Colosseum, Pantheon, and aqueducts. These engineering marvels not only showcased Roman ingenuity but also served practical purposes, from public entertainment to water supply.
The Art Pastor's Guide to Sabbath | Steve ThomasonSteve Thomason
What is the purpose of the Sabbath Law in the Torah. It is interesting to compare how the context of the law shifts from Exodus to Deuteronomy. Who gets to rest, and why?
2024.06.01 Introducing a competency framework for languag learning materials ...Sandy Millin
http://sandymillin.wordpress.com/iateflwebinar2024
Published classroom materials form the basis of syllabuses, drive teacher professional development, and have a potentially huge influence on learners, teachers and education systems. All teachers also create their own materials, whether a few sentences on a blackboard, a highly-structured fully-realised online course, or anything in between. Despite this, the knowledge and skills needed to create effective language learning materials are rarely part of teacher training, and are mostly learnt by trial and error.
Knowledge and skills frameworks, generally called competency frameworks, for ELT teachers, trainers and managers have existed for a few years now. However, until I created one for my MA dissertation, there wasn’t one drawing together what we need to know and do to be able to effectively produce language learning materials.
This webinar will introduce you to my framework, highlighting the key competencies I identified from my research. It will also show how anybody involved in language teaching (any language, not just English!), teacher training, managing schools or developing language learning materials can benefit from using the framework.
This is a presentation by Dada Robert in a Your Skill Boost masterclass organised by the Excellence Foundation for South Sudan (EFSS) on Saturday, the 25th and Sunday, the 26th of May 2024.
He discussed the concept of quality improvement, emphasizing its applicability to various aspects of life, including personal, project, and program improvements. He defined quality as doing the right thing at the right time in the right way to achieve the best possible results and discussed the concept of the "gap" between what we know and what we do, and how this gap represents the areas we need to improve. He explained the scientific approach to quality improvement, which involves systematic performance analysis, testing and learning, and implementing change ideas. He also highlighted the importance of client focus and a team approach to quality improvement.
How to Make a Field invisible in Odoo 17Celine George
It is possible to hide or invisible some fields in odoo. Commonly using “invisible” attribute in the field definition to invisible the fields. This slide will show how to make a field invisible in odoo 17.
Model Attribute Check Company Auto PropertyCeline George
In Odoo, the multi-company feature allows you to manage multiple companies within a single Odoo database instance. Each company can have its own configurations while still sharing common resources such as products, customers, and suppliers.
Read| The latest issue of The Challenger is here! We are thrilled to announce that our school paper has qualified for the NATIONAL SCHOOLS PRESS CONFERENCE (NSPC) 2024. Thank you for your unwavering support and trust. Dive into the stories that made us stand out!
We all have good and bad thoughts from time to time and situation to situation. We are bombarded daily with spiraling thoughts(both negative and positive) creating all-consuming feel , making us difficult to manage with associated suffering. Good thoughts are like our Mob Signal (Positive thought) amidst noise(negative thought) in the atmosphere. Negative thoughts like noise outweigh positive thoughts. These thoughts often create unwanted confusion, trouble, stress and frustration in our mind as well as chaos in our physical world. Negative thoughts are also known as “distorted thinking”.
Unit 8 - Information and Communication Technology (Paper I).pdfThiyagu K
This slides describes the basic concepts of ICT, basics of Email, Emerging Technology and Digital Initiatives in Education. This presentations aligns with the UGC Paper I syllabus.
Operation “Blue Star” is the only event in the history of Independent India where the state went into war with its own people. Even after about 40 years it is not clear if it was culmination of states anger over people of the region, a political game of power or start of dictatorial chapter in the democratic setup.
The people of Punjab felt alienated from main stream due to denial of their just demands during a long democratic struggle since independence. As it happen all over the word, it led to militant struggle with great loss of lives of military, police and civilian personnel. Killing of Indira Gandhi and massacre of innocent Sikhs in Delhi and other India cities was also associated with this movement.
2. Since 2020, I have been integrating weather and Covid-
19 data into weavings that are entirely built by data and
are a form of documentation of this global pandemic.
3. Life Lines
2022
Paper on canvas
Divided into 12 panels, each
square translates weather data,
COVID-19 deaths, hospitalisation,
sewage data, vaccination phases,
and variants from January to
December, 2021. Each white line
is a human life lost to Covid-19.
https://www.nathaliemiebach.com
5. The Blindness of Seeing
Patterns
2021
Paper, wood, data
This piece translates
Covid-19 and weather data
related to the Summer of
2021.
6. Comfort Zones
2021
Paper, string, data
This piece explores the outdoor
temperature range that felt
comfortable to wear a mask.
Using data from Boston, this piece
translates cloud cover,
temperature (March 2020-Jan
2021), solar azimuth for 2020 and
Covid-19 death rates every 15th of
the month from April ’20 to
Sept’21.
7. Sunny Days
2021
Paper, string, data
During the pandemic, I became
very aware of how much I loved
the chance of being outside. This
piece explores how my
relationship with cloud cover
changed before and after I was
vaccinated. It translates cloud
cover and temperature from
March, as well as my vaccination
cycle.
9. Stay Safe and Healthy
2020
Watercolor on paper
Cloud cover, temperature
readings from three places I have
loved ones in quarantine: Florida,
Boston and Lyon (France). Also
included are Covid-19 infection
rates and death rates for
Massachusetts in July 2020.
10. Stay Safe and Healthy (Backside)
2020
Watercolor on paper
Cloud cover, temperature
readings from three places I have
loved ones in quarantine: Florida,
Boston and Lyon (France). Also
included are Covid-19 infection
rates and death rates for
Massachusetts in July 2020.
11. For many years, I’ve been focusing on extreme weather
events, particularly floods that are triggered by storms,
precipitation and sea level rise.
13. Sibling Rivalry
2016
Paper, wood, fibres, data
Using human narratives and
the weather data of
Hurricanes Katrina and
Hurricane Sandy, this piece
explores the dissonance and
co-existence between the
physic of weather with the
theatre of human responses.
14. A Storm Within A Storm Within A
Storm Within
2018
Wood, paper, rope, data
Hurricane Maria was one of
several storms and human-made
disasters that finally crumbled
Puerto Rico. This piece combines
weather data from Hurricane
Maria and Hurricane Irma,
layering both on top of a
precarious tower of rafts.
15. The Madness of a Drowning
Gambler
2019
Rope, paper, wood, plastic,
data
This triptych explores the
existential dilemma, in
which we are both the
source and the victim of
extreme weather patterns
and sea level rise, focusing
on Houston and the coastal
areas near Galveston.
16. Lost Porches
2016
Wood, paper, string, data
Many things were lost during
Hurricane Katrina, including the
porch as a social gathering space
for people living in New Orleans.
This piece tracks the
redevelopment of a small section
of the Lower Ninth Ward during
the last 10 years.
17. The Last Show Was For The
Bleachers
2016
Wood, paper, string, data
An aerial map of the New Jersey /
New York shoreline, this piece
translates Hurricane Sandy data.
Retired Hurricanes, in the shapes
of domino pieces sitting on
bleachers, look on as Sandy will
soon join them on their benches.
18. Inspired by Hurricane Sandy, numerical data in these
pieces build actual amusement park rides. At the same
time, they suggest another narrative of what coastal life
might be like in the future living with a changing climate.
19. https://www.nathaliemiebach.com
The Ride
2015
Mixed media, paper, data
This piece translates data
from NJ and NY related to
Hurricane Sandy, together
building a structure that
references the Star
Rollercoaster at Seaside
Heights and Jane’s Carousel
in Brooklyn.
20. The Last Ride
2012
Reed, wood, data
This piece translates
weather and ocean data
from Oct 29-30, when
Hurricane Sandy took the
last ride on the Star Jet
Rollercoaster.
21. Chutes and Ladders
2015
Wood, Paper, data
Weather and ocean data is
translated on amusement
park rides that seem to both
float on water and mingle
together in a chaotic vortex,
making reference to a board
game of chance.
22. O Fortuna, Sandy Spins
2013
Reed, wood, data
This piece takes weather
and ocean data from Coney
Island, NY and Seaside
Heights,NJ during Oct 29,
when Sandy took a ride on
both the Jet Star Roller
coaster and Deno's Wonder
Wheel.
23. She Cast Her Circles Wide
2016
Rope, paper, wood, data
This futuristic amusement
park / city on rafts translates
data related to Hurricane
Sandy from NJ and NY.
24. Using the basket grid as a 24-hour clock, these pieces
explore data related to tidal currents, solar and lunar
data in polar regions and beyond.
25. https://www.nathaliemiebach.com
Antarctic Explorer –
Darkness to Lightness
2007
Reed, wood, plastic, data
A portable data device for
the Antarctic Explorer,
this piece explores the
transition from complete
darkness in June to 24
hour sunlight in October.
26. Antarctic Tidal Rhythms
2006
Reed, wood, foam, data
Using a base of 24 hours,
this piece converts
various layers of data
(Jan-Dec 2005) related to
tides in the Antarctic
environment.
27. Twilight, Tides and Whales
2006
Reed, wood, data
This piece looks at the
relationship between moon
and sun rise and set, data,
tidal and twilight readings
taken in Provincetown, MA,
and whale sightings along
the New England Coast
during the time frame of
February – March 2006.
28. Antarctic Surveyor II
2008
Reed, wood, data
Looking at astronomical data
during the transitional period
from total darkness to 24
hour sunlight in Antarctica,
this piece translates moon,
sun and wind data. It is also
a surveying device for
calibrating one’s position
along the horizon.
29. Since 2009, I’ve been translating weather data into 2D
and 3D musical scores that become blueprints for my
sculptures. They are also used in collaborations with
composers through the Weather Score Project.
34. The Ghostly Crew of the
Andrea Gail
2011
Reed, wood, data
This 3D musical score follows
the sinking of the Andrea Gail
during the Perfect Storm.
Each ship mast is a section of
the score while the remaining
sculpture translates other data
related to the event.
35. She's Coming on Strong
2011
Paper, wood, data
This piece is a musical score
that tracks the paths of both
Hurricane Grace and the
Halloween Storm, which
together created the "Perfect
Storm".
36. Urban Prairie Orchestra
2009
Reed, wood, data
This installation translates
weather and tornado data I
collected during a residency at
Bemis Center for
Contemporary Arts in Omaha,
NE. It is arranged in the
format of an orchestra, in
which each sculpture “plays”
part of the overall score.
37.
38. A Duet of Blizzards
2010
Wood, paper, data
A musical score that
translates data from two
blizzards (Dec 2007 and Feb
1978) that impacted New
England.
39. During 2006-2008, I spent two years on Cape Cod,
recording weather and ocean data from Herring Cove
Beach, which were then translated into the sculptures.
40. Solar Beginnings of
Everything that Changes
2008
Reed, wood, data
This piece translates data
related to recorded ecological
changes observed at Herring
Cove Beach (Cape Cod)
during Oct '07 - Mar '08.
https://www.nathaliemiebach.com
41. Changing Waters
2011
Mixed Media, data
This installation looks at
the interaction of ocean
and weather in the Gulf of
Maine, using data from
buoys and weather
stations.
42. Warm Winter
2007
Reed, wood, data
This piece translates data
from a warm winter period,
using data from buoys and
weather stations near and
on Cape Cod.
43. Temporal Warmth: Tango
Between Air, Land and Sea
2008
Reed, wood, data
A piece that looks at the
relationship between air,
water and land temperatures
during a 3 month period.
44.
45. This series was inspired while in residence at the
Mountain Lake Biological Station near Roanoke, VA,
where I spent two weeks recording environmental
sounds and then translating them into visual maps that
can be treated as scores.
46. https://www.nathaliemiebach.com
Wind I, July 13, 11:28–
11:32am
2015
Paper collage
Translating the movement of
wind within a clearing at the
station, using six nearby trees
and the canopy beyond as
reference points.
47. Wind II, July 13, 11:33–
1:42am
2015
Paper collage
Translating the movement of
wind within a clearing at the
station, using six nearby trees
and the canopy beyond as
reference points.
48. Wind III, July 13, 11:43–
11:47am
2015
Paper collage
Translating the movement of
wind within a clearing at the
station, using six nearby trees
and the canopy beyond as
reference points.
49. A Round of Sounds
2015
Wood, paper, sounds
The direction, sequence and
quality of a variety of sounds
recorded at the station are
translated into the format
board game that could be
interpreted as a musical
score.
50. Copley Square, July 28th,
4:27-4:45pm
2015
Paper collage
A translation of mechanical
and human sounds found on
Copley Square,
Boston, into a series of lines
and forms that can be
interpreted musically.
51. A Square in the Sky
2015
Paper, wood
An aerial map of sounds,
wind, jet stream, bird
migration routes, hurricane
paths, and cloud patterns
that cross over the station.
52. This series was inspired while in residence at the
Mountain Lake Biological Station near Roanoke, VA,
where I spent two weeks recording environmental
sounds and then translating them into visual maps that
can be treated as scores.
53. https://www.nathaliemiebach.com
And the Winds Kept
Roaring Through the Night
2011
Reed, wood, data
This piece translates wind
data from St. John's, Sable
Island and Gloucester
during the fateful night of
Oct 28, 1991 when the
fishing vessel Andrea Gail
sank during the Perfect
Storm.
54. Retiring Bob
2013
Wood, data, paper
When hurricanes created too
much damage and loss of life,
their names are retired. Hurricane
Bob, one of the costliest storms,
was not one that died easily and
remained a trackable system until
it had traveled across the Atlantic
Ocean until it finally hit shore in
Portugal. This piece translates its
journey across the ocean to
eventual retirement.
55. In the Shadow of a Giant
2013
Reed, paper, data
The Blizzard of 78 has remained a
measurement pole against which all
Nor’easter storms are compared to.
Every time a bad one hits New
England, the memories of the
Blizzard of 78 are awoken. In 2013,
a blizzard that shared many features
of the Blizzard of ’78 hit New
England. This piece juxtaposes data
from both storms.
58. I try to have one day a week in which I don’t work with
data, but simply focus on sculpture. These pieces are all
made in one day and are exercises in not overthinking
decisions.
62. I have made commissions for public as well as private
spaces, both large and small.
63. https://www.nathaliemiebach.com
Spinning Towards a New
Normal
2022
Reed, wood, data
This piece for the Staatliche
Museen zu Berlin translates
Covid-19 infection, death
rates and vaccination rates
for Germany, Italy and Spain
from March 2020-Feb 2022.
64. The Persistence of Play
2012
Steel, reed, paper, data
Public Art Commission for
Massachusetts College of Art
The Persistence of Play is a
whimsical, idiosyncratic, data-
driven look at the history of
MassArt within the context of the
larger economic, historical,
technological and social
developments that have shaped its
continued evolvement since 1873.
65. The Persistence of
Play - Detail
2012
Steel, reed, paper,
data
Public Art Commission
for Massachusetts
College of Art.
67. Between The Covers - Detail
2019
Paper
Site-specific commission for
library room in Bower
Condominiums.
68. Some Stayed, Some Left
and Some Have Yet to
Come
2015
Rope, wood, paper, data
A wall piece that translates
data related to the ever
evolving South End
neighbourhood in Boston.