Download to read offline


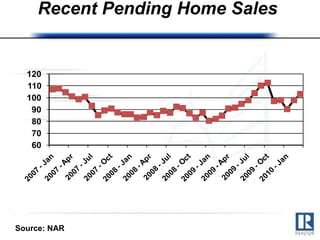
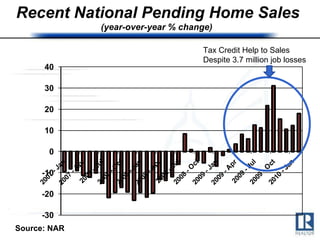

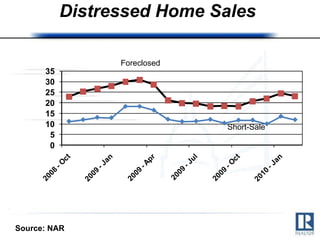
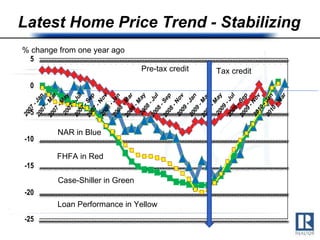
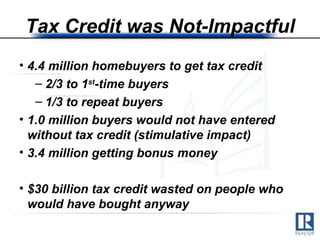
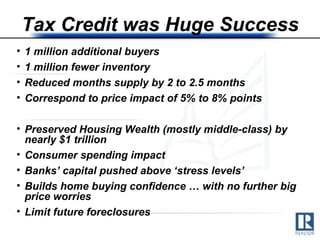
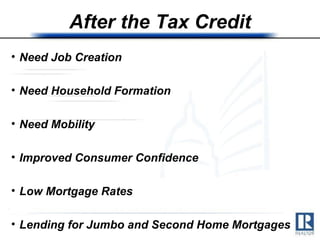
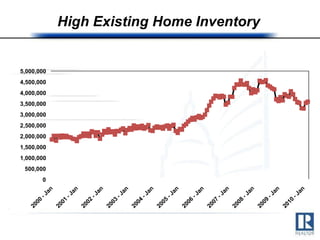
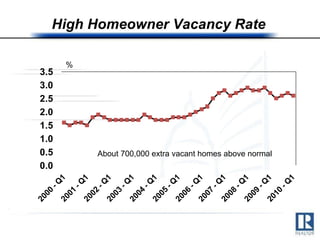
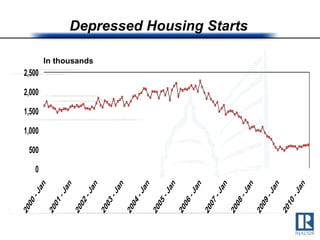
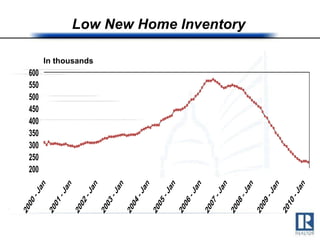
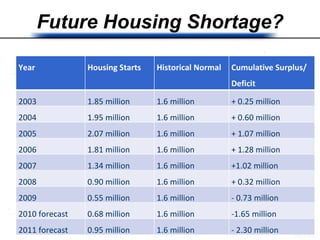

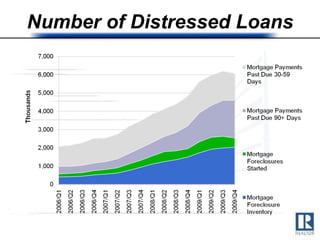

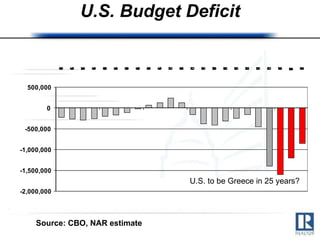
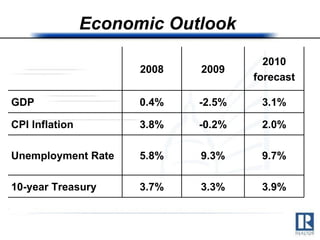
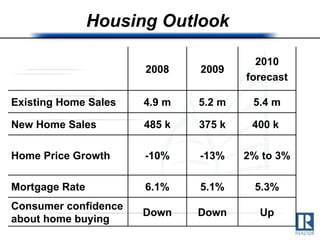

- The document summarizes the state of the US housing market and economic outlook based on a presentation by Lawrence Yun, Chief Economist at the National Association of Realtors. - It finds that the first-time homebuyer tax credit was successful in stimulating home sales but much of the benefit went to those who would have bought anyway. Continued job growth is needed for further recovery. - While home prices and sales are stabilizing, high foreclosure and housing inventory rates remain risks going forward. The outlook expects moderate economic and housing market growth through 2010 but uncertainty remains from factors like a possible Greek debt crisis contagion.