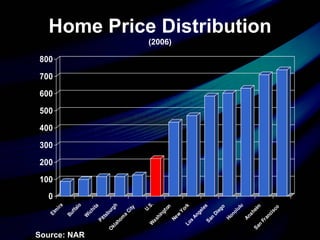
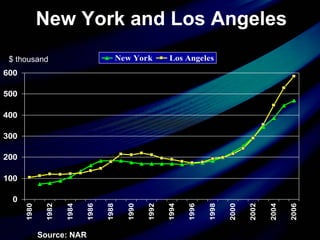
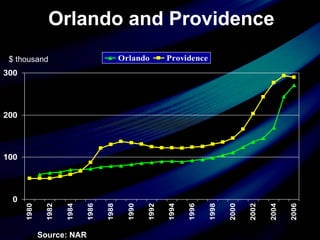
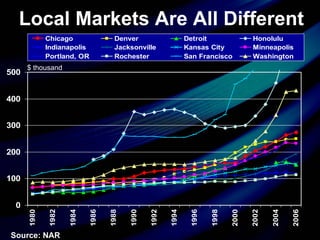
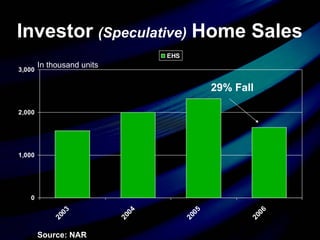
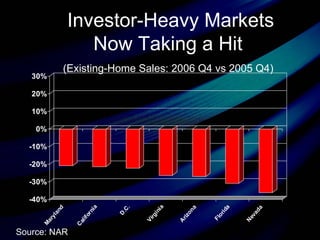
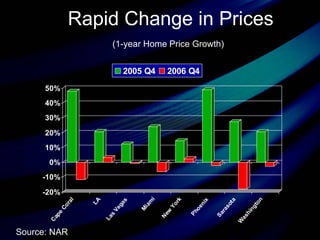
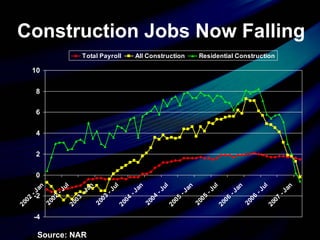
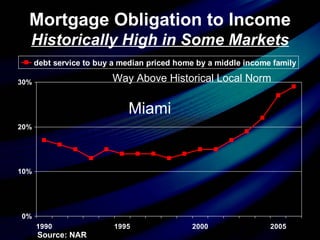
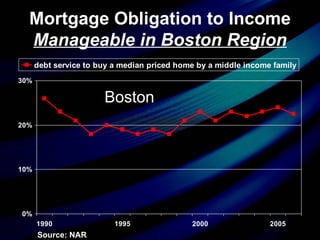
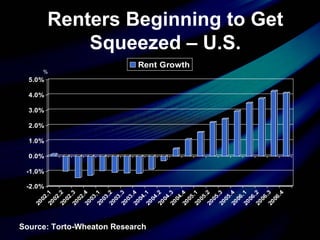
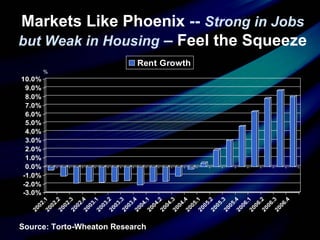
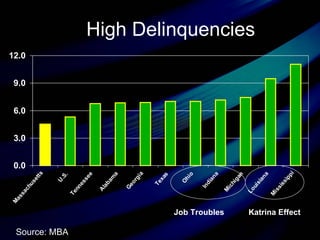
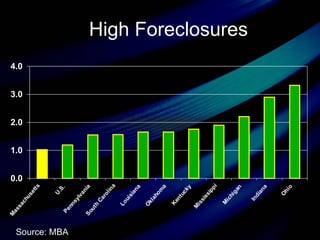
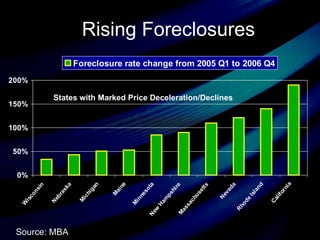
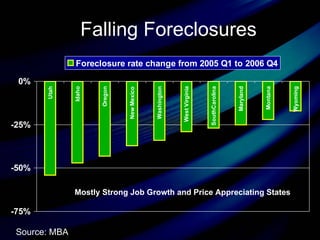
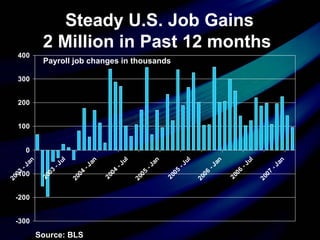
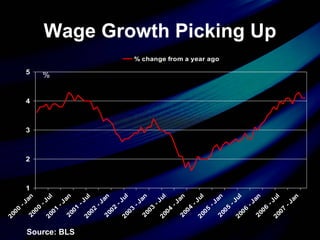
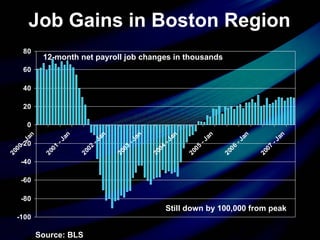
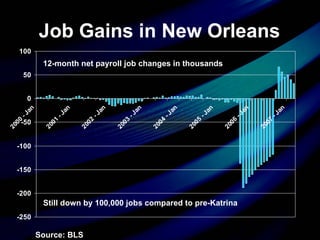
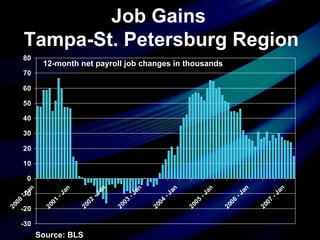
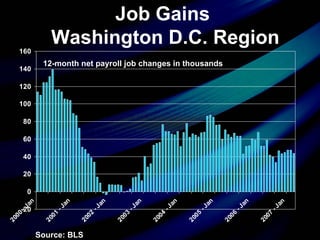
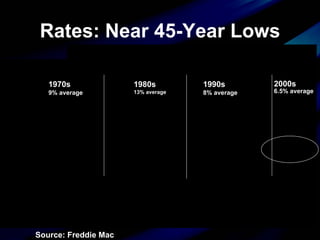
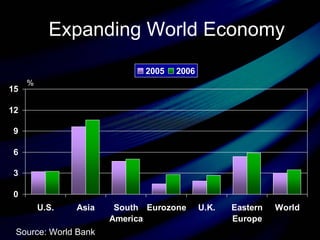
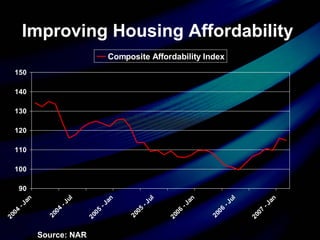
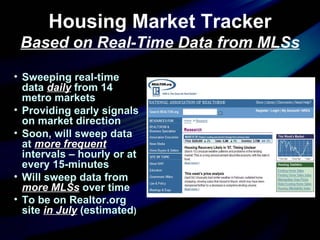
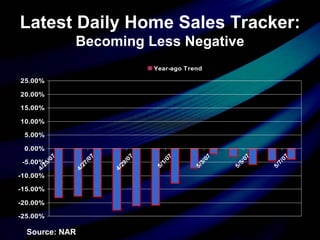
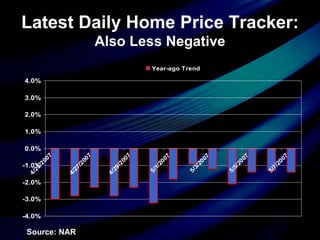
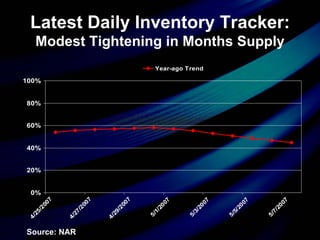
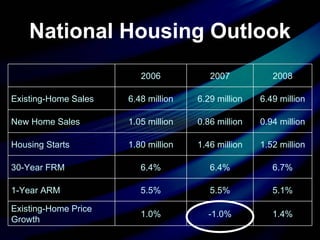
Economic Issues and Residential Real Estate Business Trends Forum NAR Midyear Meetings Washington, D.C. May 17, 2007 Lawrence Yun, Ph.D.  Senior Economist NATIONAL ASSOCIATION OF REALTORS® All Real Estate is  Local : Local Trends and  Local Forecasts
Home Price Distribution (2006) Source: NAR
New York and Los Angeles Source: NAR $ thousand
Atlanta and Columbus Source: NAR $ thousand
Orlando and Providence Source: NAR $ thousand
Local Markets Are All Different Source: NAR $ thousand
Typical U.S. Home Price Source: NAR Ten-fold increase over 38 years for the U.S. What multiple in your local area?
Soft or Hard Landing? Source: NAR, Dow Jones, NASDAQ Annual % Change
NASDAQ Index Source: NASDAQ
Where is the Housing Correction?
U.S. New Single-Family Construction Source: Census 33% Tumble
U.S. Existing-Home Sales Source: Census 11% Retreat In thousand units
Investor   (Speculative)   Home Sales Source: NAR 29% Fall In thousand units
Vacation Home Sales Source: NAR In thousand units
Investor-Heavy Markets Now Taking a Hit  (Existing-Home Sales: 2006 Q4 vs 2005 Q4)   Source: NAR
Rapid Change in Prices (1-year Home Price Growth)   Source: NAR
Construction Jobs Now Falling Source: NAR
Income of REALTORS ® Source: NAR
Housing’s Contribution to Economy Source: BEA % point contribution to GDP
Sub-Par Economic Growth Source: BEA
Property Taxes, Transfer Taxes, Impact Fees, Recordation Expenses … Local government spending needs =  Inflation rate + population growth   Inflation rate = about 3% Population growth = -1% to +8% Government Spending Needs On average = 3% + 1% = 4% At most = 3% + 8% = 11% How much has your local government revenue risen?
Fight the Bubble
Something is Out of Whack!  Income and Price set to Index of 100 in 1990 Source: NAR
Mortgage Obligation to Income  Manageable Source: NAR %
Mortgage Obligation to Income  Very High in Some Markets San Diego 45% !!! Source: NAR
Mortgage Obligation to Income  Historically High in Some Markets Miami Way Above Historical Local Norm Source: NAR
Mortgage Obligation to Income  Manageable in Boston Region Boston Source: NAR
Mortgage Obligation to Income  Favorable in Louisville Source: NAR 11% Louisville
Renters Beginning to Get Squeezed – U.S. Source: Torto-Wheaton Research %
Markets Like Phoenix  --  Strong in Jobs but Weak in Housing  –  Feel the Squeeze Source: Torto-Wheaton Research %
Subprime Impact
Mortgage Delinquencies   Source: MBA Job Losses Housing Boom Housing Slump
Mortgage Loan Foreclosures: All Action in the Subprime Markets Source: MBA
High Delinquencies Source: MBA Katrina Effect Job Troubles
High Foreclosures   Source: MBA
Rising Foreclosures   Source: MBA States with Marked Price Deceleration/Declines
Falling Foreclosures   Source: MBA Mostly Strong Job Growth and Price Appreciating States
FHA Market Share …Revival Ahead?   Source: HMDA ??? Estimate
Jobs Will Buffer the Subprime Fallout
Steady U.S. Job Gains 2 Million in Past 12 months  Source: BLS Payroll job changes in thousands
Wage Growth Picking Up % Source: BLS
Job Gains in Boston Region Source: BLS 12-month net payroll job changes in thousands Still down by 100,000 from peak
Job Gains in New Orleans Source: BLS 12-month net payroll job changes in thousands Still down by 100,000 jobs compared to pre-Katrina
Job Gains in Seattle Region Source: BLS 12-month net payroll job changes in thousands
Jobs in Dallas- Ft. Worth Region Source: BLS 12-month net payroll job changes in thousands
Job Gains  Tampa-St. Petersburg Region Source: BLS 12-month net payroll job changes in thousands
Job Gains Phoenix Region Source: BLS 12-month net payroll job changes in thousands
Job Gains  Washington D.C. Region Source: BLS 12-month net payroll job changes in thousands
Jobs:  Detroit Region Source: BLS 12-month net payroll job changes in thousands
Rates: Near 45-Year Lows Source: Freddie Mac 1970s 9% average 1980s 13% average 1990s 8% average 2000s 6.5% average
Stable Mortgage Rates Source: Freddie Mac
Mortgage Rates Retreat But Where are the Buyers? Source: Freddie Mac
Dow Jones Industrial Average Source: NYSE
Record Household Wealth $ trillion Source: Federal Reserve
Expanding World Economy   Source: World Bank %
U.S. vs Foreign Currencies Source: Federal Reserve
Housing Comeback Jobs being created Rates at near historic lows Address tax and insurance problems No further artificial swings by speculators Raise buyer confidence Set the record straight: All Real Estate is Local
Existing Housing Inventory Source: NAR
New-Home Inventory Source: Census
Mortgage Purchase Applications   Source: MBA Index
Price Correction – Ending? Source: NAR Percent change from a year ago
Improving Housing Affordability  Source: NAR
Housing Market Tracker Based on Real-Time Data from MLSs Sweeping real-time data  daily  from 14 metro markets Providing early signals on market direction Soon, will sweep data at  more frequent  intervals – hourly or at every 15-minutes Will sweep data from  more MLSs  over time To be on Realtor.org site  in July  (estimated )
Latest Daily Home Sales Tracker: Becoming Less Negative Source: NAR
Latest Daily Home Price Tracker: Also Less Negative Source: NAR
Latest Daily Inventory Tracker: Modest Tightening in Months Supply Source: NAR
Economic Outlook  The Fed cuts rate in early 2008 4.8% 2.5% 4.6% 2.1% 2007 5.0% 4.8% 10-year Treasury 2.5% 3.2% CPI Inflation 4.8% 4.6% Unemployment Rate 3.0% 3.3% GDP 2008 2006
National Housing Outlook -1.0% 5.5% 6.4% 1.46 million 0.86 million 6.29 million 2007 1.4% 1.0% Existing-Home Price Growth 5.1% 5.5% 1-Year ARM  6.7% 6.4% 30-Year FRM  1.52 million 1.80 million Housing Starts 0.94 million 1.05 million New Home Sales 6.49 million 6.48 million Existing-Home Sales 2008 2006
Local Forecasts: Who Will be on Top?
Top Five Markets    (in random order) Nashville Austin Salt Lake City Denver Raleigh-Durham Watch out for these small markets St. George, UT  Myrtle Beach, SC
Top Global Livable Cities    (Ranked by Economist Intelligence Unit) Vancouver 26.  Cleveland 26.  Pittsburgh Honolulu 33.  Boston Chicago 33.  Miami Seattle Others: Atlanta, D.C., Detroit, Houston
Best Evidence: Household Wealth Accumulation   Source: Federal Reserve Median Net Worth $184,400 $4,000
Economic Issues and Residential Real Estate Business Trends Forum NAR Midyear Meetings Washington, D.C. May 17, 2007 Lawrence Yun, Ph.D.  Senior Economist NATIONAL ASSOCIATION OF REALTORS® All Real Estate is  Local : Local Trends and  Local Forecasts

A Bright Future For Housing in 2008