
Download to read offline

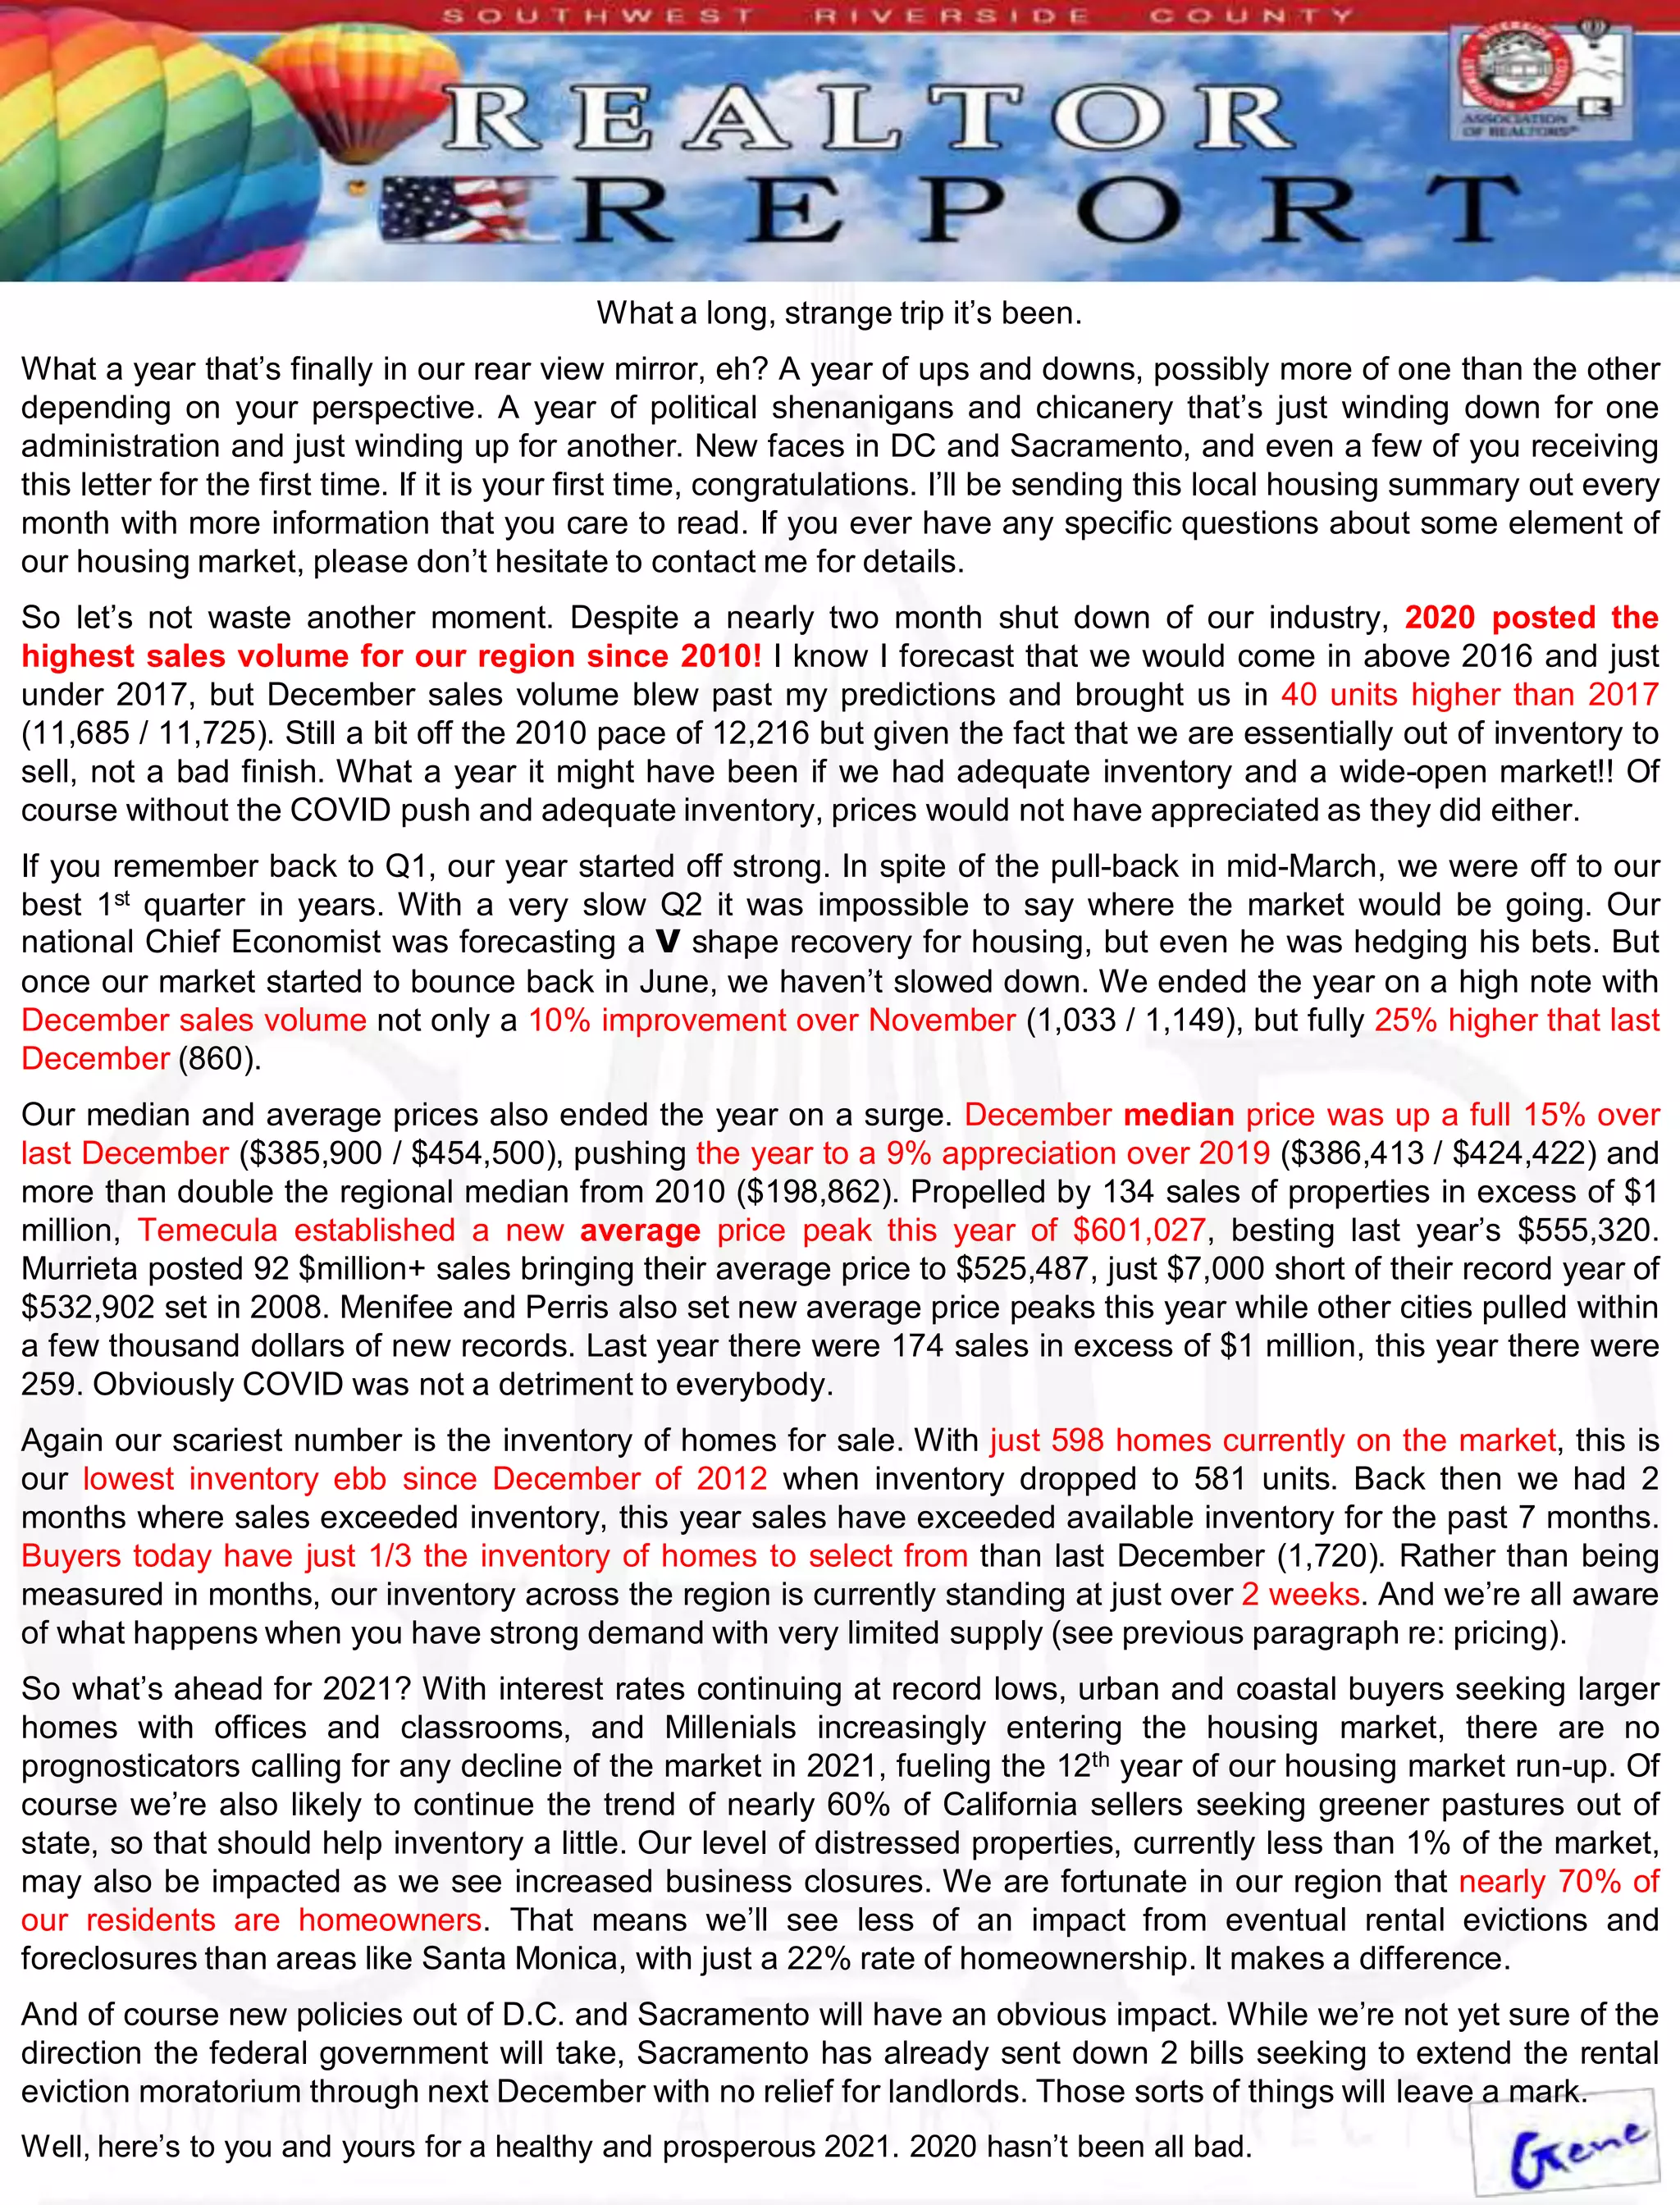
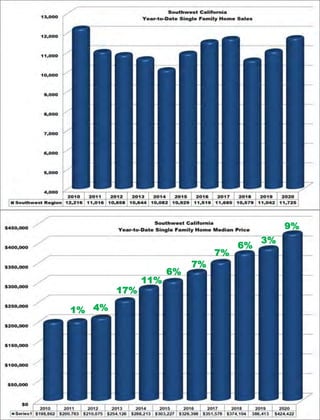
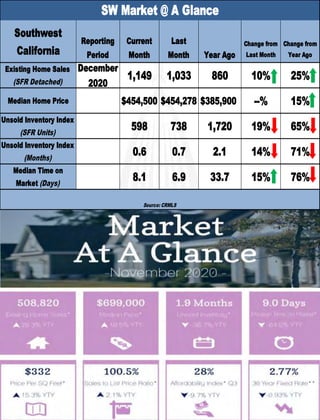
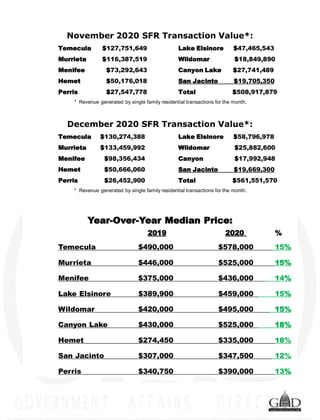
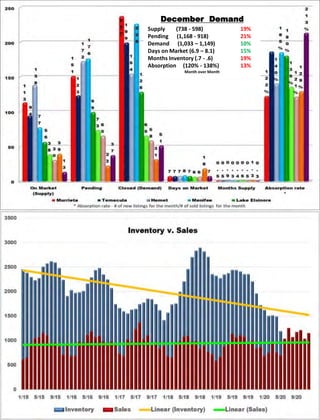
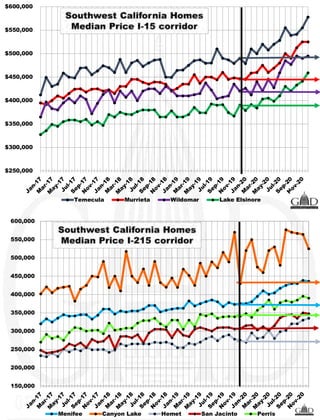

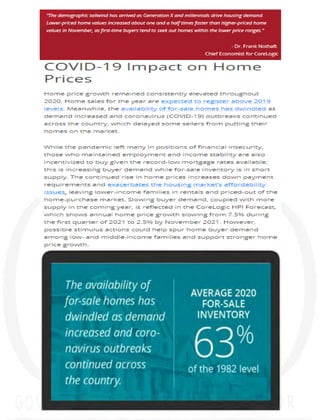
The housing market in Southwest California had a strong year in 2020 despite the pandemic shutdown. Sales volume was the highest since 2010 with over 11,000 homes sold. Median and average home prices reached new peaks, with 259 homes selling for over $1 million, up from 174 in 2019. However, inventory remains very low with only 598 homes currently for sale, the lowest level since 2012. The low inventory coupled with continued high demand is expected to sustain price appreciation in 2021, though new policies and economic impacts from the pandemic could influence the market.


