Download to read offline


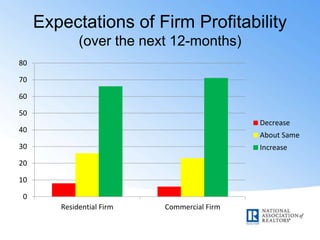


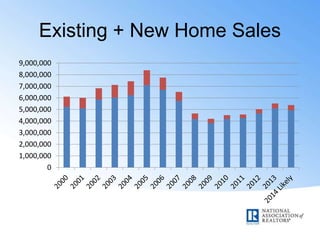


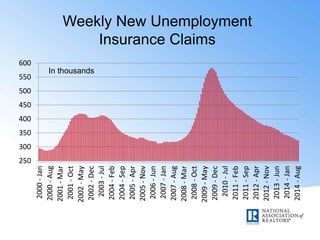
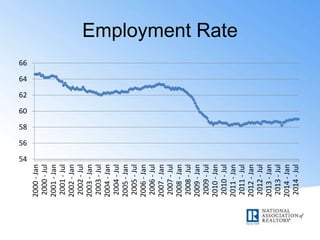


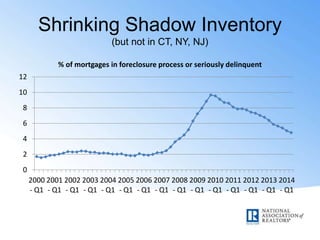

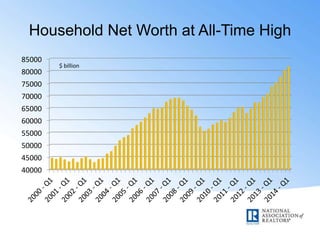


This document contains a presentation by Lawrence Yun, Chief Economist at the National Association of REALTORS, given at their annual residential forum in New Orleans. It includes over 30 charts and graphs analyzing trends in the housing market, home prices, household formation, mortgage rates and more. The presentation finds signs that the housing recovery is continuing as home sales, prices and construction have increased in recent years while mortgage rates remain low. However, challenges remain around low inventory levels, student debt burdening young adults and an uneven economic recovery.