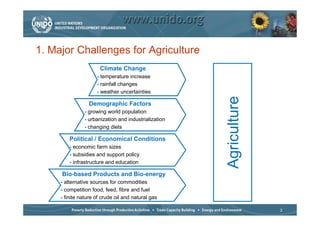
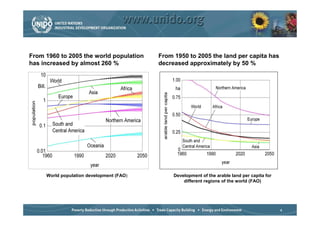
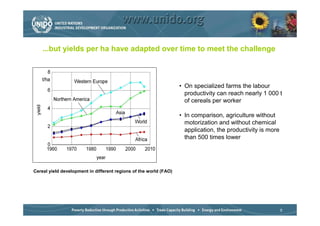
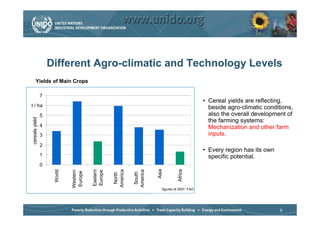
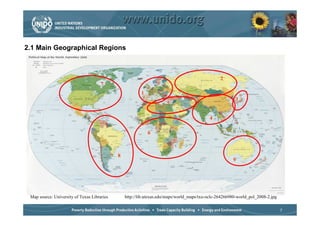
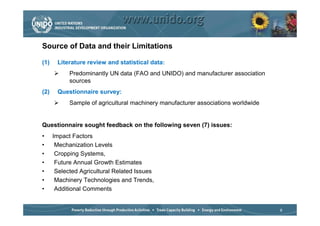
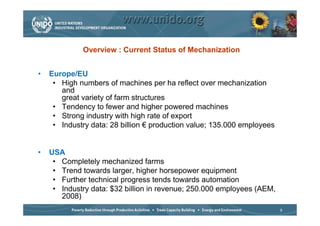
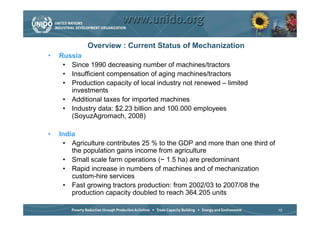
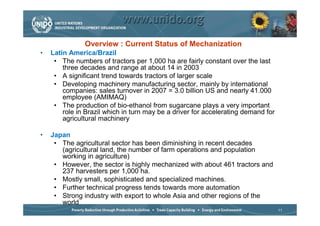
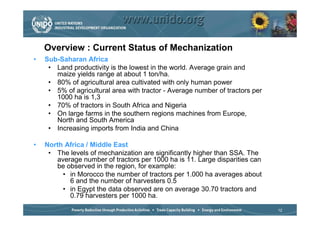
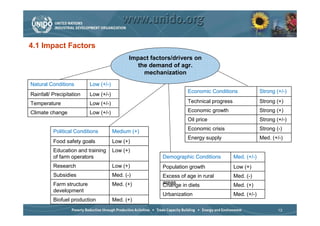
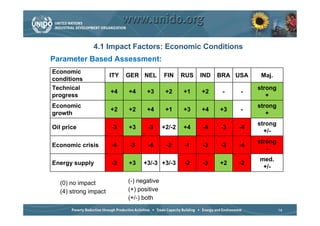
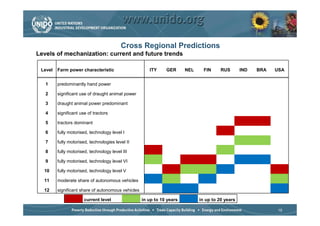
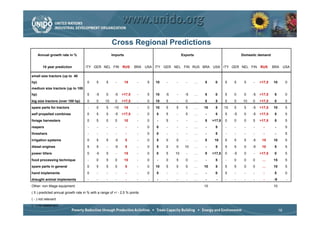
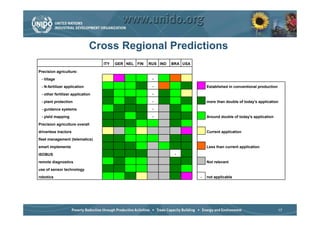
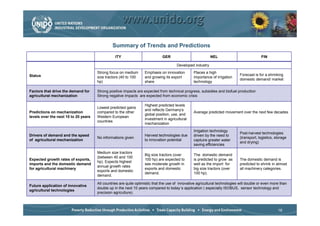
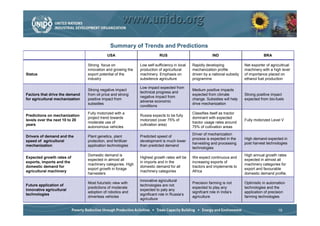
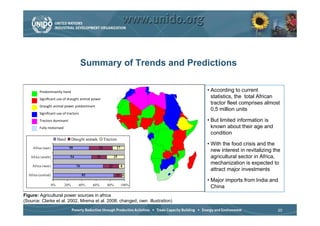
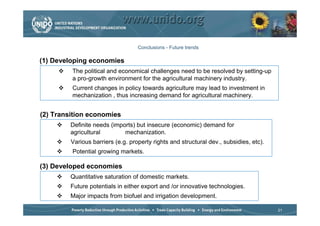
World evolution of the
            Agricultural Machinery
            Manufacturing Sector
                           Presented by

                     Dr. Namal Samarakoon
                  Industrial Development Officer

                Agri-Business Development Branch
United Nations Industrial Development Organization, Vienna, Austria


                                                                      1
Outline
• Major Challenges for Agriculture
• Analytical Framework
      Main Geographical Regions
      Data Sources and their Limitations
• General Overview of Agricultural Mechanization in Different Regions
  of the World
• Future Trends and Evolution of Agricultural Mechanization
• Safety Aspects
• Conclusions


                                                                        2
1. Major Challenges for Agriculture
                      Climate Change
                     - temperature increase
                     - rainfall changes
                     - weather uncertainties


                                                      Agriculture
                 Demographic Factors
               - growing world population
               - urbanization and industrialization
               - changing diets

         Political / Economical Conditions
         - economic farm sizes
         - subsidies and support policy
         - infrastructure and education

     Bio-based Products and Bio-energy
     - alternative sources for commodities
     - competition food, feed, fibre and fuel
     - finite nature of crude oil and natural gas

                                                                    3
From 1960 to 2005 the world population    From 1950 to 2005 the land per capita has
has increased by almost 260 %             decreased approximately by 50 %


     World population development (FAO)        Development of the arable land per capita for
                                                   different regions of the world (FAO)


                                                                                               4
...but yields per ha have adapted over time to meet the challenge


                                                                   • On specialized farms the labour
                                                                     productivity can reach nearly 1 000 t
                                                                     of cereals per worker

                                                                   • In comparison, agriculture without
                                                                     motorization and without chemical
                                                                     application, the productivity is more
                                                                     than 500 times lower


Cereal yield development in different regions of the world (FAO)


                                                                                                             5
Different Agro-climatic and Technology Levels
       Yields of Main Crops

                7
                                                                                               • Cereal yields are reflecting,
t / ha
     6                                                                                           beside agro-climatic conditions,
                5                                                                                also the overall development of
cereals yield


                                                                                                 the farming systems:
                4                                                                                Mechanization and other farm
                3                                                                                inputs.
                2
                                                                                               • Every region has its own
                1                                                                                specific potential.
                0
                                                                     Asia


                                                                                  Africa
                                       Eastern


                                                 America


                                                           America
                     World


                             Western


                                       Europe
                             Europe


                                                            South
                                                  North


                                                                        figures of 2007, FAO


                                                                                                                            6
2.1 Main Geographical Regions


                                                                                                 2
                                      7
                                                         1
                                                                                                         3
                                                                      5

                                                                                            4

                                                             6


                                             8
                                                                                                       9


 Map source: University of Texas Libraries       http://lib.utexas.edu/maps/world_maps/txu-oclc-264266980-world_pol_2008-2.jpg

                                                                                                                                 7
Source of Data and their Limitations

(1)    Literature review and statistical data:
            Predominantly UN data (FAO and UNIDO) and manufacturer association
            sources
(2)    Questionnaire survey:
            Sample of agricultural machinery manufacturer associations worldwide


Questionnaire sought feedback on the following seven (7) issues:
•     Impact Factors
•      Mechanization Levels
•      Cropping Systems,
•      Future Annual Growth Estimates
•      Selected Agricultural Related Issues
•      Machinery Technologies and Trends,
•      Additional Comments


                                                                                   8
Overview : Current Status of Mechanization


•   Europe/EU
     • High numbers of machines per ha reflect over mechanization
       and
       great variety of farm structures
     • Tendency to fewer and higher powered machines
     • Strong industry with high rate of export
     • Industry data: 28 billion € production value; 135.000 employees


•   USA
     • Completely mechanized farms
     • Trend towards larger, higher horsepower equipment
     • Further technical progress tends towards automation
     • Industry data: $32 billion in revenue; 250.000 employees (AEM,
       2008)
                                                                         9
Overview : Current Status of Mechanization
•   Russia
     • Since 1990 decreasing number of machines/tractors
     • Insufficient compensation of aging machines/tractors
     • Production capacity of local industry not renewed – limited
       investments
     • Additional taxes for imported machines
     • Industry data: $2.23 billion and 100.000 employees
       (SoyuzAgromach, 2008)

•   India
     • Agriculture contributes 25 % to the GDP and more than one third of
        the population gains income from agriculture
     • Small scale farm operations (~ 1.5 ha) are predominant
     • Rapid increase in numbers of machines and of mechanization
        custom-hire services
     • Fast growing tractors production: from 2002/03 to 2007/08 the
        production capacity doubled to reach 364.205 units

                                                                            10
Overview : Current Status of Mechanization
•   Latin America/Brazil
     • The numbers of tractors per 1,000 ha are fairly constant over the last
        three decades and range at about 14 in 2003
     • A significant trend towards tractors of larger scale
     • Developing machinery manufacturing sector, mainly by international
        companies: sales turnover in 2007 = 3.0 billion US and nearly 41.000
        employee (AMIMAQ)
     • The production of bio-ethanol from sugarcane plays a very important
        role in Brazil which in turn may be a driver for accelerating demand for
        agricultural machinery

•   Japan
     • The agricultural sector has been diminishing in recent decades
       (agricultural land, the number of farm operations and population
       working in agriculture)
     • However, the sector is highly mechanized with about 461 tractors and
       237 harvesters per 1,000 ha.
     • Mostly small, sophisticated and specialized machines.
     • Further technical progress tends towards more automation
     • Strong industry with export to whole Asia and other regions of the
       world
                                                                                   11
Overview : Current Status of Mechanization
•   Sub-Saharan Africa
     • Land productivity is the lowest in the world. Average grain and
       maize yields range at about 1 ton/ha.
     • 80% of agricultural area cultivated with only human power
     • 5% of agricultural area with tractor - Average number of tractors per
       1000 ha is 1,3
     • 70% of tractors in South Africa and Nigeria
     • On large farms in the southern regions machines from Europe,
       North and South America
     • Increasing imports from India and China

•   North Africa / Middle East
     • The levels of mechanization are significantly higher than SSA. The
       average number of tractors per 1000 ha is 11. Large disparities can
       be observed in the region, for example:
         • in Morocco the number of tractors per 1.000 ha averages about
           6 and the number of harvesters 0.5
         • in Egypt the data observed are on average 30.70 tractors and
           0.79 harvesters per 1000 ha.

                                                                               12
4.1 Impact Factors
                                              Impact factors/drivers on
                                                 the demand of agr.
                                                   mechanization
Natural Conditions         Low (+/-)
                                                                   Economic Conditions               Strong (+/-)
Rainfall/ Precipitation    Low (+/-)
Temperature                Low (+/-)                               Technical progress                Strong (+)

Climate change             Low (+/-)                               Economic growth                   Strong (+)
                                                                   Oil price                         Strong (+/-)
                                                                   Economic crisis                   Strong (-)
          Political Conditions         Medium (+)
                                                                   Energy supply                     Med. (+/-)
          Food safety goals            Low (+)
          Education and training       Low (+)
          of farm operators                              Demographic Conditions         Med. (+/-)
          Research                     Low (+)           Population growth              Low (+)
          Subsidies                    Med. (-)          Excess of age in rural         Med. (-)
          Farm structure               Med. (+)          areas
                                                         Change in diets                Med. (+)
          development
                                                         Urbanization                   Med. (+/-)
          Biofuel production           Med. (+)
                                                                                                             13
4.1 Impact Factors: Economic Conditions
Parameter Based Assessment:
Economic
                      ITY   GER NEL        FIN     RUS   IND   BRA USA    Maj.
conditions
Technical                                                                strong
                      +4    +4     +3       +2     +1    +2     -   -
progress                                                                    +
Economic                                                                 strong
                      +2    +2     +4       +1     +3    +4    +3   -
growth                                                                      +
                                                                         strong
Oil price             -3    +3     -3      +2/-2   +4    -4    -3   -4
                                                                           +/-
                                                                         strong
Economic crisis       -4    -3     -4       -2     -1    -3    -3   -4
                                                                            -
                                                                         med.
Energy supply         -3    +3   +3/-3 +3/-3       -2    -3    +2   -2
                                                                          +/-

  (0) no impact             (-) negative
  (4) strong impact         (+) positive
                            (+/-) both
                                                                                  14
Cross Regional Predictions
Levels of mechanization: current and future trends

 Level   Farm power characteristic                     ITY     GER      NEL     FIN     RUS       IND   BRA   USA


   1     predominantly hand power

   2     significant use of draught animal power

   3     draught animal power predominant

   4     significant use of tractors

   5     tractors dominant

   6     fully motorised, technology level I

   7     fully motorised, technologies level II

   8     fully motorised, technology level III

   9     fully motorised, technology level VI

  10     fully motorised, technology level V

  11     moderate share of autonomous vehicles

  12     significant share of autonomous vehicles

                       current level                in up to 10 years         in up to 20 years

                                                                                                               15
Cross Regional Predictions
      Annual growth rate in %                          Imports                                  Exports                              Domestic demand


        10 year prediction          ITY GER NEL FIN           RUS     BRA   USA ITY GER NEL FIN RUS BRA USA ITY GER NEL FIN                     RUS     BRA       USA

small size tractors (up to 40
hp)                                  0      5     5      -       15    -     5   10   -    -      -       …   5     0      5    5     5    -    >17,5   10         0
medium size tractors (up to 100
hp)                                  5     -5     0     -5    >17,5    -     5   10   -5   -      -5      …   5     0      5    0     0    -5   >17,5    5         0
big size tractors (over 100 hp)      0      0     10     0    >17,5    -     0   10   5    -      0       …   5     5      5    5     10   0    >17,5    0         5
spare parts for tractors              -     0     5     -10      15    -     0   10   5    5      5       …   10    5      10   5     5    -5   >17,5   10         5
self propelled combines              0      5     0     -5    >17,5    -     0   5    5    -      5       …   -     5      5    -5    0    -5   >17,5    5         5
forage harvesters                    0      5     0      0       10    -     0   -    5    -      -       …   5    >17,5   0    0     0    5    >17,5    5         5
reapers                               -     -      -     -       -     -     0   0    -    -      -       …   -     5      -    -     -    -      -      -         5
threshers                             -     -      -     -       -     -     0   0    -    -      -       …   -     5      -    -     -    -      -      -         5
irrigation systems                   0      5     5     -5       5     -     0   5    0    0      -       …   5     10     5    5     5    -5    15     10         5
diesel engines                       5      5      -    -5       5     -     0   5    0    0      10      …   -     5      5    5     0    -5    10      5         5
power tillers                        0     -5     0      -       15    -     0   0    5    10     -       …   5    >17,5   0    -5    0    -    >17,5    0         5
food processing technique             -     0     5      0       15    -     0   -    0    5      0       …   -     5      -    0     0    0     …      15         5
spare parts in general               0      5     5      0       5     -     0   10   5    0      5       …   10    5      5    5     0    0     …      10         5
hand implements                      0      -      -     -       -     -     0   5    -    -      -       …   -     0      5    -     -    -      -      5         0
draught animal implements             -     -      -     -       -     -     -   -    -    -      -       …   -      -     -    -     -    -      -     -5         -
Other: non tillage equipment:                                                                                 10                                        10
( 5 ) predicted annual growth rate in % with a range of +/ - 2,5 % points
( - ) not relevant
(…) no statement
                                                                                                                                                             16
Cross Regional Predictions
                                  ITY   GER NEL FIN   RUS IND   BRA USA

Precision agriculture:
 - tillage                                             -

 - N-fertilizer application                            -                      Established in conventional production
 - other fertilizer application                        -

 - plant protection                                    -                      more than double of today's application

 - guidance systems                                    -

 - yield mapping                                       -                      Around double of today's application
Precision agriculture overall
driverless tractors                                                           Current application
fleet management (telematics)

smart implements                                                              Less than current application

ISOBUS                                                           -

remote diagnostics                                                            Not relevant

use of sensor technology
robotics                                                                  -   not applicable


                                                                                                                       17
Summary of Trends and Predictions
                                                 ITY                          GER                           NEL                            FIN

                                                                                       Developed industry
                                      Strong focus on medium       Emphasis on innovation        Places a high
Status                                                                                                                        Forecast is for a shrinking
                                      size tractors (40 to 100     and growing its export        importance of irrigation
                                                                                                                              domestic demand/ market
                                      hp)                          share                         technology

Factors that drive the demand for     Strong positive impacts are expected from technical progress, subsidies and biofuel production
agricultural mechanization            Strong negative impacts are expected from economic crisis

                                                                   Highest predicted levels
                                      Lowest predicted gains
                                                                   and reflects Germany‘s
Predictions on mechanization          compared to the other                                      Average predicted movement over the next few decades
                                                                   global position, use, and
levels over the next 10 to 20 years   Western European
                                                                   investment in agricultural
                                      countries
                                                                   mechanization
                                                                                                 Irrigation technology
                                                                                                                              Post-harvest technologies
Drivers of demand and the speed                                    Harvest technologies due      driven by the need to
                                      No informations given                                                                   (transport, logistics, storage
of agricultural mechanization                                      to innovation potential       captuire greater water
                                                                                                                              and drying)
                                                                                                 saving efficiencies

                                      Medium size tractors
                                                                   Big size tractors (over       The domestic demand
                                      (between 40 and 100
Expected growth rates of exports,                                  100 hp) are expected to       is predicted to grow as      The domestic demand is
                                      hp). Expects highest
imports and the domestic demand                                    see moderate growth in        well as the import for       predicted to shrink in almost
                                      annual growth rates
for agricultural machinery                                         exports and domestic          big size tractors (over      all machinery categories.
                                      exports and domestic
                                                                   demand.                       100 hp).
                                      demand.

                                      All countries are quite optimistic that the use of innovative agricultural technologies will double or even more than
Future application of innovative
                                      double up in the next 10 years compared to today´s application ( especially ISOBUS, sensor technology and
agricultural technologies
                                      precision agriculture).


                                                                                                                                                      18
Summary of Trends and Predictions
                                             USA                          RUS                              IND                          BRA

                                 Strong focus on              Low self-sufficiency in local   Rapidly developing             Net exporter of agricultrual
                                 innovation and growing the   production of agricultural      mechanization profile          machinery with a high level
Status                           export potential of the      machinery. Emphasis on          driven by a national subsidy   of importance placed on
                                 industry                     subsitence agriculture          programme                      ethanol fuel production

                                                              Low impact expected from
                                 Strong negative impact                                       Medium positive impacts
                                                              technical progress and
Factors that drive the demand    from oil price and strong                                    expected from climate          Strong positive impact
                                                              negative impact from
for agricultural mechanization   positive impact from                                         change. Subsidies will help    expected from bio-fuels
                                                              adverse economic
                                 subsidies                                                    drive mechanization
                                                              conditions
                                 Fully motorized with a                                       Classifies itself as tractor
Predictions on mechanization                                  Russia expects to be fully
                                 project trend towards                                        dominant with expected
levels over the next 10 to 20                                 motorized (over 75% of                                         Fully motorized Level V
                                 moderate use of                                              tractor usage rates around
years                                                         cultivation area)
                                 autonomous vehicles                                          75% of cultivation areas
                                                                                              Driver of mechanization
Drivers of demand and the        Plant genetics, plant        Predicted speed of
                                                                                              process is expected in the     High demand expected in
speed of agricultural            protection, and fertilizer   development is much lower
                                                                                              harvesting and processing      post harvest technologies
mechanization                    application technologies     than predicted demand
                                                                                              technologies
                                 Domestic demand is                                                                          High annual growth rates
Expected growth rates of                                      Highest growth rates will be    We expect continuous and
                                 expected in almost all                                                                      expected in almost all
exports, imports and the                                      in imports and in the           increasing exports of
                                 machinery categories. High                                                                  machinery categories for
domestic demand for                                           domestic demand for all         tractors and implements to
                                 export growth in forage                                                                     export and favourable
agricultural machinery                                        machinery categories            Africa
                                 harvesters                                                                                  domestic demand profile.
                                                              Innovative agricultural
                                 Most futuristic view with                                    Precision farming is not       Optimistic in automation
Future application of                                         technologies are not
                                 predictions of moderate                                      expected to play any           technologies and the
innovative agricultural                                       expected to paly any
                                 adoption of robotics and                                     signifcant role in India‘s     application of precision
technologies                                                  significant role in Russia‘s
                                 driverless vehicles                                          agriculture                    farming technologies
                                                              agriculture


                                                                                                                                                 19
Summary of Trends and Predictions

         W                                                                     • According to current
         ^
                                                                                 statistics, the total African
                                                                                 tractor fleet comprises almost
         
                                                                                 0,5 million units
         ^
         d                                                                     • But limited information is
                                                                                known about their age and
                                                                                 condition
                          Hand     Draught animals        Tractors
                                                                               • With the food crisis and the
     Africa (east)               50                  32            17
                                                                                 new interest in revitalizing the
   Africa (south)                54              21               25             agricultural sector in Africa,
    Africa (west)
                                                                                 mechanization is expected to
                                      70                     22         8
                                                                                 attract major investments
  Africa (central)                         85                      11 4
                                                                               • Major imports from India and
                     0%      20%       40%      60%         80%         100%
                                                                                 China
Figure: Agricultural power sources in africa
(Source: Clarke et al. 2002, Mrema et al. 2008; changed, own illustration)

                                                                                                               20
Conclusions - Future trends

(1) Developing economies
         The political and economical challenges need to be resolved by setting-up
         a pro-growth environment for the agricultural machinery industry.
         Current changes in policy towards agriculture may lead to investment in
         mechanization , thus increasing demand for agricultural machinery.


(2) Transition economies
         Definite needs (imports) but insecure (economic) demand for
         agricultural        mechanization.
         Various barriers (e.g. property rights and structural dev., subsidies, etc).
         Potential growing markets.

(3) Developed economies
         Quantitative saturation of domestic markets.
         Future potentials in either export and /or innovative technologies.
         Major impacts from biofuel and irrigation development.

                                                                                        21
Testing and safety aspects
Developed countries

• Development of performance testing methods for
  the emerging mechanization technologies

• Development of safety testing procedures for the
  emerging mechanization technologies
Testing and safety aspects
Developing countries

• Introduce new measures to promote agricultural
  machinery testing
• Measures to promote safety of agricultural
  machinery among manufacturers and users
• Strengthen the institutional framework
Thank you for your
attention


                     24

Namal Samarakoon -

  • 1.
    World evolution ofthe Agricultural Machinery Manufacturing Sector Presented by Dr. Namal Samarakoon Industrial Development Officer Agri-Business Development Branch United Nations Industrial Development Organization, Vienna, Austria 1
  • 2.
    Outline • Major Challengesfor Agriculture • Analytical Framework Main Geographical Regions Data Sources and their Limitations • General Overview of Agricultural Mechanization in Different Regions of the World • Future Trends and Evolution of Agricultural Mechanization • Safety Aspects • Conclusions 2
  • 3.
    1. Major Challengesfor Agriculture Climate Change - temperature increase - rainfall changes - weather uncertainties Agriculture Demographic Factors - growing world population - urbanization and industrialization - changing diets Political / Economical Conditions - economic farm sizes - subsidies and support policy - infrastructure and education Bio-based Products and Bio-energy - alternative sources for commodities - competition food, feed, fibre and fuel - finite nature of crude oil and natural gas 3
  • 4.
    From 1960 to2005 the world population From 1950 to 2005 the land per capita has has increased by almost 260 % decreased approximately by 50 % World population development (FAO) Development of the arable land per capita for different regions of the world (FAO) 4
  • 5.
    ...but yields perha have adapted over time to meet the challenge • On specialized farms the labour productivity can reach nearly 1 000 t of cereals per worker • In comparison, agriculture without motorization and without chemical application, the productivity is more than 500 times lower Cereal yield development in different regions of the world (FAO) 5
  • 6.
    Different Agro-climatic andTechnology Levels Yields of Main Crops 7 • Cereal yields are reflecting, t / ha 6 beside agro-climatic conditions, 5 also the overall development of cereals yield the farming systems: 4 Mechanization and other farm 3 inputs. 2 • Every region has its own 1 specific potential. 0 Asia Africa Eastern America America World Western Europe Europe South North figures of 2007, FAO 6
  • 7.
    2.1 Main GeographicalRegions 2 7 1 3 5 4 6 8 9 Map source: University of Texas Libraries http://lib.utexas.edu/maps/world_maps/txu-oclc-264266980-world_pol_2008-2.jpg 7
  • 8.
    Source of Dataand their Limitations (1) Literature review and statistical data: Predominantly UN data (FAO and UNIDO) and manufacturer association sources (2) Questionnaire survey: Sample of agricultural machinery manufacturer associations worldwide Questionnaire sought feedback on the following seven (7) issues: • Impact Factors • Mechanization Levels • Cropping Systems, • Future Annual Growth Estimates • Selected Agricultural Related Issues • Machinery Technologies and Trends, • Additional Comments 8
  • 9.
    Overview : CurrentStatus of Mechanization • Europe/EU • High numbers of machines per ha reflect over mechanization and great variety of farm structures • Tendency to fewer and higher powered machines • Strong industry with high rate of export • Industry data: 28 billion € production value; 135.000 employees • USA • Completely mechanized farms • Trend towards larger, higher horsepower equipment • Further technical progress tends towards automation • Industry data: $32 billion in revenue; 250.000 employees (AEM, 2008) 9
  • 10.
    Overview : CurrentStatus of Mechanization • Russia • Since 1990 decreasing number of machines/tractors • Insufficient compensation of aging machines/tractors • Production capacity of local industry not renewed – limited investments • Additional taxes for imported machines • Industry data: $2.23 billion and 100.000 employees (SoyuzAgromach, 2008) • India • Agriculture contributes 25 % to the GDP and more than one third of the population gains income from agriculture • Small scale farm operations (~ 1.5 ha) are predominant • Rapid increase in numbers of machines and of mechanization custom-hire services • Fast growing tractors production: from 2002/03 to 2007/08 the production capacity doubled to reach 364.205 units 10
  • 11.
    Overview : CurrentStatus of Mechanization • Latin America/Brazil • The numbers of tractors per 1,000 ha are fairly constant over the last three decades and range at about 14 in 2003 • A significant trend towards tractors of larger scale • Developing machinery manufacturing sector, mainly by international companies: sales turnover in 2007 = 3.0 billion US and nearly 41.000 employee (AMIMAQ) • The production of bio-ethanol from sugarcane plays a very important role in Brazil which in turn may be a driver for accelerating demand for agricultural machinery • Japan • The agricultural sector has been diminishing in recent decades (agricultural land, the number of farm operations and population working in agriculture) • However, the sector is highly mechanized with about 461 tractors and 237 harvesters per 1,000 ha. • Mostly small, sophisticated and specialized machines. • Further technical progress tends towards more automation • Strong industry with export to whole Asia and other regions of the world 11
  • 12.
    Overview : CurrentStatus of Mechanization • Sub-Saharan Africa • Land productivity is the lowest in the world. Average grain and maize yields range at about 1 ton/ha. • 80% of agricultural area cultivated with only human power • 5% of agricultural area with tractor - Average number of tractors per 1000 ha is 1,3 • 70% of tractors in South Africa and Nigeria • On large farms in the southern regions machines from Europe, North and South America • Increasing imports from India and China • North Africa / Middle East • The levels of mechanization are significantly higher than SSA. The average number of tractors per 1000 ha is 11. Large disparities can be observed in the region, for example: • in Morocco the number of tractors per 1.000 ha averages about 6 and the number of harvesters 0.5 • in Egypt the data observed are on average 30.70 tractors and 0.79 harvesters per 1000 ha. 12
  • 13.
    4.1 Impact Factors Impact factors/drivers on the demand of agr. mechanization Natural Conditions Low (+/-) Economic Conditions Strong (+/-) Rainfall/ Precipitation Low (+/-) Temperature Low (+/-) Technical progress Strong (+) Climate change Low (+/-) Economic growth Strong (+) Oil price Strong (+/-) Economic crisis Strong (-) Political Conditions Medium (+) Energy supply Med. (+/-) Food safety goals Low (+) Education and training Low (+) of farm operators Demographic Conditions Med. (+/-) Research Low (+) Population growth Low (+) Subsidies Med. (-) Excess of age in rural Med. (-) Farm structure Med. (+) areas Change in diets Med. (+) development Urbanization Med. (+/-) Biofuel production Med. (+) 13
  • 14.
    4.1 Impact Factors:Economic Conditions Parameter Based Assessment: Economic ITY GER NEL FIN RUS IND BRA USA Maj. conditions Technical strong +4 +4 +3 +2 +1 +2 - - progress + Economic strong +2 +2 +4 +1 +3 +4 +3 - growth + strong Oil price -3 +3 -3 +2/-2 +4 -4 -3 -4 +/- strong Economic crisis -4 -3 -4 -2 -1 -3 -3 -4 - med. Energy supply -3 +3 +3/-3 +3/-3 -2 -3 +2 -2 +/- (0) no impact (-) negative (4) strong impact (+) positive (+/-) both 14
  • 15.
    Cross Regional Predictions Levelsof mechanization: current and future trends Level Farm power characteristic ITY GER NEL FIN RUS IND BRA USA 1 predominantly hand power 2 significant use of draught animal power 3 draught animal power predominant 4 significant use of tractors 5 tractors dominant 6 fully motorised, technology level I 7 fully motorised, technologies level II 8 fully motorised, technology level III 9 fully motorised, technology level VI 10 fully motorised, technology level V 11 moderate share of autonomous vehicles 12 significant share of autonomous vehicles current level in up to 10 years in up to 20 years 15
  • 16.
    Cross Regional Predictions Annual growth rate in % Imports Exports Domestic demand 10 year prediction ITY GER NEL FIN RUS BRA USA ITY GER NEL FIN RUS BRA USA ITY GER NEL FIN RUS BRA USA small size tractors (up to 40 hp) 0 5 5 - 15 - 5 10 - - - … 5 0 5 5 5 - >17,5 10 0 medium size tractors (up to 100 hp) 5 -5 0 -5 >17,5 - 5 10 -5 - -5 … 5 0 5 0 0 -5 >17,5 5 0 big size tractors (over 100 hp) 0 0 10 0 >17,5 - 0 10 5 - 0 … 5 5 5 5 10 0 >17,5 0 5 spare parts for tractors - 0 5 -10 15 - 0 10 5 5 5 … 10 5 10 5 5 -5 >17,5 10 5 self propelled combines 0 5 0 -5 >17,5 - 0 5 5 - 5 … - 5 5 -5 0 -5 >17,5 5 5 forage harvesters 0 5 0 0 10 - 0 - 5 - - … 5 >17,5 0 0 0 5 >17,5 5 5 reapers - - - - - - 0 0 - - - … - 5 - - - - - - 5 threshers - - - - - - 0 0 - - - … - 5 - - - - - - 5 irrigation systems 0 5 5 -5 5 - 0 5 0 0 - … 5 10 5 5 5 -5 15 10 5 diesel engines 5 5 - -5 5 - 0 5 0 0 10 … - 5 5 5 0 -5 10 5 5 power tillers 0 -5 0 - 15 - 0 0 5 10 - … 5 >17,5 0 -5 0 - >17,5 0 5 food processing technique - 0 5 0 15 - 0 - 0 5 0 … - 5 - 0 0 0 … 15 5 spare parts in general 0 5 5 0 5 - 0 10 5 0 5 … 10 5 5 5 0 0 … 10 5 hand implements 0 - - - - - 0 5 - - - … - 0 5 - - - - 5 0 draught animal implements - - - - - - - - - - - … - - - - - - - -5 - Other: non tillage equipment: 10 10 ( 5 ) predicted annual growth rate in % with a range of +/ - 2,5 % points ( - ) not relevant (…) no statement 16
  • 17.
    Cross Regional Predictions ITY GER NEL FIN RUS IND BRA USA Precision agriculture: - tillage - - N-fertilizer application - Established in conventional production - other fertilizer application - - plant protection - more than double of today's application - guidance systems - - yield mapping - Around double of today's application Precision agriculture overall driverless tractors Current application fleet management (telematics) smart implements Less than current application ISOBUS - remote diagnostics Not relevant use of sensor technology robotics - not applicable 17
  • 18.
    Summary of Trendsand Predictions ITY GER NEL FIN Developed industry Strong focus on medium Emphasis on innovation Places a high Status Forecast is for a shrinking size tractors (40 to 100 and growing its export importance of irrigation domestic demand/ market hp) share technology Factors that drive the demand for Strong positive impacts are expected from technical progress, subsidies and biofuel production agricultural mechanization Strong negative impacts are expected from economic crisis Highest predicted levels Lowest predicted gains and reflects Germany‘s Predictions on mechanization compared to the other Average predicted movement over the next few decades global position, use, and levels over the next 10 to 20 years Western European investment in agricultural countries mechanization Irrigation technology Post-harvest technologies Drivers of demand and the speed Harvest technologies due driven by the need to No informations given (transport, logistics, storage of agricultural mechanization to innovation potential captuire greater water and drying) saving efficiencies Medium size tractors Big size tractors (over The domestic demand (between 40 and 100 Expected growth rates of exports, 100 hp) are expected to is predicted to grow as The domestic demand is hp). Expects highest imports and the domestic demand see moderate growth in well as the import for predicted to shrink in almost annual growth rates for agricultural machinery exports and domestic big size tractors (over all machinery categories. exports and domestic demand. 100 hp). demand. All countries are quite optimistic that the use of innovative agricultural technologies will double or even more than Future application of innovative double up in the next 10 years compared to today´s application ( especially ISOBUS, sensor technology and agricultural technologies precision agriculture). 18
  • 19.
    Summary of Trendsand Predictions USA RUS IND BRA Strong focus on Low self-sufficiency in local Rapidly developing Net exporter of agricultrual innovation and growing the production of agricultural mechanization profile machinery with a high level Status export potential of the machinery. Emphasis on driven by a national subsidy of importance placed on industry subsitence agriculture programme ethanol fuel production Low impact expected from Strong negative impact Medium positive impacts technical progress and Factors that drive the demand from oil price and strong expected from climate Strong positive impact negative impact from for agricultural mechanization positive impact from change. Subsidies will help expected from bio-fuels adverse economic subsidies drive mechanization conditions Fully motorized with a Classifies itself as tractor Predictions on mechanization Russia expects to be fully project trend towards dominant with expected levels over the next 10 to 20 motorized (over 75% of Fully motorized Level V moderate use of tractor usage rates around years cultivation area) autonomous vehicles 75% of cultivation areas Driver of mechanization Drivers of demand and the Plant genetics, plant Predicted speed of process is expected in the High demand expected in speed of agricultural protection, and fertilizer development is much lower harvesting and processing post harvest technologies mechanization application technologies than predicted demand technologies Domestic demand is High annual growth rates Expected growth rates of Highest growth rates will be We expect continuous and expected in almost all expected in almost all exports, imports and the in imports and in the increasing exports of machinery categories. High machinery categories for domestic demand for domestic demand for all tractors and implements to export growth in forage export and favourable agricultural machinery machinery categories Africa harvesters domestic demand profile. Innovative agricultural Most futuristic view with Precision farming is not Optimistic in automation Future application of technologies are not predictions of moderate expected to play any technologies and the innovative agricultural expected to paly any adoption of robotics and signifcant role in India‘s application of precision technologies significant role in Russia‘s driverless vehicles agriculture farming technologies agriculture 19
  • 20.
    Summary of Trendsand Predictions W • According to current ^ statistics, the total African tractor fleet comprises almost 0,5 million units ^ d • But limited information is known about their age and condition Hand Draught animals Tractors • With the food crisis and the Africa (east) 50 32 17 new interest in revitalizing the Africa (south) 54 21 25 agricultural sector in Africa, Africa (west) mechanization is expected to 70 22 8 attract major investments Africa (central) 85 11 4 • Major imports from India and 0% 20% 40% 60% 80% 100% China Figure: Agricultural power sources in africa (Source: Clarke et al. 2002, Mrema et al. 2008; changed, own illustration) 20
  • 21.
    Conclusions - Futuretrends (1) Developing economies The political and economical challenges need to be resolved by setting-up a pro-growth environment for the agricultural machinery industry. Current changes in policy towards agriculture may lead to investment in mechanization , thus increasing demand for agricultural machinery. (2) Transition economies Definite needs (imports) but insecure (economic) demand for agricultural mechanization. Various barriers (e.g. property rights and structural dev., subsidies, etc). Potential growing markets. (3) Developed economies Quantitative saturation of domestic markets. Future potentials in either export and /or innovative technologies. Major impacts from biofuel and irrigation development. 21
  • 22.
    Testing and safetyaspects Developed countries • Development of performance testing methods for the emerging mechanization technologies • Development of safety testing procedures for the emerging mechanization technologies
  • 23.
    Testing and safetyaspects Developing countries • Introduce new measures to promote agricultural machinery testing • Measures to promote safety of agricultural machinery among manufacturers and users • Strengthen the institutional framework
  • 24.
    Thank you foryour attention 24