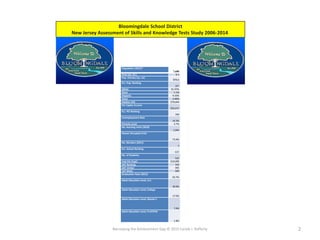
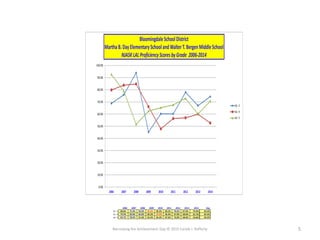
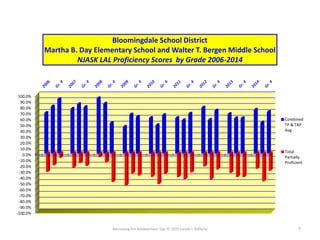
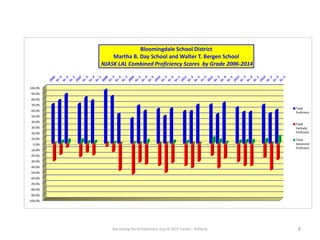
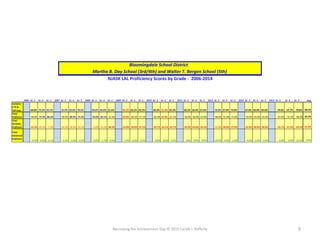
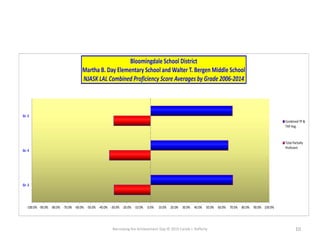
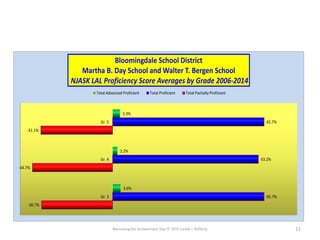
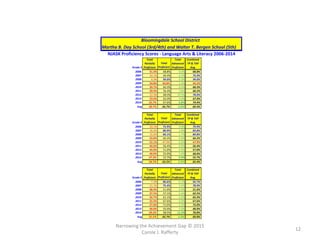
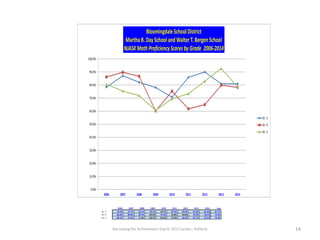
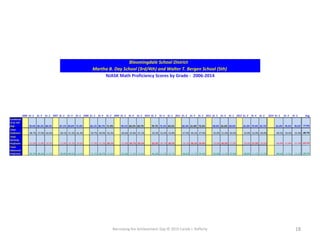
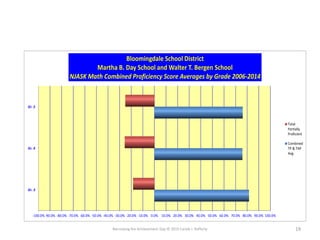
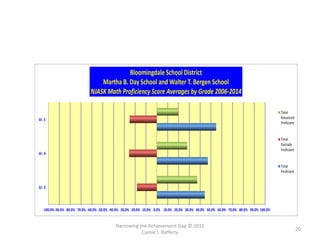
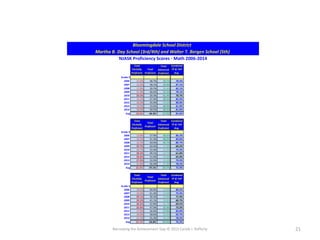
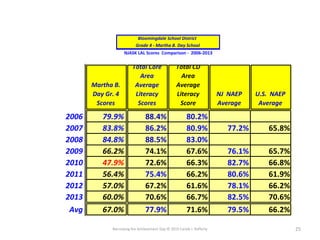
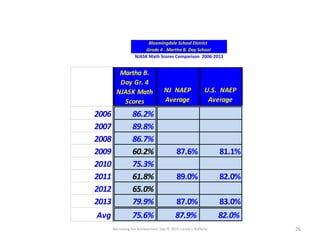
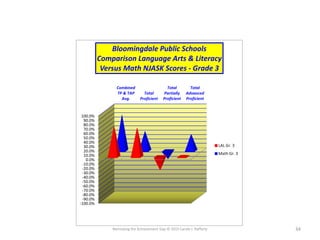
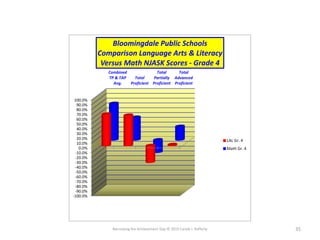
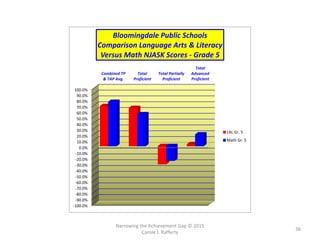
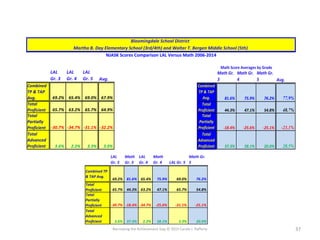
SlideShare a Scribd company logo
Narrowing the Achievement Gap © 2015 Carole J. Rafferty 1
Narrowing the Achievement Gap:
Bloomingdale
Common Core and The New Jersey Assessment
of Skills and Knowledge Test
Narrowing the Achievement Gap © 2015 Carole J. Rafferty 2
Bloomingdale School District
New Jersey Assessment of Skills and Knowledge Tests Study 2006-2014
Population (2012)*
7,688
Area (sq. mi.) 9.1
Pop. Density (sq. mi)
878.6
N.J. Pop. Ranking
297
White 91.97%
Black 1.1%
Hispanic 9.33%
Asian 2.46%
Median HHI $79,044
Per Capita Income
$32,417
N.J. PCI Ranking
300
Unemployment Rate
10.3%
Poverty Level 5.7%
No. Housing Units (2010)
3,089
Owner-Occupied Units
73.9%
No. Murders (2011)
1
N.J. School Ranking
635
No. of Students
522
Cost Per Pupil $19,099
SAT Ranking 143
SAT Verbal 495
SAT Math 505
Graduation Rate (2012)
92.7%
Adult Education Level, H.S.
39.9%
Adult Education Level, College
17.0%
Adult Education Level, Master’s
7.6%
Adult Education Level, Prof/PhD
1.8%
Narrowing the Achievement Gap © 2015 Carole J. Rafferty 3
Year
2006 2007 2008 2009 2010 2011 2012 2013 2014 2015 2016 2017 2018 2019 2020 2021 2022 2023 2024 2025 2026
Grade 3
3 4
3 4 5
3 4 5 6
3 4 5 6 7
3 4 5 6 7 8
3 4 5 6 7 8 9
3 4 5 6 7 8 9 10
3 4 5 6 7 8 9 10 11
3 4 5 6 7 8 9 10 11 12
3 4 5 6 7 8 9 10 11 12 13
3 4 5 6 7 8 9 10 11 12 13 14
3 4 5 6 7 8 9 10 11 12 13 14 15
3 4 5 6 7 8 9 10 11 12 13 14 15 16
3 4 5 6 7 8 9 10 11 12 13 14 15 16
3 4 5 6 7 8 9 10 11 12 13 14 15 16
3 4 5 6 7 8 9 10 11 12 13 14 15 16
3 4 5 6 7 8 9 10 11 12 13 14 15 16
3 4 5 6 7 8 9 10 11 12 13 14 15 16
3 4 5 6 7 8 9 10 11 12 13 14 15 16
3 4 5 6 7 8 9 10 11 12 13 14 15 16
4 5 6 7 8 9 10 11 12 13 14 15 16
5 6 7 8 9 10 11 12 13 14 15 16
6 7 8 9 10 11 12 13 14 15 16
7 8 9 10 11 12 13 14 15 16
8 9 10 11 12 13 14 15 16
9 10 11 12 13 14 15 16
10 11 12 13 14 15 16
11 12 13 14 15 16
12 13 14 15 16
13 14 15 16
14 15 16
15 16
16
CORE Study Grade Schedule
Narrowing the Achievement Gap © 2015 Carole J. Rafferty 4
Narrowing the Achievement Gap:
Bloomingdale
NJASK Language Arts & Literacy Scores
Grades 3 through 8
Narrowing the Achievement Gap © 2015 Carole J. Rafferty 5
0.0%
10.0%
20.0%
30.0%
40.0%
50.0%
60.0%
70.0%
80.0%
90.0%
100.0%
2006 2007 2008 2009 2010 2011 2012 2013 2014
BloomingdaleSchoolDistrict
MarthaB.DayElementarySchoolandWalterT.BergenMiddleSchool
NJASKLALProficiencyScoresbyGrade 2006-2014
Gr.3
Gr.4
Gr.5
2006 2007 2008 2009 2010 2011 2012 2013 2014 Avg
Gr. 3 68.8% 75.9% 94.0% 45.2% 60.3% 60.2% 78.0% 67.0% 74.4% 69.3%
Gr. 4 79.9% 83.8% 84.8% 66.2% 47.9% 56.4% 57.0% 60.0% 52.7% 65.4%
Gr. 5 92.7% 78.9% 51.6% 62.5% 65.3% 67.6% 73.0% 60.0% 70.8% 69.2%
Narrowing the Achievement Gap © 2015 Carole J. Rafferty 6
Total
Partially
Proficient
Total
Proficient
Total
Advanced
Proficient
Combined
TP & TAP
Avg.
School
Year &
Grade
2014
Gr. 3 25.7% 67.6% 6.8% 74.4%
Gr. 4 47.3% 52.7% 0.0% 52.7%
Gr. 5 29.2% 58.5% 12.3% 70.8%
2013
Gr. 3 33.0% 63.0% 4.0% 67.0%
Gr. 4 40.0% 55.0% 5.0% 60.0%
Gr. 5 40.0% 55.0% 5.0% 60.0%
2012
Gr. 3 22.0% 68.0% 10.0% 78.0%
Gr. 4 44.0% 51.0% 6.0% 57.0%
Gr. 5 27.0% 71.0% 2.0% 73.0%
2011
Gr. 3 39.9% 56.4% 3.8% 60.2%
Gr. 4 43.6% 56.4% 0.0% 56.4%
Gr. 5 32.4% 67.6% 0.0% 67.6%
2010
Gr. 3 39.7% 60.3% 0.0% 60.3%
Gr. 4 52.1% 47.9% 0.0% 47.9%
Gr. 5 34.7% 61.1% 4.2% 65.3%
2009
Gr. 3 54.8% 43.8% 1.4% 45.2%
Gr. 4 33.8% 66.2% 0.0% 66.2%
Gr. 5 37.5% 57.1% 5.4% 62.5%
2008
Gr. 3 6.0% 94.0% 0.0% 94.0%
Gr. 4 15.2% 83.1% 1.7% 84.8%
Gr. 5 48.4% 51.6% 0.0% 51.6%
2007
Gr. 3 24.1% 69.4% 6.5% 75.9%
Gr. 4 16.2% 80.9% 2.9% 83.8%
Gr. 5 21.1% 75.4% 3.5% 78.9%
2006
Gr. 3 31.3% 68.8% 0.0% 68.8%
Gr. 4 20.1% 75.9% 4.0% 79.9%
Gr. 5 7.3% 86.6% 6.1% 92.7%
and Walter T. Bergen Middle School (5th), Code 50
Martha B. Day Elementary School (3rd/4th), Code 30
Bloomingdale School District 0420 NJASK Scores
Language Arts & Literacy 2006-2014
Narrowing the Achievement Gap © 2015 Carole J. Rafferty 7
-100.0%
-90.0%
-80.0%
-70.0%
-60.0%
-50.0%
-40.0%
-30.0%
-20.0%
-10.0%
0.0%
10.0%
20.0%
30.0%
40.0%
50.0%
60.0%
70.0%
80.0%
90.0%
100.0%
Bloomingdale School District
Martha B. Day Elementary School and Walter T. Bergen Middle School
NJASK LAL Proficiency Scores by Grade 2006-2014
Combined
TP & TAP
Avg.
Total
Partially
Proficient
Narrowing the Achievement Gap © 2015 Carole J. Rafferty 8
-100.0%
-90.0%
-80.0%
-70.0%
-60.0%
-50.0%
-40.0%
-30.0%
-20.0%
-10.0%
0.0%
10.0%
20.0%
30.0%
40.0%
50.0%
60.0%
70.0%
80.0%
90.0%
100.0%
Bloomingdale School District
Martha B. Day School and Walter T. Bergen School
NJASK LAL Combined Proficiency Scores by Grade 2006-2014
Total
Proficient
Total
Partially
Proficient
Total
Advanced
Proficient
Narrowing the Achievement Gap © 2015 Carole J. Rafferty 9
2006 Gr. 3 Gr. 4 Gr. 5 2007 Gr. 3 Gr. 4 Gr. 5 2008 Gr. 3 Gr. 4 Gr. 5 2009 Gr. 3 Gr. 4 Gr. 5 2010 Gr. 3 Gr. 4 Gr. 5 2011 Gr. 3 Gr. 4 Gr. 5 2012 Gr. 3 Gr. 4 Gr. 5 2013 Gr. 3 Gr. 4 Gr. 5 2014 Gr. 3 Gr. 4 Gr. 5 Avg
Combine
d TP &
TAP Avg. 68.8% 79.9% 92.7% 75.9% 83.8% 78.9% 94.0% 84.8% 51.6% 45.2% 66.2% 62.5% 60.3% 47.9% 65.3% 60.2% 56.4% 67.6% 78.0% 57.0% 73.0% 67.0% 60.0% 60.0% 74.4% 52.7% 70.8% 68.2%
Total
Proficient 68.8% 75.9% 86.6% 69.4% 80.9% 75.4% 94.0% 83.1% 51.6% 43.8% 66.2% 57.1% 60.3% 47.9% 61.1% 56.4% 56.4% 67.6% 68.0% 51.0% 71.0% 63.0% 55.0% 55.0% 67.6% 52.7% 58.5% 65.2%
Total
Partially
Proficient -31.3% -20.1% -7.3% -24.1% -16.2% -21.1% -6.0% -15.2% -48.4% -54.8% -33.8% -37.5% -39.7% -52.1% -34.7% -39.9% -43.6% -32.4% -22.0% -44.0% -27.0% -33.0% -40.0% -40.0% -25.7% -47.3% -29.2% -31.8%
Total
Advanced
Proficient
0.0% 4.0% 6.1% 6.5% 2.9% 3.5% 0.0% 1.7% 0.0% 1.4% 0.0% 5.4% 0.0% 0.0% 4.2% 3.8% 0.0% 0.0% 10.0% 6.0% 2.0% 4.0% 5.0% 5.0% 6.8% 0.0% 12.3% 3.0%
Martha B. Day School (3rd/4th) and Walter T. Bergen School (5th)
Bloomingdale School District
NJASK LAL Proficiency Scores by Grade - 2006-2014
Narrowing the Achievement Gap © 2015 Carole J. Rafferty 10
-100.0% -90.0% -80.0% -70.0% -60.0% -50.0% -40.0% -30.0% -20.0% -10.0% 0.0% 10.0% 20.0% 30.0% 40.0% 50.0% 60.0% 70.0% 80.0% 90.0% 100.0%
Gr. 3
Gr. 4
Gr. 5
Bloomingdale School District
Martha B. Day Elementary School and Walter T. Bergen Middle School
NJASK LAL Combined Proficiency Score Averages by Grade 2006-2014
Combined TP &
TAP Avg.
Total Partially
Proficient
Narrowing the Achievement Gap © 2015 Carole J. Rafferty 11
Gr. 3
Gr. 4
Gr. 5
-30.7%
-34.7%
-31.1%
65.7%
63.2%
65.7%
3.6%
2.2%
3.3%
Bloomingdale School District
Martha B. Day School and Walter T. Bergen School
NJASK LAL Proficiency Score Averages by Grade 2006-2014
Total Advanced Proficient Total Proficient Total Partially Proficient
Narrowing the Achievement Gap © 2015
Carole J. Rafferty
12
Martha B. Day School (3rd/4th) and Walter T. Bergen School (5th)
Bloomingdale School District
NJASK Proficiency Scores - Language Arts & Literacy 2006-2014
Grade 3
Total
Partially
Proficient
Total
Proficient
Total
Advanced
Proficient
Combined
TP & TAP
Avg.
2006 31.3% 68.8% 0.0% 68.8%
2007 24.1% 69.4% 6.5% 75.9%
2008 6.0% 94.0% 0.0% 94.0%
2009 54.8% 43.8% 1.4% 45.2%
2010 39.7% 60.3% 0.0% 60.3%
2011 39.9% 56.4% 3.8% 60.2%
2012 22.0% 68.0% 10.0% 78.0%
2013 33.0% 63.0% 4.0% 67.0%
2014 25.7% 67.6% 6.8% 74.4%
Avg 30.7% 65.7% 3.6% 69.3%
Grade 4
Total
Partially
Proficient
Total
Proficient
Total
Advanced
Proficient
Combined
TP & TAP
Avg.
2006 20.1% 75.9% 4.0% 79.9%
2007 16.2% 80.9% 2.9% 83.8%
2008 15.2% 83.1% 1.7% 84.8%
2009 33.8% 66.2% 0.0% 66.2%
2010 52.1% 47.9% 0.0% 47.9%
2011 43.6% 56.4% 0.0% 56.4%
2012 44.0% 51.0% 6.0% 57.0%
2013 40.0% 55.0% 5.0% 60.0%
2014 47.3% 52.7% 0.0% 52.7%
Avg 34.7% 63.2% 2.2% 65.4%
Grade 5
Total
Partially
Proficient
Total
Proficient
Total
Advanced
Proficient
Combined
TP & TAP
Avg.
2006 7.3% 86.6% 6.1% 92.7%
2007 21.1% 75.4% 3.5% 78.9%
2008 48.4% 51.6% 0.0% 51.6%
2009 37.5% 57.1% 5.4% 62.5%
2010 34.7% 61.1% 4.2% 65.3%
2011 32.4% 67.6% 0.0% 67.6%
2012 27.0% 71.0% 2.0% 73.0%
2013 40.0% 55.0% 5.0% 60.0%
2014 29.2% 58.5% 12.3% 70.8%
Avg 31.1% 65.7% 3.3% 69.0%
Narrowing the Achievement Gap © 2015
Carole J. Rafferty
13
NAG – Bloomingdale School District
NJASK Math Scores Grades 3 through 8
Narrowing the Achievement Gap © 2015 Carole J. Rafferty 14
0.0%
10.0%
20.0%
30.0%
40.0%
50.0%
60.0%
70.0%
80.0%
90.0%
100.0%
2006 2007 2008 2009 2010 2011 2012 2013 2014
BloomingdaleSchoolDistrict
Martha B. Day Schooland WalterT. Bergen School
NJASKMath ProficiencyScoresby Grade 2006-2014
Gr. 3
Gr. 4
Gr. 5
2006 2007 2008 2009 2010 2011 2012 2013 2014 Avg
Gr. 3 78.4% 87.1% 82.1% 78.1% 70.7% 85.9% 90.0% 81.0% 81.0% 81.7%
Gr. 4 86.2% 89.8% 86.7% 60.2% 75.3% 61.8% 65.0% 79.9% 78.2% 75.6%
Gr. 5 80.5% 75.4% 71.9% 60.7% 69.5% 73.3% 83.0% 92.7% 78.5% 75.9%
Narrowing the Achievement Gap © 2015 Carole J. Rafferty 15
Bloomingdale School District 0420 NJASK Scores - Math 2006-2014
Martha B. Day School (3rd/4th) and Walter T. Bergen School (5th), Codes 30 and 50
Total
Partially
Proficient
Total
Proficient
Total
Advanced
Proficient
Combined TP
& TAP Avg.
School
Year &
Grade
2014
Gr. 3 18.9% 40.5% 40.5% 81.0%
Gr. 4 21.8% 56.4% 21.8% 78.2%
Gr. 5 21.5% 55.4% 23.1% 78.5%
2013
Gr. 3 19.0% 33.0% 48.0% 81.0%
Gr. 4 27.0% 52.0% 21.0% 79.9%
Gr. 5 19.0% 58.0% 23.0% 92.7%
2012
Gr. 3 10.0% 35.0% 55.0% 90.0%
Gr. 4 36.0% 51.0% 14.0% 65.0%
Gr. 5 17.0% 56.0% 27.0% 83.0%
2011
Gr. 3 14.1% 47.4% 38.5% 85.9%
Gr. 4 38.2% 49.1% 12.7% 61.8%
Gr. 5 26.8% 47.9% 25.4% 73.3%
2010
Gr. 3 29.3% 29.3% 41.4% 70.7%
Gr. 4 24.7% 53.4% 21.9% 75.3%
Gr. 5 30.5% 52.8% 16.7% 69.5%
2009
Gr. 3 21.9% 46.6% 31.5% 78.1%
Gr. 4 39.7% 42.6% 17.6% 60.2%
Gr. 5 39.3% 41.1% 19.6% 60.7%
2008
Gr. 3 17.9% 59.7% 22.4% 82.1%
Gr. 4 13.3% 40.0% 46.7% 86.7%
Gr. 5 28.1% 56.3% 15.6% 71.9%
2007
Gr. 3 12.9% 58.1% 29.0% 87.1%
Gr. 4 16.2% 41.3% 48.5% 89.8%
Gr. 5 24.6% 61.4% 14.0% 75.4%
2006
Gr. 3 21.6% 48.7% 29.7% 78.4%
Gr. 4 13.8% 37.9% 48.3% 86.2%
Gr. 5 19.5% 64.6% 15.9% 80.5%
Narrowing the Achievement Gap © 2015
Carole J. Rafferty
16
-100.0%
-90.0%
-80.0%
-70.0%
-60.0%
-50.0%
-40.0%
-30.0%
-20.0%
-10.0%
0.0%
10.0%
20.0%
30.0%
40.0%
50.0%
60.0%
70.0%
80.0%
90.0%
100.0%
Bloomingdale School District
Martha B. Day School and Walter T. Bergen School
NJASK Combined Math Proficiency Scores by Grade 2006-2014
Combined
TP & TAP
Avg.
Total
Partially
Proficient
Narrowing the Achievement Gap © 2015 Carole J. Rafferty 17
-100.0%
-90.0%
-80.0%
-70.0%
-60.0%
-50.0%
-40.0%
-30.0%
-20.0%
-10.0%
0.0%
10.0%
20.0%
30.0%
40.0%
50.0%
60.0%
70.0%
80.0%
90.0%
100.0%
Bloomingdale School District
Martha B. Day School and Walter T. Bergen School
NJASK Math Proficiency Scores by Grade 2006-2014
Total
Proficient
Total Partially
Proficient
Total
Advanced
Proficient
Narrowing the Achievement Gap © 2015 Carole J. Rafferty 18
Martha B. Day School (3rd/4th) and Walter T. Bergen School (5th)
Bloomingdale School District
NJASK Math Proficiency Scores by Grade - 2006-2014
2006 Gr. 3 Gr. 4 Gr. 5 2007 Gr. 3 Gr. 4 Gr. 5 2008 Gr. 3 Gr. 4 Gr. 5 2009 Gr. 3 Gr. 4 Gr. 5 2010 Gr. 3 Gr. 4 Gr. 5 2011 Gr. 3 Gr. 4 Gr. 5 2012 Gr. 3 Gr. 4 Gr. 5 2013 Gr. 3 Gr. 4 Gr. 5 2014 Gr. 3 Gr. 4 Gr. 5 Avg
Combined
TP & TAP
Avg. 78.4% 86.2% 80.5% 87.1% 89.8% 75.4% 82.1% 86.7% 71.9% 78.1% 60.2% 60.7% 70.7% 75.3% 69.5% 85.9% 61.8% 73.3% 90.0% 65.0% 83.0% 81.0% 79.9% 92.7% 81.0% 78.2% 78.5% 77.9%
Total
Proficient 48.7% 37.9% 64.6% 58.1% 41.3% 61.4% 59.7% 40.0% 56.3% 46.6% 42.6% 41.1% 29.3% 53.4% 52.8% 47.4% 49.1% 47.9% 35.0% 51.0% 56.0% 33.0% 52.0% 58.0% 40.5% 56.4% 55.4% 48.7%
Total
Partially
Proficient -21.6% -13.8% -19.5% -12.9% -16.2% -24.6% -17.9% -13.3% -28.1% -21.9% -39.7% -39.3% -29.3% -24.7% -30.5% -14.1% -38.2% -26.8% -10.0% -36.0% -17.0% -19.0% -27.0% -19.0% -18.9% -21.8% -21.5% -23.1%
Total
Advanced
Proficient 29.7% 48.3% 15.9% 29.0% 48.5% 14.0% 22.4% 46.7% 15.6% 31.5% 17.6% 19.6% 41.4% 21.9% 16.7% 38.5% 12.7% 25.4% 55.0% 14.0% 27.0% 48.0% 21.0% 23.0% 40.5% 21.8% 23.1% 28.5%
Narrowing the Achievement Gap © 2015 Carole J. Rafferty 19
-100.0%-90.0% -80.0% -70.0% -60.0% -50.0% -40.0% -30.0% -20.0% -10.0% 0.0% 10.0% 20.0% 30.0% 40.0% 50.0% 60.0% 70.0% 80.0% 90.0% 100.0%
Gr. 3
Gr. 4
Gr. 5
Bloomingdale School District
Martha B. Day School and Walter T. Bergen School
NJASK Math Combined Proficiency Score Averages by Grade 2006-2014
Total
Partially
Proficient
Combined
TP & TAP
Avg.
Narrowing the Achievement Gap © 2015
Carole J. Rafferty
20
-100.0%-90.0% -80.0% -70.0% -60.0% -50.0% -40.0% -30.0% -20.0% -10.0% 0.0% 10.0% 20.0% 30.0% 40.0% 50.0% 60.0% 70.0% 80.0% 90.0% 100.0%
Gr. 3
Gr. 4
Gr. 5
Bloomingdale School District
Martha B. Day School and Walter T. Bergen School
NJASK Math Proficiency Score Averages by Grade 2006-2014
Total
Advanced
Proficient
Total
Partially
Proficient
Total
Proficient
Narrowing the Achievement Gap © 2015 Carole J. Rafferty 21
Martha B. Day School (3rd/4th) and Walter T. Bergen School (5th)
Bloomingdale School District
NJASK Proficiency Scores - Math 2006-2014
Total
Partially
Proficient
Total
Proficient
Total
Advanced
Proficient
Combined
TP & TAP
Avg.
Grade 3
2006 21.6% 48.7% 29.7% 78.4%
2007 12.9% 58.1% 29.0% 87.1%
2008 17.9% 59.7% 22.4% 82.1%
2009 21.9% 46.6% 31.5% 78.1%
2010 29.3% 29.3% 41.4% 70.7%
2011 14.1% 47.4% 38.5% 85.9%
2012 10.0% 35.0% 55.0% 90.0%
2013 19.0% 33.0% 48.0% 81.0%
2014 18.9% 40.5% 40.5% 81.0%
Avg 18.4% 44.3% 37.3% 81.6%
Total
Partially
Proficient
Total
Proficient
Total
Advanced
Proficient
Combined
TP & TAP
Avg.
Grade 4
2006 13.8% 37.9% 48.3% 86.2%
2007 16.2% 41.3% 48.5% 89.8%
2008 13.3% 40.0% 46.7% 86.7%
2009 39.7% 42.6% 17.6% 60.2%
2010 24.7% 53.4% 21.9% 75.3%
2011 38.2% 49.1% 12.7% 61.8%
2012 36.0% 51.0% 14.0% 65.0%
2013 27.0% 52.0% 21.0% 79.9%
2014 21.8% 56.4% 21.8% 78.2%
Avg 25.6% 47.1% 28.1% 75.9%
Total
Partially
Proficient
Total
Proficient
Total
Advanced
Proficient
Combined
TP & TAP
Avg.
Grade 5
2006 19.5% 64.6% 15.9% 80.5%
2007 24.6% 61.4% 14.0% 75.4%
2008 28.1% 56.3% 15.6% 71.9%
2009 39.3% 41.1% 19.6% 60.7%
2010 30.5% 52.8% 16.7% 69.5%
2011 26.8% 47.9% 25.4% 73.3%
2012 17.0% 56.0% 27.0% 83.0%
2013 19.0% 58.0% 23.0% 92.7%
2014 21.5% 55.4% 23.1% 78.5%
Avg 25.1% 54.8% 20.0% 76.2%
Narrowing the Achievement Gap © 2015
Carole J. Rafferty
22
NAG – Bloomingdale School District
Comparison Data
Narrowing the Achievement Gap © 2015 Carole J. Rafferty 23
0.0%
10.0%
20.0%
30.0%
40.0%
50.0%
60.0%
70.0%
80.0%
90.0%
100.0%
20132012201120102009200820072006
Bloomingdale School District
Grade 4 NJASK LAL Scores Comparison
Martha B. Day
E.S. Gr. 4 NJASK
LAL Scores
NJ NAEP
Average
Narrowing the Achievement Gap © 2015 Carole J. Rafferty 24
0.0%
10.0%
20.0%
30.0%
40.0%
50.0%
60.0%
70.0%
80.0%
90.0%
100.0%
2006 2007 2008 2009 2010 2011 2012 2013
Bloomingdale School District
Grade 4 NJASK Math Score Comparison
Martha B. Day
Gr. 4 NJASK
Math Scores
NJ NAEP
Average
U.S. NAEP
Average
Narrowing the Achievement Gap © 2015 Carole J. Rafferty 25
Martha B.
Day Gr. 4
Scores
Total Core
Area
Average
Literacy
Scores
Total CD
Area
Average
Literacy
Score
NJ NAEP
Average
U.S. NAEP
Average
2006 79.9% 88.4% 80.2%
2007 83.8% 86.2% 80.9% 77.2% 65.8%
2008 84.8% 88.5% 83.0%
2009 66.2% 74.1% 67.6% 76.1% 65.7%
2010 47.9% 72.6% 66.3% 82.7% 66.8%
2011 56.4% 75.4% 66.2% 80.6% 61.9%
2012 57.0% 67.2% 61.6% 78.1% 66.2%
2013 60.0% 70.6% 66.7% 82.5% 70.6%
Avg 67.0% 77.9% 71.6% 79.5% 66.2%
NJASK LAL Scores Comparison - 2006-2013
Grade 4 - Martha B. Day School
Bloomingdale School District
Narrowing the Achievement Gap © 2015 Carole J. Rafferty 26
NJASK Math Scores Comparison 2006-2013
Grade 4 - Martha B. Day School
Bloomingdale School District
Martha B.
Day Gr. 4
NJASK Math
Scores
NJ NAEP
Average
U.S. NAEP
Average
2006 86.2%
2007 89.8%
2008 86.7%
2009 60.2% 87.6% 81.1%
2010 75.3%
2011 61.8% 89.0% 82.0%
2012 65.0%
2013 79.9% 87.0% 83.0%
Avg 75.6% 87.9% 82.0%
Narrowing the Achievement Gap © 2015 Carole J. Rafferty 27
0.0%
10.0%
20.0%
30.0%
40.0%
50.0%
60.0%
70.0%
80.0%
90.0%
100.0%
2006 2007 2008 2009 2010 2011
Bloomingdale School District
Martha B. Day Elementary School
Grade 4 NJASK LAL Score
0
10
20
30
40
50
60
70
80
2006 2007 2008 2009 2010 2011
Bloomingdale School District
Martha B. Day Elementary School
Grade 4 Enrollment 2006-2011
NJASK LAL Factor Comparison - 2006-2013
Grade 4 - Martha B. Day School
Bloomingdale School District
2006 2007 2008 2009 2010 2011 Avg.
Day School
Grade 4
NJASK LAL
Scores 88.4% 86.2% 88.5% 74.1% 72.6% 75.4% 80.9%
Martha B.
Day E.S.
Grade 4
Enrollment 28 67 58 69 74 55 58.5
Narrowing the Achievement Gap © 2015
Carole J. Rafferty
28
0.0%
10.0%
20.0%
30.0%
40.0%
50.0%
60.0%
70.0%
80.0%
90.0%
100.0%
2006 2007 2008 2009 2010 2011
Bloomingdale School District
Martha B. Day Elementary School
Grade 4 NJASK LAL Score
0.0
5.0
10.0
15.0
20.0
25.0
30.0
2006 2007 2008 2009 2010 2011
Bloomingdale School District
Martha B. Day Elementary School
Grade 4 Class Size 2006-2011
2006 2007 2008 2009 2010 2011 Avg.
Day School
Grade 4
NJASK LAL
Scores 88.4% 86.2% 88.5% 74.1% 72.6% 75.4% 80.9%
Martha B.
Day E.S.
Grade 4 Class
Size 14.0 16.8 19.3 23.0 24.7 18.3 19.4
NJASK LAL Factor Comparison - 2006-2013
Grade 4 - Martha B. Day School
Bloomingdale School District
Narrowing the Achievement Gap © 2015 Carole J. Rafferty 29
NJASK LAL Factor Comparison - 2006-2013
Grade 4 - Martha B. Day School
Bloomingdale School District
0.0%
10.0%
20.0%
30.0%
40.0%
50.0%
60.0%
70.0%
80.0%
90.0%
100.0%
2006 2007 2008 2009 2010 2011
Bloomingdale School District
Martha B. Day Elementary School
Grade 4 NJASK LAL Score
0.0%
10.0%
20.0%
30.0%
40.0%
50.0%
60.0%
70.0%
80.0%
90.0%
100.0%
2006 2007 2008 2009 2010 2011
Bloomingdale School District
Martha B.Day Elementary School
English Speakers 2006-2011
2006 2007 2008 2009 2010 2011 Avg.
Day School
Grade 4
NJASK LAL
Scores 88.4% 86.2% 88.5% 74.1% 72.6% 75.4% 80.9%
Martha B.
Day E.S.
English
Speakers 78.7% 98.5% 98.5% 80.9% 80.9% 100.0% 89.6%
Narrowing the Achievement Gap © 2015 Carole J. Rafferty 30
0.0%
10.0%
20.0%
30.0%
40.0%
50.0%
60.0%
70.0%
80.0%
90.0%
100.0%
2006 2007 2008 2009 2010 2011
Bloomingdale School District
Martha B. Day School
Grade 4 Average Math Score
2006 2007 2008 2009 2010 2011 Average
Martha B.
Day Gr. 4
NJASK Math
Scores 86.2% 89.8% 86.7% 60.2% 75.3% 61.8% 76.7%
Martha B.
Day School
Grade 4
Enrollment 28 67 58 69 74 55 58.5
Grade 4 - Martha B. Day School
Bloomingdale School District
NJASK Math Scores Factor Comparisons 2006-2013
0
10
20
30
40
50
60
70
80
2006 2007 2008 2009 2010 2011
Bloomingdale School District
Martha B. Day School Grade 4
Enrollment 2006-2011
Narrowing the Achievement Gap © 2015 Carole J. Rafferty 31
Grade 4 - Martha B. Day School
Bloomingdale School District
NJASK Math Scores Factor Comparisons 2006-2013
0.0%
10.0%
20.0%
30.0%
40.0%
50.0%
60.0%
70.0%
80.0%
90.0%
100.0%
2006 2007 2008 2009 2010 2011
Bloomingdale School District
Martha B. Day School
Grade 4 Average Math Score
2006 2007 2008 2009 2010 2011 Average
Martha B.
Day Gr. 4
NJASK Math
Scores 86.2% 89.8% 86.7% 60.2% 75.3% 61.8% 76.7%
Martha B.
Day School
Grade 4 Class
Size 14.0 16.8 19.3 23.0 24.7 18.3 19.4
0.0
5.0
10.0
15.0
20.0
25.0
30.0
2006 2007 2008 2009 2010 2011
Bloomingdale School District
Martha B. Day School
Grade 4 Class Size 2006-2011
Narrowing the Achievement Gap © 2015 Carole J. Rafferty 32
Grade 4 - Martha B. Day School
Bloomingdale School District
NJASK Math Scores Factor Comparisons 2006-2013
0.0%
10.0%
20.0%
30.0%
40.0%
50.0%
60.0%
70.0%
80.0%
90.0%
100.0%
2006 2007 2008 2009 2010 2011
Bloomingdale School District
Martha B. Day School
Grade 4 Average Math Score
0.0%
10.0%
20.0%
30.0%
40.0%
50.0%
60.0%
70.0%
80.0%
90.0%
100.0%
2006 2007 2008 2009 2010 2011
Bloomingdale School District
Martha B.Day School
English Speakers 2006-2011
2006 2007 2008 2009 2010 2011 Average
Martha B.
Day Gr. 4
NJASK Math
Scores 86.2% 89.8% 86.7% 60.2% 75.3% 61.8% 76.7%
Martha B.
Day School
English
Speakers 78.7% 98.5% 98.5% 80.9% 80.9% 100.0% 89.6%
Narrowing the Achievement Gap © 2015 Carole J. Rafferty 33
-100.0%
-90.0%
-80.0%
-70.0%
-60.0%
-50.0%
-40.0%
-30.0%
-20.0%
-10.0%
0.0%
10.0%
20.0%
30.0%
40.0%
50.0%
60.0%
70.0%
80.0%
90.0%
100.0%
Combined TP & TAP Avg. Total Proficient Total Partially Proficient Total Advanced Proficient
Bloomingdale Public School District
Language Arts & Literacy Versus Math NJASK Scores Comparison
LAL Avg.
Math Avg.
Narrowing the Achievement Gap © 2015 Carole J. Rafferty 34
-100.0%
-90.0%
-80.0%
-70.0%
-60.0%
-50.0%
-40.0%
-30.0%
-20.0%
-10.0%
0.0%
10.0%
20.0%
30.0%
40.0%
50.0%
60.0%
70.0%
80.0%
90.0%
100.0%
Combined
TP & TAP
Avg.
Total
Proficient
Total
Partially
Proficient
Total
Advanced
Proficient
Bloomingdale Public Schools
Comparison Language Arts & Literacy
Versus Math NJASK Scores - Grade 3
LAL Gr. 3
Math Gr. 3
Narrowing the Achievement Gap © 2015 Carole J. Rafferty 35
-100.0%
-90.0%
-80.0%
-70.0%
-60.0%
-50.0%
-40.0%
-30.0%
-20.0%
-10.0%
0.0%
10.0%
20.0%
30.0%
40.0%
50.0%
60.0%
70.0%
80.0%
90.0%
100.0%
Combined
TP & TAP
Avg.
Total
Proficient
Total
Partially
Proficient
Total
Advanced
Proficient
Bloomingdale Public Schools
Comparison Language Arts & Literacy
Versus Math NJASK Scores - Grade 4
LAL Gr. 4
Math Gr. 4
Narrowing the Achievement Gap © 2015
Carole J. Rafferty
36
-100.0%
-90.0%
-80.0%
-70.0%
-60.0%
-50.0%
-40.0%
-30.0%
-20.0%
-10.0%
0.0%
10.0%
20.0%
30.0%
40.0%
50.0%
60.0%
70.0%
80.0%
90.0%
100.0%
Combined TP
& TAP Avg.
Total
Proficient
Total Partially
Proficient
Total
Advanced
Proficient
Bloomingdale Public Schools
Comparison Language Arts & Literacy
Versus Math NJASK Scores - Grade 5
LAL Gr. 5
Math Gr. 5
Narrowing the Achievement Gap © 2015 Carole J. Rafferty 37
NJASK Scores Comparison LAL Versus Math 2006-2014
Martha B. Day Elementary School (3rd/4th) and Walter T. Bergen Middle School (5th)
Bloomingdale School District
LAL
Gr. 3
LAL
Gr. 4
LAL
Gr. 5 Avg.
Combined
TP & TAP
Avg. 69.2% 65.4% 69.0% 67.9%
Total
Proficient 65.7% 63.2% 65.7% 64.9%
Total
Partially
Proficient -30.7% -34.7% -31.1% -32.2%
Total
Advanced
Proficient 3.6% 2.2% 3.3% 3.0%
Math Gr.
3
Math Gr.
4
Math Gr.
5 Avg.
Combined
TP & TAP
Avg. 81.6% 75.9% 76.2% 77.9%
Total
Proficient 44.3% 47.1% 54.8% 48.7%
Total
Partially
Proficient -18.4% -25.6% -25.1% -23.1%
Total
Advanced
Proficient 37.3% 28.1% 20.0% 28.5%
Math Score Averages by Grade
LAL
Gr. 3
Math
Gr. 3
LAL
Gr. 4
Math
Gr. 4 LAL Gr. 5
Math Gr.
5
Combined TP
& TAP Avg.
69.2% 81.6% 65.4% 75.9% 69.0% 76.2%
Total
Proficient 65.7% 44.3% 63.2% 47.1% 65.7% 54.8%
Total
Partially
Proficient -30.7% -18.4% -34.7% -25.6% -31.1% -25.1%
Total
Advanced
Proficient 3.6% 37.3% 2.2% 28.1% 3.3% 20.0%
Narrowing the Achievement Gap © 2015
Carole J. Rafferty
38
NAG – Bloomingdale School District
Enrollment Comparison
Narrowing the Achievement Gap © 2015 Carole J. Rafferty 39
0
10
20
30
40
50
60
70
80
90
2006 2007 2008 2009 2010 2011 2012 2013
Bloomingdale School District
Enrollment 2006-2013
Grade 3
Grade 4
Grade 5
Narrowing the Achievement Gap © 2015 Carole J. Rafferty 40
Martha B. Day 030 Walter T. Bergen 050
Bloomingdale School District 0420 Enrollment 2006-2013
Grade 3 Grade 4 Grade 5 Total
2006 37 28 83 148
2007 59 67 53 179
2008 64 58 62 184
2009 74 69 56 199
2010 58 74 72 204
2011 78 55 70 203
2012 61 79 56 196
2013 57 63 75 195
Average 61 62 66 189
Median Change 20 35 -8 47
Percent 33% 57% -12% 25%
Narrowing the Achievement Gap © 2015 Carole J. Rafferty 41
0
25
50
75
100
125
150
175
200
225
2006 2007 2008 2009
2010
2011
2012
2013
Bloomingdale School District
Total Enrollment 3rd - 5th Grades
2006-2013
Narrowing the Achievement Gap © 2015 Carole J. Rafferty 42
NAG – Bloomingdale School District
Class Sizes Grades 3 through 5
Narrowing the Achievement Gap © 2015 Carole J. Rafferty 43
0.0
5.0
10.0
15.0
20.0
25.0
30.0
2006
2007
2008
2009
2010
2011
Bloomingdale School District
Class Size 2006-2011
Grade 3
Grade 4
Grade 5
Grade 3 Grade 4 Grade 5
2006 18.5 14.0 20.8
2007 14.8 16.8 13.3
2008 21.3 19.3 20.7
2009 24.7 23.0 18.7
2010 19.3 24.7 24.0
2011 26.0 18.3 23.3
2012
2013
Average 20.8 19.4 20.1
Narrowing the Achievement Gap © 2015 Carole J. Rafferty 44
NAG – Bloomingdale School District
English-Speaking Students
Narrowing the Achievement Gap © 2015 Carole J. Rafferty 45
0.0%
10.0%
20.0%
30.0%
40.0%
50.0%
60.0%
70.0%
80.0%
90.0%
100.0%
2006 2007 2008 2009 2010 2011 2012 2013
Bloomingdale School District
Percentage of English-Speaking Students
2006 2007 2008 2009 2010 2011 2012 2013
78.5% 98.8% 98.7% 78.2% 79.9% 94.0% 81.0% 81.7%
Narrowing the Achievement Gap © 2015 Carole J. Rafferty 46
NAG – Bloomingdale School District
SAT Scores
Narrowing the Achievement Gap © 2015 Carole J. Rafferty 47
Verbal SAT
Score
2013 495
2012 503
2011 498
2010 498
2009 507
2008 494
2007 488
2006 488
Butler H.S.
495
503
498498
507
494
488488
475
480
485
490
495
500
505
510
20132012201120102009200820072006
Butler High School
Verbal SAT Scores 2006-2013
Narrowing the Achievement Gap © 2015 Carole J. Rafferty 48
Math SAT
Score
2013 505
2012 501
2011 499
2010 487
2009 499
2008 499
2007 487
2006 497
Butler H.S.
501
499
487
499499
487
497
480
485
490
495
500
505
2012201120102009200820072006
Butler High School
Math SAT Scores 2006-2013
Narrowing the Achievement Gap © 2015
Carole J. Rafferty
49
NAG – Bloomingdale School District
Adult Resident Education Levels
Narrowing the Achievement Gap © 2015 Carole J. Rafferty 50
Bloomingdale School District
Adult Educational Level
39.9%
17.0%
7.6%
1.8%
Bloomingdale School District
Adult Educational Level
High School
College
Masters
Profl/Doctorate
Narrowing the Achievement Gap © 2015 Carole J. Rafferty 51
Adult
Education
Level Bloomingdale
High
School
39.9%
College
17.0%
Masters
7.6%
Profl/Doc
torate
1.8%
Bloomingdale School District
Adult Educational Level

More Related Content

Viewers also liked

World Programme for Human Rights Education: Outcomes of the Second Phase ABD...
World Programme for Human Rights Education: Outcomes of the Second PhaseABD...World Programme for Human Rights Education: Outcomes of the Second PhaseABD...
World Programme for Human Rights Education: Outcomes of the Second Phase ABD...
Naouel Abdellatif Mami
 
MEDICAMENTOS SÉCULO XIX
MEDICAMENTOS SÉCULO XIXMEDICAMENTOS SÉCULO XIX
MEDICAMENTOS SÉCULO XIX
Urano Andrade
 
Asp.Net Módulo3
Asp.Net  Módulo3Asp.Net  Módulo3
Asp.Net Módulo3michellobo
 
Ejercicio access+visualb
Ejercicio access+visualbEjercicio access+visualb
Ejercicio access+visualbvalen
 
Apresent Srh Minist Integ2
Apresent Srh Minist Integ2Apresent Srh Minist Integ2
Apresent Srh Minist Integ2marjarbas
 
Caso de estudio 10·aaron melendez
Caso de estudio 10·aaron melendezCaso de estudio 10·aaron melendez
Caso de estudio 10·aaron melendez
aliloinomedle
 
Meu pai 02/02/2011
Meu pai 02/02/2011Meu pai 02/02/2011
Meu pai 02/02/2011
Antonio Carneiro
 
Bloque de cierre patricia jácome
Bloque de cierre patricia jácomeBloque de cierre patricia jácome
Bloque de cierre patricia jácome
patricia jacome
 
Erasmus+ - International dimension
Erasmus+ - International dimensionErasmus+ - International dimension
Erasmus+ - International dimension
UNIMED - Mediterranean Universities Union
 
Untitled Presentation
Untitled PresentationUntitled Presentation
Untitled Presentationpaco7226
 
IHCPP AE G3 PPT
IHCPP AE G3 PPTIHCPP AE G3 PPT
IHCPP AE G3 PPT
Roberto Villarroel
 
Ejercitemonos2
Ejercitemonos2Ejercitemonos2
Ejercitemonos2
santiago echeverri
 
Patologia instersticial pulmonar
Patologia instersticial pulmonarPatologia instersticial pulmonar
Patologia instersticial pulmonar
Imagenes Haedo
 
A Oportunidade Forever
A Oportunidade ForeverA Oportunidade Forever
A Oportunidade Forever
Hielbert Ferreira
 
Presentacion
PresentacionPresentacion
Presentacionqueti
 
Ucp 600
Ucp 600Ucp 600
Ucp 600
Nazrul Prime
 

Viewers also liked (16)

World Programme for Human Rights Education: Outcomes of the Second Phase ABD...
World Programme for Human Rights Education: Outcomes of the Second PhaseABD...World Programme for Human Rights Education: Outcomes of the Second PhaseABD...
World Programme for Human Rights Education: Outcomes of the Second Phase ABD...
 
MEDICAMENTOS SÉCULO XIX
MEDICAMENTOS SÉCULO XIXMEDICAMENTOS SÉCULO XIX
MEDICAMENTOS SÉCULO XIX
 
Asp.Net Módulo3
Asp.Net  Módulo3Asp.Net  Módulo3
Asp.Net Módulo3
 
Ejercicio access+visualb
Ejercicio access+visualbEjercicio access+visualb
Ejercicio access+visualb
 
Apresent Srh Minist Integ2
Apresent Srh Minist Integ2Apresent Srh Minist Integ2
Apresent Srh Minist Integ2
 
Caso de estudio 10·aaron melendez
Caso de estudio 10·aaron melendezCaso de estudio 10·aaron melendez
Caso de estudio 10·aaron melendez
 
Meu pai 02/02/2011
Meu pai 02/02/2011Meu pai 02/02/2011
Meu pai 02/02/2011
 
Bloque de cierre patricia jácome
Bloque de cierre patricia jácomeBloque de cierre patricia jácome
Bloque de cierre patricia jácome
 
Erasmus+ - International dimension
Erasmus+ - International dimensionErasmus+ - International dimension
Erasmus+ - International dimension
 
Untitled Presentation
Untitled PresentationUntitled Presentation
Untitled Presentation
 
IHCPP AE G3 PPT
IHCPP AE G3 PPTIHCPP AE G3 PPT
IHCPP AE G3 PPT
 
Ejercitemonos2
Ejercitemonos2Ejercitemonos2
Ejercitemonos2
 
Patologia instersticial pulmonar
Patologia instersticial pulmonarPatologia instersticial pulmonar
Patologia instersticial pulmonar
 
A Oportunidade Forever
A Oportunidade ForeverA Oportunidade Forever
A Oportunidade Forever
 
Presentacion
PresentacionPresentacion
Presentacion
 
Ucp 600
Ucp 600Ucp 600
Ucp 600
 

Similar to NAG - Bloomingdale SD General Data

NAG - Jefferson Township SD General Data
NAG - Jefferson Township SD General DataNAG - Jefferson Township SD General Data
NAG - Jefferson Township SD General DataCarole Rafferty
 
NAG - Kinnelon SD Stony Brook ES
NAG - Kinnelon SD Stony Brook ESNAG - Kinnelon SD Stony Brook ES
NAG - Kinnelon SD Stony Brook ESCarole Rafferty
 
NAG - Jefferson Township SD JTMS
NAG - Jefferson Township SD JTMSNAG - Jefferson Township SD JTMS
NAG - Jefferson Township SD JTMSCarole Rafferty
 
NAG - Jefferson Township SD White Rock ES
NAG - Jefferson Township SD White Rock ESNAG - Jefferson Township SD White Rock ES
NAG - Jefferson Township SD White Rock ESCarole Rafferty
 
NAG - Jefferson Township SD Stanlick ES
NAG - Jefferson Township SD Stanlick ESNAG - Jefferson Township SD Stanlick ES
NAG - Jefferson Township SD Stanlick ESCarole Rafferty
 
2302_ESP_SOTP PPT_v3_347513yturdpaadaely1a0jhvpvg0k.pdf
2302_ESP_SOTP PPT_v3_347513yturdpaadaely1a0jhvpvg0k.pdf2302_ESP_SOTP PPT_v3_347513yturdpaadaely1a0jhvpvg0k.pdf
2302_ESP_SOTP PPT_v3_347513yturdpaadaely1a0jhvpvg0k.pdf
EducationNC
 
Powering Up Writing Grant Report
Powering Up Writing Grant ReportPowering Up Writing Grant Report
Powering Up Writing Grant Report
Dan Maas
 
9 26-13 sperreng academic achievement (map for moms and dads)
9 26-13 sperreng academic achievement (map for moms and dads)9 26-13 sperreng academic achievement (map for moms and dads)
9 26-13 sperreng academic achievement (map for moms and dads)Gemey McNabb
 
9 26-13 sperreng academic achievement (map for moms and dads)
9 26-13 sperreng academic achievement (map for moms and dads)9 26-13 sperreng academic achievement (map for moms and dads)
9 26-13 sperreng academic achievement (map for moms and dads)Gemey McNabb
 
9 26-13 sperreng academic achievement (map for moms and dads)
9 26-13 sperreng academic achievement (map for moms and dads)9 26-13 sperreng academic achievement (map for moms and dads)
9 26-13 sperreng academic achievement (map for moms and dads)Gemey McNabb
 
9- 27-12 MAP for moms and dads
9- 27-12 MAP for moms and dads9- 27-12 MAP for moms and dads
9- 27-12 MAP for moms and dadsGemey McNabb
 
9 -27-12 MAP for moms and dads
9 -27-12 MAP for moms and dads9 -27-12 MAP for moms and dads
9 -27-12 MAP for moms and dadsGemey McNabb
 
PUERTO ELEMENTARY SCHOOL SMEA FIRST QUARTER 2019
PUERTO ELEMENTARY SCHOOL SMEA FIRST QUARTER 2019PUERTO ELEMENTARY SCHOOL SMEA FIRST QUARTER 2019
PUERTO ELEMENTARY SCHOOL SMEA FIRST QUARTER 2019
ramildamiles1
 
PUERTO ELEMENTARY SCHOOL SECOND QUARTER
PUERTO ELEMENTARY SCHOOL SECOND QUARTER PUERTO ELEMENTARY SCHOOL SECOND QUARTER
PUERTO ELEMENTARY SCHOOL SECOND QUARTER
ramildamiles1
 
SAGAY-CITY-BE-LR-and-Continuity-Plan-2.pptx
SAGAY-CITY-BE-LR-and-Continuity-Plan-2.pptxSAGAY-CITY-BE-LR-and-Continuity-Plan-2.pptx
SAGAY-CITY-BE-LR-and-Continuity-Plan-2.pptx
ReyEnsepedo
 
H.G. Jin: AP Chinese Language and Culture: Current Developments and Best Prac...
H.G. Jin: AP Chinese Language and Culture: Current Developments and Best Prac...H.G. Jin: AP Chinese Language and Culture: Current Developments and Best Prac...
H.G. Jin: AP Chinese Language and Culture: Current Developments and Best Prac...
Center for Global Education at Asia Society
 
2008 2009 Student Achievement Report
2008 2009 Student Achievement Report2008 2009 Student Achievement Report
2008 2009 Student Achievement Report
Ike Haynes
 
Lake Bluff PARCC Report, with Benchmarks
Lake Bluff PARCC Report, with BenchmarksLake Bluff PARCC Report, with Benchmarks
Lake Bluff PARCC Report, with Benchmarks
justthefactswinnetka
 
002709_2009-2010_BUILD
002709_2009-2010_BUILD002709_2009-2010_BUILD
002709_2009-2010_BUILDStephen Fujii
 
Star report 2011 (w/out API
Star report 2011 (w/out APIStar report 2011 (w/out API
Star report 2011 (w/out APIbkissell
 

Similar to NAG - Bloomingdale SD General Data (20)

NAG - Jefferson Township SD General Data
NAG - Jefferson Township SD General DataNAG - Jefferson Township SD General Data
NAG - Jefferson Township SD General Data
 
NAG - Kinnelon SD Stony Brook ES
NAG - Kinnelon SD Stony Brook ESNAG - Kinnelon SD Stony Brook ES
NAG - Kinnelon SD Stony Brook ES
 
NAG - Jefferson Township SD JTMS
NAG - Jefferson Township SD JTMSNAG - Jefferson Township SD JTMS
NAG - Jefferson Township SD JTMS
 
NAG - Jefferson Township SD White Rock ES
NAG - Jefferson Township SD White Rock ESNAG - Jefferson Township SD White Rock ES
NAG - Jefferson Township SD White Rock ES
 
NAG - Jefferson Township SD Stanlick ES
NAG - Jefferson Township SD Stanlick ESNAG - Jefferson Township SD Stanlick ES
NAG - Jefferson Township SD Stanlick ES
 
2302_ESP_SOTP PPT_v3_347513yturdpaadaely1a0jhvpvg0k.pdf
2302_ESP_SOTP PPT_v3_347513yturdpaadaely1a0jhvpvg0k.pdf2302_ESP_SOTP PPT_v3_347513yturdpaadaely1a0jhvpvg0k.pdf
2302_ESP_SOTP PPT_v3_347513yturdpaadaely1a0jhvpvg0k.pdf
 
Powering Up Writing Grant Report
Powering Up Writing Grant ReportPowering Up Writing Grant Report
Powering Up Writing Grant Report
 
9 26-13 sperreng academic achievement (map for moms and dads)
9 26-13 sperreng academic achievement (map for moms and dads)9 26-13 sperreng academic achievement (map for moms and dads)
9 26-13 sperreng academic achievement (map for moms and dads)
 
9 26-13 sperreng academic achievement (map for moms and dads)
9 26-13 sperreng academic achievement (map for moms and dads)9 26-13 sperreng academic achievement (map for moms and dads)
9 26-13 sperreng academic achievement (map for moms and dads)
 
9 26-13 sperreng academic achievement (map for moms and dads)
9 26-13 sperreng academic achievement (map for moms and dads)9 26-13 sperreng academic achievement (map for moms and dads)
9 26-13 sperreng academic achievement (map for moms and dads)
 
9- 27-12 MAP for moms and dads
9- 27-12 MAP for moms and dads9- 27-12 MAP for moms and dads
9- 27-12 MAP for moms and dads
 
9 -27-12 MAP for moms and dads
9 -27-12 MAP for moms and dads9 -27-12 MAP for moms and dads
9 -27-12 MAP for moms and dads
 
PUERTO ELEMENTARY SCHOOL SMEA FIRST QUARTER 2019
PUERTO ELEMENTARY SCHOOL SMEA FIRST QUARTER 2019PUERTO ELEMENTARY SCHOOL SMEA FIRST QUARTER 2019
PUERTO ELEMENTARY SCHOOL SMEA FIRST QUARTER 2019
 
PUERTO ELEMENTARY SCHOOL SECOND QUARTER
PUERTO ELEMENTARY SCHOOL SECOND QUARTER PUERTO ELEMENTARY SCHOOL SECOND QUARTER
PUERTO ELEMENTARY SCHOOL SECOND QUARTER
 
SAGAY-CITY-BE-LR-and-Continuity-Plan-2.pptx
SAGAY-CITY-BE-LR-and-Continuity-Plan-2.pptxSAGAY-CITY-BE-LR-and-Continuity-Plan-2.pptx
SAGAY-CITY-BE-LR-and-Continuity-Plan-2.pptx
 
H.G. Jin: AP Chinese Language and Culture: Current Developments and Best Prac...
H.G. Jin: AP Chinese Language and Culture: Current Developments and Best Prac...H.G. Jin: AP Chinese Language and Culture: Current Developments and Best Prac...
H.G. Jin: AP Chinese Language and Culture: Current Developments and Best Prac...
 
2008 2009 Student Achievement Report
2008 2009 Student Achievement Report2008 2009 Student Achievement Report
2008 2009 Student Achievement Report
 
Lake Bluff PARCC Report, with Benchmarks
Lake Bluff PARCC Report, with BenchmarksLake Bluff PARCC Report, with Benchmarks
Lake Bluff PARCC Report, with Benchmarks
 
002709_2009-2010_BUILD
002709_2009-2010_BUILD002709_2009-2010_BUILD
002709_2009-2010_BUILD
 
Star report 2011 (w/out API
Star report 2011 (w/out APIStar report 2011 (w/out API
Star report 2011 (w/out API
 

NAG - Bloomingdale SD General Data

  • 1. Narrowing the Achievement Gap © 2015 Carole J. Rafferty 1 Narrowing the Achievement Gap: Bloomingdale Common Core and The New Jersey Assessment of Skills and Knowledge Test
  • 2. Narrowing the Achievement Gap © 2015 Carole J. Rafferty 2 Bloomingdale School District New Jersey Assessment of Skills and Knowledge Tests Study 2006-2014 Population (2012)* 7,688 Area (sq. mi.) 9.1 Pop. Density (sq. mi) 878.6 N.J. Pop. Ranking 297 White 91.97% Black 1.1% Hispanic 9.33% Asian 2.46% Median HHI $79,044 Per Capita Income $32,417 N.J. PCI Ranking 300 Unemployment Rate 10.3% Poverty Level 5.7% No. Housing Units (2010) 3,089 Owner-Occupied Units 73.9% No. Murders (2011) 1 N.J. School Ranking 635 No. of Students 522 Cost Per Pupil $19,099 SAT Ranking 143 SAT Verbal 495 SAT Math 505 Graduation Rate (2012) 92.7% Adult Education Level, H.S. 39.9% Adult Education Level, College 17.0% Adult Education Level, Master’s 7.6% Adult Education Level, Prof/PhD 1.8%
  • 3. Narrowing the Achievement Gap © 2015 Carole J. Rafferty 3 Year 2006 2007 2008 2009 2010 2011 2012 2013 2014 2015 2016 2017 2018 2019 2020 2021 2022 2023 2024 2025 2026 Grade 3 3 4 3 4 5 3 4 5 6 3 4 5 6 7 3 4 5 6 7 8 3 4 5 6 7 8 9 3 4 5 6 7 8 9 10 3 4 5 6 7 8 9 10 11 3 4 5 6 7 8 9 10 11 12 3 4 5 6 7 8 9 10 11 12 13 3 4 5 6 7 8 9 10 11 12 13 14 3 4 5 6 7 8 9 10 11 12 13 14 15 3 4 5 6 7 8 9 10 11 12 13 14 15 16 3 4 5 6 7 8 9 10 11 12 13 14 15 16 3 4 5 6 7 8 9 10 11 12 13 14 15 16 3 4 5 6 7 8 9 10 11 12 13 14 15 16 3 4 5 6 7 8 9 10 11 12 13 14 15 16 3 4 5 6 7 8 9 10 11 12 13 14 15 16 3 4 5 6 7 8 9 10 11 12 13 14 15 16 3 4 5 6 7 8 9 10 11 12 13 14 15 16 4 5 6 7 8 9 10 11 12 13 14 15 16 5 6 7 8 9 10 11 12 13 14 15 16 6 7 8 9 10 11 12 13 14 15 16 7 8 9 10 11 12 13 14 15 16 8 9 10 11 12 13 14 15 16 9 10 11 12 13 14 15 16 10 11 12 13 14 15 16 11 12 13 14 15 16 12 13 14 15 16 13 14 15 16 14 15 16 15 16 16 CORE Study Grade Schedule
  • 4. Narrowing the Achievement Gap © 2015 Carole J. Rafferty 4 Narrowing the Achievement Gap: Bloomingdale NJASK Language Arts & Literacy Scores Grades 3 through 8
  • 5. Narrowing the Achievement Gap © 2015 Carole J. Rafferty 5 0.0% 10.0% 20.0% 30.0% 40.0% 50.0% 60.0% 70.0% 80.0% 90.0% 100.0% 2006 2007 2008 2009 2010 2011 2012 2013 2014 BloomingdaleSchoolDistrict MarthaB.DayElementarySchoolandWalterT.BergenMiddleSchool NJASKLALProficiencyScoresbyGrade 2006-2014 Gr.3 Gr.4 Gr.5 2006 2007 2008 2009 2010 2011 2012 2013 2014 Avg Gr. 3 68.8% 75.9% 94.0% 45.2% 60.3% 60.2% 78.0% 67.0% 74.4% 69.3% Gr. 4 79.9% 83.8% 84.8% 66.2% 47.9% 56.4% 57.0% 60.0% 52.7% 65.4% Gr. 5 92.7% 78.9% 51.6% 62.5% 65.3% 67.6% 73.0% 60.0% 70.8% 69.2%
  • 6. Narrowing the Achievement Gap © 2015 Carole J. Rafferty 6 Total Partially Proficient Total Proficient Total Advanced Proficient Combined TP & TAP Avg. School Year & Grade 2014 Gr. 3 25.7% 67.6% 6.8% 74.4% Gr. 4 47.3% 52.7% 0.0% 52.7% Gr. 5 29.2% 58.5% 12.3% 70.8% 2013 Gr. 3 33.0% 63.0% 4.0% 67.0% Gr. 4 40.0% 55.0% 5.0% 60.0% Gr. 5 40.0% 55.0% 5.0% 60.0% 2012 Gr. 3 22.0% 68.0% 10.0% 78.0% Gr. 4 44.0% 51.0% 6.0% 57.0% Gr. 5 27.0% 71.0% 2.0% 73.0% 2011 Gr. 3 39.9% 56.4% 3.8% 60.2% Gr. 4 43.6% 56.4% 0.0% 56.4% Gr. 5 32.4% 67.6% 0.0% 67.6% 2010 Gr. 3 39.7% 60.3% 0.0% 60.3% Gr. 4 52.1% 47.9% 0.0% 47.9% Gr. 5 34.7% 61.1% 4.2% 65.3% 2009 Gr. 3 54.8% 43.8% 1.4% 45.2% Gr. 4 33.8% 66.2% 0.0% 66.2% Gr. 5 37.5% 57.1% 5.4% 62.5% 2008 Gr. 3 6.0% 94.0% 0.0% 94.0% Gr. 4 15.2% 83.1% 1.7% 84.8% Gr. 5 48.4% 51.6% 0.0% 51.6% 2007 Gr. 3 24.1% 69.4% 6.5% 75.9% Gr. 4 16.2% 80.9% 2.9% 83.8% Gr. 5 21.1% 75.4% 3.5% 78.9% 2006 Gr. 3 31.3% 68.8% 0.0% 68.8% Gr. 4 20.1% 75.9% 4.0% 79.9% Gr. 5 7.3% 86.6% 6.1% 92.7% and Walter T. Bergen Middle School (5th), Code 50 Martha B. Day Elementary School (3rd/4th), Code 30 Bloomingdale School District 0420 NJASK Scores Language Arts & Literacy 2006-2014
  • 7. Narrowing the Achievement Gap © 2015 Carole J. Rafferty 7 -100.0% -90.0% -80.0% -70.0% -60.0% -50.0% -40.0% -30.0% -20.0% -10.0% 0.0% 10.0% 20.0% 30.0% 40.0% 50.0% 60.0% 70.0% 80.0% 90.0% 100.0% Bloomingdale School District Martha B. Day Elementary School and Walter T. Bergen Middle School NJASK LAL Proficiency Scores by Grade 2006-2014 Combined TP & TAP Avg. Total Partially Proficient
  • 8. Narrowing the Achievement Gap © 2015 Carole J. Rafferty 8 -100.0% -90.0% -80.0% -70.0% -60.0% -50.0% -40.0% -30.0% -20.0% -10.0% 0.0% 10.0% 20.0% 30.0% 40.0% 50.0% 60.0% 70.0% 80.0% 90.0% 100.0% Bloomingdale School District Martha B. Day School and Walter T. Bergen School NJASK LAL Combined Proficiency Scores by Grade 2006-2014 Total Proficient Total Partially Proficient Total Advanced Proficient
  • 9. Narrowing the Achievement Gap © 2015 Carole J. Rafferty 9 2006 Gr. 3 Gr. 4 Gr. 5 2007 Gr. 3 Gr. 4 Gr. 5 2008 Gr. 3 Gr. 4 Gr. 5 2009 Gr. 3 Gr. 4 Gr. 5 2010 Gr. 3 Gr. 4 Gr. 5 2011 Gr. 3 Gr. 4 Gr. 5 2012 Gr. 3 Gr. 4 Gr. 5 2013 Gr. 3 Gr. 4 Gr. 5 2014 Gr. 3 Gr. 4 Gr. 5 Avg Combine d TP & TAP Avg. 68.8% 79.9% 92.7% 75.9% 83.8% 78.9% 94.0% 84.8% 51.6% 45.2% 66.2% 62.5% 60.3% 47.9% 65.3% 60.2% 56.4% 67.6% 78.0% 57.0% 73.0% 67.0% 60.0% 60.0% 74.4% 52.7% 70.8% 68.2% Total Proficient 68.8% 75.9% 86.6% 69.4% 80.9% 75.4% 94.0% 83.1% 51.6% 43.8% 66.2% 57.1% 60.3% 47.9% 61.1% 56.4% 56.4% 67.6% 68.0% 51.0% 71.0% 63.0% 55.0% 55.0% 67.6% 52.7% 58.5% 65.2% Total Partially Proficient -31.3% -20.1% -7.3% -24.1% -16.2% -21.1% -6.0% -15.2% -48.4% -54.8% -33.8% -37.5% -39.7% -52.1% -34.7% -39.9% -43.6% -32.4% -22.0% -44.0% -27.0% -33.0% -40.0% -40.0% -25.7% -47.3% -29.2% -31.8% Total Advanced Proficient 0.0% 4.0% 6.1% 6.5% 2.9% 3.5% 0.0% 1.7% 0.0% 1.4% 0.0% 5.4% 0.0% 0.0% 4.2% 3.8% 0.0% 0.0% 10.0% 6.0% 2.0% 4.0% 5.0% 5.0% 6.8% 0.0% 12.3% 3.0% Martha B. Day School (3rd/4th) and Walter T. Bergen School (5th) Bloomingdale School District NJASK LAL Proficiency Scores by Grade - 2006-2014
  • 10. Narrowing the Achievement Gap © 2015 Carole J. Rafferty 10 -100.0% -90.0% -80.0% -70.0% -60.0% -50.0% -40.0% -30.0% -20.0% -10.0% 0.0% 10.0% 20.0% 30.0% 40.0% 50.0% 60.0% 70.0% 80.0% 90.0% 100.0% Gr. 3 Gr. 4 Gr. 5 Bloomingdale School District Martha B. Day Elementary School and Walter T. Bergen Middle School NJASK LAL Combined Proficiency Score Averages by Grade 2006-2014 Combined TP & TAP Avg. Total Partially Proficient
  • 11. Narrowing the Achievement Gap © 2015 Carole J. Rafferty 11 Gr. 3 Gr. 4 Gr. 5 -30.7% -34.7% -31.1% 65.7% 63.2% 65.7% 3.6% 2.2% 3.3% Bloomingdale School District Martha B. Day School and Walter T. Bergen School NJASK LAL Proficiency Score Averages by Grade 2006-2014 Total Advanced Proficient Total Proficient Total Partially Proficient
  • 12. Narrowing the Achievement Gap © 2015 Carole J. Rafferty 12 Martha B. Day School (3rd/4th) and Walter T. Bergen School (5th) Bloomingdale School District NJASK Proficiency Scores - Language Arts & Literacy 2006-2014 Grade 3 Total Partially Proficient Total Proficient Total Advanced Proficient Combined TP & TAP Avg. 2006 31.3% 68.8% 0.0% 68.8% 2007 24.1% 69.4% 6.5% 75.9% 2008 6.0% 94.0% 0.0% 94.0% 2009 54.8% 43.8% 1.4% 45.2% 2010 39.7% 60.3% 0.0% 60.3% 2011 39.9% 56.4% 3.8% 60.2% 2012 22.0% 68.0% 10.0% 78.0% 2013 33.0% 63.0% 4.0% 67.0% 2014 25.7% 67.6% 6.8% 74.4% Avg 30.7% 65.7% 3.6% 69.3% Grade 4 Total Partially Proficient Total Proficient Total Advanced Proficient Combined TP & TAP Avg. 2006 20.1% 75.9% 4.0% 79.9% 2007 16.2% 80.9% 2.9% 83.8% 2008 15.2% 83.1% 1.7% 84.8% 2009 33.8% 66.2% 0.0% 66.2% 2010 52.1% 47.9% 0.0% 47.9% 2011 43.6% 56.4% 0.0% 56.4% 2012 44.0% 51.0% 6.0% 57.0% 2013 40.0% 55.0% 5.0% 60.0% 2014 47.3% 52.7% 0.0% 52.7% Avg 34.7% 63.2% 2.2% 65.4% Grade 5 Total Partially Proficient Total Proficient Total Advanced Proficient Combined TP & TAP Avg. 2006 7.3% 86.6% 6.1% 92.7% 2007 21.1% 75.4% 3.5% 78.9% 2008 48.4% 51.6% 0.0% 51.6% 2009 37.5% 57.1% 5.4% 62.5% 2010 34.7% 61.1% 4.2% 65.3% 2011 32.4% 67.6% 0.0% 67.6% 2012 27.0% 71.0% 2.0% 73.0% 2013 40.0% 55.0% 5.0% 60.0% 2014 29.2% 58.5% 12.3% 70.8% Avg 31.1% 65.7% 3.3% 69.0%
  • 13. Narrowing the Achievement Gap © 2015 Carole J. Rafferty 13 NAG – Bloomingdale School District NJASK Math Scores Grades 3 through 8
  • 14. Narrowing the Achievement Gap © 2015 Carole J. Rafferty 14 0.0% 10.0% 20.0% 30.0% 40.0% 50.0% 60.0% 70.0% 80.0% 90.0% 100.0% 2006 2007 2008 2009 2010 2011 2012 2013 2014 BloomingdaleSchoolDistrict Martha B. Day Schooland WalterT. Bergen School NJASKMath ProficiencyScoresby Grade 2006-2014 Gr. 3 Gr. 4 Gr. 5 2006 2007 2008 2009 2010 2011 2012 2013 2014 Avg Gr. 3 78.4% 87.1% 82.1% 78.1% 70.7% 85.9% 90.0% 81.0% 81.0% 81.7% Gr. 4 86.2% 89.8% 86.7% 60.2% 75.3% 61.8% 65.0% 79.9% 78.2% 75.6% Gr. 5 80.5% 75.4% 71.9% 60.7% 69.5% 73.3% 83.0% 92.7% 78.5% 75.9%
  • 15. Narrowing the Achievement Gap © 2015 Carole J. Rafferty 15 Bloomingdale School District 0420 NJASK Scores - Math 2006-2014 Martha B. Day School (3rd/4th) and Walter T. Bergen School (5th), Codes 30 and 50 Total Partially Proficient Total Proficient Total Advanced Proficient Combined TP & TAP Avg. School Year & Grade 2014 Gr. 3 18.9% 40.5% 40.5% 81.0% Gr. 4 21.8% 56.4% 21.8% 78.2% Gr. 5 21.5% 55.4% 23.1% 78.5% 2013 Gr. 3 19.0% 33.0% 48.0% 81.0% Gr. 4 27.0% 52.0% 21.0% 79.9% Gr. 5 19.0% 58.0% 23.0% 92.7% 2012 Gr. 3 10.0% 35.0% 55.0% 90.0% Gr. 4 36.0% 51.0% 14.0% 65.0% Gr. 5 17.0% 56.0% 27.0% 83.0% 2011 Gr. 3 14.1% 47.4% 38.5% 85.9% Gr. 4 38.2% 49.1% 12.7% 61.8% Gr. 5 26.8% 47.9% 25.4% 73.3% 2010 Gr. 3 29.3% 29.3% 41.4% 70.7% Gr. 4 24.7% 53.4% 21.9% 75.3% Gr. 5 30.5% 52.8% 16.7% 69.5% 2009 Gr. 3 21.9% 46.6% 31.5% 78.1% Gr. 4 39.7% 42.6% 17.6% 60.2% Gr. 5 39.3% 41.1% 19.6% 60.7% 2008 Gr. 3 17.9% 59.7% 22.4% 82.1% Gr. 4 13.3% 40.0% 46.7% 86.7% Gr. 5 28.1% 56.3% 15.6% 71.9% 2007 Gr. 3 12.9% 58.1% 29.0% 87.1% Gr. 4 16.2% 41.3% 48.5% 89.8% Gr. 5 24.6% 61.4% 14.0% 75.4% 2006 Gr. 3 21.6% 48.7% 29.7% 78.4% Gr. 4 13.8% 37.9% 48.3% 86.2% Gr. 5 19.5% 64.6% 15.9% 80.5%
  • 16. Narrowing the Achievement Gap © 2015 Carole J. Rafferty 16 -100.0% -90.0% -80.0% -70.0% -60.0% -50.0% -40.0% -30.0% -20.0% -10.0% 0.0% 10.0% 20.0% 30.0% 40.0% 50.0% 60.0% 70.0% 80.0% 90.0% 100.0% Bloomingdale School District Martha B. Day School and Walter T. Bergen School NJASK Combined Math Proficiency Scores by Grade 2006-2014 Combined TP & TAP Avg. Total Partially Proficient
  • 17. Narrowing the Achievement Gap © 2015 Carole J. Rafferty 17 -100.0% -90.0% -80.0% -70.0% -60.0% -50.0% -40.0% -30.0% -20.0% -10.0% 0.0% 10.0% 20.0% 30.0% 40.0% 50.0% 60.0% 70.0% 80.0% 90.0% 100.0% Bloomingdale School District Martha B. Day School and Walter T. Bergen School NJASK Math Proficiency Scores by Grade 2006-2014 Total Proficient Total Partially Proficient Total Advanced Proficient
  • 18. Narrowing the Achievement Gap © 2015 Carole J. Rafferty 18 Martha B. Day School (3rd/4th) and Walter T. Bergen School (5th) Bloomingdale School District NJASK Math Proficiency Scores by Grade - 2006-2014 2006 Gr. 3 Gr. 4 Gr. 5 2007 Gr. 3 Gr. 4 Gr. 5 2008 Gr. 3 Gr. 4 Gr. 5 2009 Gr. 3 Gr. 4 Gr. 5 2010 Gr. 3 Gr. 4 Gr. 5 2011 Gr. 3 Gr. 4 Gr. 5 2012 Gr. 3 Gr. 4 Gr. 5 2013 Gr. 3 Gr. 4 Gr. 5 2014 Gr. 3 Gr. 4 Gr. 5 Avg Combined TP & TAP Avg. 78.4% 86.2% 80.5% 87.1% 89.8% 75.4% 82.1% 86.7% 71.9% 78.1% 60.2% 60.7% 70.7% 75.3% 69.5% 85.9% 61.8% 73.3% 90.0% 65.0% 83.0% 81.0% 79.9% 92.7% 81.0% 78.2% 78.5% 77.9% Total Proficient 48.7% 37.9% 64.6% 58.1% 41.3% 61.4% 59.7% 40.0% 56.3% 46.6% 42.6% 41.1% 29.3% 53.4% 52.8% 47.4% 49.1% 47.9% 35.0% 51.0% 56.0% 33.0% 52.0% 58.0% 40.5% 56.4% 55.4% 48.7% Total Partially Proficient -21.6% -13.8% -19.5% -12.9% -16.2% -24.6% -17.9% -13.3% -28.1% -21.9% -39.7% -39.3% -29.3% -24.7% -30.5% -14.1% -38.2% -26.8% -10.0% -36.0% -17.0% -19.0% -27.0% -19.0% -18.9% -21.8% -21.5% -23.1% Total Advanced Proficient 29.7% 48.3% 15.9% 29.0% 48.5% 14.0% 22.4% 46.7% 15.6% 31.5% 17.6% 19.6% 41.4% 21.9% 16.7% 38.5% 12.7% 25.4% 55.0% 14.0% 27.0% 48.0% 21.0% 23.0% 40.5% 21.8% 23.1% 28.5%
  • 19. Narrowing the Achievement Gap © 2015 Carole J. Rafferty 19 -100.0%-90.0% -80.0% -70.0% -60.0% -50.0% -40.0% -30.0% -20.0% -10.0% 0.0% 10.0% 20.0% 30.0% 40.0% 50.0% 60.0% 70.0% 80.0% 90.0% 100.0% Gr. 3 Gr. 4 Gr. 5 Bloomingdale School District Martha B. Day School and Walter T. Bergen School NJASK Math Combined Proficiency Score Averages by Grade 2006-2014 Total Partially Proficient Combined TP & TAP Avg.
  • 20. Narrowing the Achievement Gap © 2015 Carole J. Rafferty 20 -100.0%-90.0% -80.0% -70.0% -60.0% -50.0% -40.0% -30.0% -20.0% -10.0% 0.0% 10.0% 20.0% 30.0% 40.0% 50.0% 60.0% 70.0% 80.0% 90.0% 100.0% Gr. 3 Gr. 4 Gr. 5 Bloomingdale School District Martha B. Day School and Walter T. Bergen School NJASK Math Proficiency Score Averages by Grade 2006-2014 Total Advanced Proficient Total Partially Proficient Total Proficient
  • 21. Narrowing the Achievement Gap © 2015 Carole J. Rafferty 21 Martha B. Day School (3rd/4th) and Walter T. Bergen School (5th) Bloomingdale School District NJASK Proficiency Scores - Math 2006-2014 Total Partially Proficient Total Proficient Total Advanced Proficient Combined TP & TAP Avg. Grade 3 2006 21.6% 48.7% 29.7% 78.4% 2007 12.9% 58.1% 29.0% 87.1% 2008 17.9% 59.7% 22.4% 82.1% 2009 21.9% 46.6% 31.5% 78.1% 2010 29.3% 29.3% 41.4% 70.7% 2011 14.1% 47.4% 38.5% 85.9% 2012 10.0% 35.0% 55.0% 90.0% 2013 19.0% 33.0% 48.0% 81.0% 2014 18.9% 40.5% 40.5% 81.0% Avg 18.4% 44.3% 37.3% 81.6% Total Partially Proficient Total Proficient Total Advanced Proficient Combined TP & TAP Avg. Grade 4 2006 13.8% 37.9% 48.3% 86.2% 2007 16.2% 41.3% 48.5% 89.8% 2008 13.3% 40.0% 46.7% 86.7% 2009 39.7% 42.6% 17.6% 60.2% 2010 24.7% 53.4% 21.9% 75.3% 2011 38.2% 49.1% 12.7% 61.8% 2012 36.0% 51.0% 14.0% 65.0% 2013 27.0% 52.0% 21.0% 79.9% 2014 21.8% 56.4% 21.8% 78.2% Avg 25.6% 47.1% 28.1% 75.9% Total Partially Proficient Total Proficient Total Advanced Proficient Combined TP & TAP Avg. Grade 5 2006 19.5% 64.6% 15.9% 80.5% 2007 24.6% 61.4% 14.0% 75.4% 2008 28.1% 56.3% 15.6% 71.9% 2009 39.3% 41.1% 19.6% 60.7% 2010 30.5% 52.8% 16.7% 69.5% 2011 26.8% 47.9% 25.4% 73.3% 2012 17.0% 56.0% 27.0% 83.0% 2013 19.0% 58.0% 23.0% 92.7% 2014 21.5% 55.4% 23.1% 78.5% Avg 25.1% 54.8% 20.0% 76.2%
  • 22. Narrowing the Achievement Gap © 2015 Carole J. Rafferty 22 NAG – Bloomingdale School District Comparison Data
  • 23. Narrowing the Achievement Gap © 2015 Carole J. Rafferty 23 0.0% 10.0% 20.0% 30.0% 40.0% 50.0% 60.0% 70.0% 80.0% 90.0% 100.0% 20132012201120102009200820072006 Bloomingdale School District Grade 4 NJASK LAL Scores Comparison Martha B. Day E.S. Gr. 4 NJASK LAL Scores NJ NAEP Average
  • 24. Narrowing the Achievement Gap © 2015 Carole J. Rafferty 24 0.0% 10.0% 20.0% 30.0% 40.0% 50.0% 60.0% 70.0% 80.0% 90.0% 100.0% 2006 2007 2008 2009 2010 2011 2012 2013 Bloomingdale School District Grade 4 NJASK Math Score Comparison Martha B. Day Gr. 4 NJASK Math Scores NJ NAEP Average U.S. NAEP Average
  • 25. Narrowing the Achievement Gap © 2015 Carole J. Rafferty 25 Martha B. Day Gr. 4 Scores Total Core Area Average Literacy Scores Total CD Area Average Literacy Score NJ NAEP Average U.S. NAEP Average 2006 79.9% 88.4% 80.2% 2007 83.8% 86.2% 80.9% 77.2% 65.8% 2008 84.8% 88.5% 83.0% 2009 66.2% 74.1% 67.6% 76.1% 65.7% 2010 47.9% 72.6% 66.3% 82.7% 66.8% 2011 56.4% 75.4% 66.2% 80.6% 61.9% 2012 57.0% 67.2% 61.6% 78.1% 66.2% 2013 60.0% 70.6% 66.7% 82.5% 70.6% Avg 67.0% 77.9% 71.6% 79.5% 66.2% NJASK LAL Scores Comparison - 2006-2013 Grade 4 - Martha B. Day School Bloomingdale School District
  • 26. Narrowing the Achievement Gap © 2015 Carole J. Rafferty 26 NJASK Math Scores Comparison 2006-2013 Grade 4 - Martha B. Day School Bloomingdale School District Martha B. Day Gr. 4 NJASK Math Scores NJ NAEP Average U.S. NAEP Average 2006 86.2% 2007 89.8% 2008 86.7% 2009 60.2% 87.6% 81.1% 2010 75.3% 2011 61.8% 89.0% 82.0% 2012 65.0% 2013 79.9% 87.0% 83.0% Avg 75.6% 87.9% 82.0%
  • 27. Narrowing the Achievement Gap © 2015 Carole J. Rafferty 27 0.0% 10.0% 20.0% 30.0% 40.0% 50.0% 60.0% 70.0% 80.0% 90.0% 100.0% 2006 2007 2008 2009 2010 2011 Bloomingdale School District Martha B. Day Elementary School Grade 4 NJASK LAL Score 0 10 20 30 40 50 60 70 80 2006 2007 2008 2009 2010 2011 Bloomingdale School District Martha B. Day Elementary School Grade 4 Enrollment 2006-2011 NJASK LAL Factor Comparison - 2006-2013 Grade 4 - Martha B. Day School Bloomingdale School District 2006 2007 2008 2009 2010 2011 Avg. Day School Grade 4 NJASK LAL Scores 88.4% 86.2% 88.5% 74.1% 72.6% 75.4% 80.9% Martha B. Day E.S. Grade 4 Enrollment 28 67 58 69 74 55 58.5
  • 28. Narrowing the Achievement Gap © 2015 Carole J. Rafferty 28 0.0% 10.0% 20.0% 30.0% 40.0% 50.0% 60.0% 70.0% 80.0% 90.0% 100.0% 2006 2007 2008 2009 2010 2011 Bloomingdale School District Martha B. Day Elementary School Grade 4 NJASK LAL Score 0.0 5.0 10.0 15.0 20.0 25.0 30.0 2006 2007 2008 2009 2010 2011 Bloomingdale School District Martha B. Day Elementary School Grade 4 Class Size 2006-2011 2006 2007 2008 2009 2010 2011 Avg. Day School Grade 4 NJASK LAL Scores 88.4% 86.2% 88.5% 74.1% 72.6% 75.4% 80.9% Martha B. Day E.S. Grade 4 Class Size 14.0 16.8 19.3 23.0 24.7 18.3 19.4 NJASK LAL Factor Comparison - 2006-2013 Grade 4 - Martha B. Day School Bloomingdale School District
  • 29. Narrowing the Achievement Gap © 2015 Carole J. Rafferty 29 NJASK LAL Factor Comparison - 2006-2013 Grade 4 - Martha B. Day School Bloomingdale School District 0.0% 10.0% 20.0% 30.0% 40.0% 50.0% 60.0% 70.0% 80.0% 90.0% 100.0% 2006 2007 2008 2009 2010 2011 Bloomingdale School District Martha B. Day Elementary School Grade 4 NJASK LAL Score 0.0% 10.0% 20.0% 30.0% 40.0% 50.0% 60.0% 70.0% 80.0% 90.0% 100.0% 2006 2007 2008 2009 2010 2011 Bloomingdale School District Martha B.Day Elementary School English Speakers 2006-2011 2006 2007 2008 2009 2010 2011 Avg. Day School Grade 4 NJASK LAL Scores 88.4% 86.2% 88.5% 74.1% 72.6% 75.4% 80.9% Martha B. Day E.S. English Speakers 78.7% 98.5% 98.5% 80.9% 80.9% 100.0% 89.6%
  • 30. Narrowing the Achievement Gap © 2015 Carole J. Rafferty 30 0.0% 10.0% 20.0% 30.0% 40.0% 50.0% 60.0% 70.0% 80.0% 90.0% 100.0% 2006 2007 2008 2009 2010 2011 Bloomingdale School District Martha B. Day School Grade 4 Average Math Score 2006 2007 2008 2009 2010 2011 Average Martha B. Day Gr. 4 NJASK Math Scores 86.2% 89.8% 86.7% 60.2% 75.3% 61.8% 76.7% Martha B. Day School Grade 4 Enrollment 28 67 58 69 74 55 58.5 Grade 4 - Martha B. Day School Bloomingdale School District NJASK Math Scores Factor Comparisons 2006-2013 0 10 20 30 40 50 60 70 80 2006 2007 2008 2009 2010 2011 Bloomingdale School District Martha B. Day School Grade 4 Enrollment 2006-2011
  • 31. Narrowing the Achievement Gap © 2015 Carole J. Rafferty 31 Grade 4 - Martha B. Day School Bloomingdale School District NJASK Math Scores Factor Comparisons 2006-2013 0.0% 10.0% 20.0% 30.0% 40.0% 50.0% 60.0% 70.0% 80.0% 90.0% 100.0% 2006 2007 2008 2009 2010 2011 Bloomingdale School District Martha B. Day School Grade 4 Average Math Score 2006 2007 2008 2009 2010 2011 Average Martha B. Day Gr. 4 NJASK Math Scores 86.2% 89.8% 86.7% 60.2% 75.3% 61.8% 76.7% Martha B. Day School Grade 4 Class Size 14.0 16.8 19.3 23.0 24.7 18.3 19.4 0.0 5.0 10.0 15.0 20.0 25.0 30.0 2006 2007 2008 2009 2010 2011 Bloomingdale School District Martha B. Day School Grade 4 Class Size 2006-2011
  • 32. Narrowing the Achievement Gap © 2015 Carole J. Rafferty 32 Grade 4 - Martha B. Day School Bloomingdale School District NJASK Math Scores Factor Comparisons 2006-2013 0.0% 10.0% 20.0% 30.0% 40.0% 50.0% 60.0% 70.0% 80.0% 90.0% 100.0% 2006 2007 2008 2009 2010 2011 Bloomingdale School District Martha B. Day School Grade 4 Average Math Score 0.0% 10.0% 20.0% 30.0% 40.0% 50.0% 60.0% 70.0% 80.0% 90.0% 100.0% 2006 2007 2008 2009 2010 2011 Bloomingdale School District Martha B.Day School English Speakers 2006-2011 2006 2007 2008 2009 2010 2011 Average Martha B. Day Gr. 4 NJASK Math Scores 86.2% 89.8% 86.7% 60.2% 75.3% 61.8% 76.7% Martha B. Day School English Speakers 78.7% 98.5% 98.5% 80.9% 80.9% 100.0% 89.6%
  • 33. Narrowing the Achievement Gap © 2015 Carole J. Rafferty 33 -100.0% -90.0% -80.0% -70.0% -60.0% -50.0% -40.0% -30.0% -20.0% -10.0% 0.0% 10.0% 20.0% 30.0% 40.0% 50.0% 60.0% 70.0% 80.0% 90.0% 100.0% Combined TP & TAP Avg. Total Proficient Total Partially Proficient Total Advanced Proficient Bloomingdale Public School District Language Arts & Literacy Versus Math NJASK Scores Comparison LAL Avg. Math Avg.
  • 34. Narrowing the Achievement Gap © 2015 Carole J. Rafferty 34 -100.0% -90.0% -80.0% -70.0% -60.0% -50.0% -40.0% -30.0% -20.0% -10.0% 0.0% 10.0% 20.0% 30.0% 40.0% 50.0% 60.0% 70.0% 80.0% 90.0% 100.0% Combined TP & TAP Avg. Total Proficient Total Partially Proficient Total Advanced Proficient Bloomingdale Public Schools Comparison Language Arts & Literacy Versus Math NJASK Scores - Grade 3 LAL Gr. 3 Math Gr. 3
  • 35. Narrowing the Achievement Gap © 2015 Carole J. Rafferty 35 -100.0% -90.0% -80.0% -70.0% -60.0% -50.0% -40.0% -30.0% -20.0% -10.0% 0.0% 10.0% 20.0% 30.0% 40.0% 50.0% 60.0% 70.0% 80.0% 90.0% 100.0% Combined TP & TAP Avg. Total Proficient Total Partially Proficient Total Advanced Proficient Bloomingdale Public Schools Comparison Language Arts & Literacy Versus Math NJASK Scores - Grade 4 LAL Gr. 4 Math Gr. 4
  • 36. Narrowing the Achievement Gap © 2015 Carole J. Rafferty 36 -100.0% -90.0% -80.0% -70.0% -60.0% -50.0% -40.0% -30.0% -20.0% -10.0% 0.0% 10.0% 20.0% 30.0% 40.0% 50.0% 60.0% 70.0% 80.0% 90.0% 100.0% Combined TP & TAP Avg. Total Proficient Total Partially Proficient Total Advanced Proficient Bloomingdale Public Schools Comparison Language Arts & Literacy Versus Math NJASK Scores - Grade 5 LAL Gr. 5 Math Gr. 5
  • 37. Narrowing the Achievement Gap © 2015 Carole J. Rafferty 37 NJASK Scores Comparison LAL Versus Math 2006-2014 Martha B. Day Elementary School (3rd/4th) and Walter T. Bergen Middle School (5th) Bloomingdale School District LAL Gr. 3 LAL Gr. 4 LAL Gr. 5 Avg. Combined TP & TAP Avg. 69.2% 65.4% 69.0% 67.9% Total Proficient 65.7% 63.2% 65.7% 64.9% Total Partially Proficient -30.7% -34.7% -31.1% -32.2% Total Advanced Proficient 3.6% 2.2% 3.3% 3.0% Math Gr. 3 Math Gr. 4 Math Gr. 5 Avg. Combined TP & TAP Avg. 81.6% 75.9% 76.2% 77.9% Total Proficient 44.3% 47.1% 54.8% 48.7% Total Partially Proficient -18.4% -25.6% -25.1% -23.1% Total Advanced Proficient 37.3% 28.1% 20.0% 28.5% Math Score Averages by Grade LAL Gr. 3 Math Gr. 3 LAL Gr. 4 Math Gr. 4 LAL Gr. 5 Math Gr. 5 Combined TP & TAP Avg. 69.2% 81.6% 65.4% 75.9% 69.0% 76.2% Total Proficient 65.7% 44.3% 63.2% 47.1% 65.7% 54.8% Total Partially Proficient -30.7% -18.4% -34.7% -25.6% -31.1% -25.1% Total Advanced Proficient 3.6% 37.3% 2.2% 28.1% 3.3% 20.0%
  • 38. Narrowing the Achievement Gap © 2015 Carole J. Rafferty 38 NAG – Bloomingdale School District Enrollment Comparison
  • 39. Narrowing the Achievement Gap © 2015 Carole J. Rafferty 39 0 10 20 30 40 50 60 70 80 90 2006 2007 2008 2009 2010 2011 2012 2013 Bloomingdale School District Enrollment 2006-2013 Grade 3 Grade 4 Grade 5
  • 40. Narrowing the Achievement Gap © 2015 Carole J. Rafferty 40 Martha B. Day 030 Walter T. Bergen 050 Bloomingdale School District 0420 Enrollment 2006-2013 Grade 3 Grade 4 Grade 5 Total 2006 37 28 83 148 2007 59 67 53 179 2008 64 58 62 184 2009 74 69 56 199 2010 58 74 72 204 2011 78 55 70 203 2012 61 79 56 196 2013 57 63 75 195 Average 61 62 66 189 Median Change 20 35 -8 47 Percent 33% 57% -12% 25%
  • 41. Narrowing the Achievement Gap © 2015 Carole J. Rafferty 41 0 25 50 75 100 125 150 175 200 225 2006 2007 2008 2009 2010 2011 2012 2013 Bloomingdale School District Total Enrollment 3rd - 5th Grades 2006-2013
  • 42. Narrowing the Achievement Gap © 2015 Carole J. Rafferty 42 NAG – Bloomingdale School District Class Sizes Grades 3 through 5
  • 43. Narrowing the Achievement Gap © 2015 Carole J. Rafferty 43 0.0 5.0 10.0 15.0 20.0 25.0 30.0 2006 2007 2008 2009 2010 2011 Bloomingdale School District Class Size 2006-2011 Grade 3 Grade 4 Grade 5 Grade 3 Grade 4 Grade 5 2006 18.5 14.0 20.8 2007 14.8 16.8 13.3 2008 21.3 19.3 20.7 2009 24.7 23.0 18.7 2010 19.3 24.7 24.0 2011 26.0 18.3 23.3 2012 2013 Average 20.8 19.4 20.1
  • 44. Narrowing the Achievement Gap © 2015 Carole J. Rafferty 44 NAG – Bloomingdale School District English-Speaking Students
  • 45. Narrowing the Achievement Gap © 2015 Carole J. Rafferty 45 0.0% 10.0% 20.0% 30.0% 40.0% 50.0% 60.0% 70.0% 80.0% 90.0% 100.0% 2006 2007 2008 2009 2010 2011 2012 2013 Bloomingdale School District Percentage of English-Speaking Students 2006 2007 2008 2009 2010 2011 2012 2013 78.5% 98.8% 98.7% 78.2% 79.9% 94.0% 81.0% 81.7%
  • 46. Narrowing the Achievement Gap © 2015 Carole J. Rafferty 46 NAG – Bloomingdale School District SAT Scores
  • 47. Narrowing the Achievement Gap © 2015 Carole J. Rafferty 47 Verbal SAT Score 2013 495 2012 503 2011 498 2010 498 2009 507 2008 494 2007 488 2006 488 Butler H.S. 495 503 498498 507 494 488488 475 480 485 490 495 500 505 510 20132012201120102009200820072006 Butler High School Verbal SAT Scores 2006-2013
  • 48. Narrowing the Achievement Gap © 2015 Carole J. Rafferty 48 Math SAT Score 2013 505 2012 501 2011 499 2010 487 2009 499 2008 499 2007 487 2006 497 Butler H.S. 501 499 487 499499 487 497 480 485 490 495 500 505 2012201120102009200820072006 Butler High School Math SAT Scores 2006-2013
  • 49. Narrowing the Achievement Gap © 2015 Carole J. Rafferty 49 NAG – Bloomingdale School District Adult Resident Education Levels
  • 50. Narrowing the Achievement Gap © 2015 Carole J. Rafferty 50 Bloomingdale School District Adult Educational Level 39.9% 17.0% 7.6% 1.8% Bloomingdale School District Adult Educational Level High School College Masters Profl/Doctorate
  • 51. Narrowing the Achievement Gap © 2015 Carole J. Rafferty 51 Adult Education Level Bloomingdale High School 39.9% College 17.0% Masters 7.6% Profl/Doc torate 1.8% Bloomingdale School District Adult Educational Level