
Recommended
More Related Content
What's hot
What's hot (10)
Viewers also liked
Viewers also liked (20)
Similar to NAG - Butler SD Aaron Decker ES Richard Butler MS
Similar to NAG - Butler SD Aaron Decker ES Richard Butler MS (20)
NAG - Butler SD Aaron Decker ES Richard Butler MS
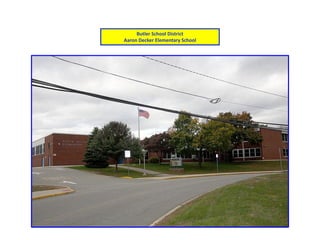
- 1. Butler School District Aaron Decker Elementary School
- 2. Narrowing the Achievement Gap © 2015 Carole J. Rafferty 2 0.0% 10.0% 20.0% 30.0% 40.0% 50.0% 60.0% 70.0% 80.0% 90.0% 100.0% 2006 2007 2008 2009 2010 2011 2012 2013 2014 Butler School District Aaron Decker School and Richard T. Butler School NJASK LAL Combined Proficiency Scores by Grade 2006-2014 Gr. 3 Gr. 4 Gr. 5
- 3. Narrowing the Achievement Gap © 2015 Carole J. Rafferty 3 Total Partially Proficient Total Proficient Total Advanced Proficient Combined TP & TAP Avg. School Year & Grade 2014 Gr. 3 42.0% 56.5% 1.4% 57.9% Gr. 4 32.5% 62.3% 5.2% 67.5% Gr. 5 40.8% 57.7% 1.4% 59.1% 2013 Gr. 3 46.0% 53.0% 1.0% 54.0% Gr. 4 38.0% 59.0% 3.0% 62.0% Gr. 5 28.0% 70.0% 1.0% 71.0% 2012 Gr. 3 47.0% 53.0% 0.0% 53.0% Gr. 4 59.0% 41.0% 0.0% 41.0% Gr. 5 39.0% 56.0% 5.0% 61.0% 2011 Gr. 3 46.8% 53.2% 0.0% 53.2% Gr. 4 39.1% 57.4% 3.4% 60.8% Gr. 5 35.3% 64.7% 0.0% 64.7% 2010 Gr. 3 42.9% 56.0% 1.2% 57.2% Gr. 4 29.8% 59.6% 10.5% 70.1% Gr. 5 39.7% 54.8% 5.5% 60.3% 2009 Gr. 3 45.6% 52.6% 1.8% 54.4% Gr. 4 33.8% 62.2% 4.1% 66.3% Gr. 5 33.3% 63.8% 2.9% 66.7% 2008 Gr. 3 6.8% 93.2% 0.0% 93.2% Gr. 4 15.0% 74.6% 10.4% 85.0% Gr. 5 53.7% 41.8% 4.5% 46.3% 2007 Gr. 3 16.2% 83.8% 0.0% 83.8% Gr. 4 23.9% 73.1% 3.0% 76.1% Gr. 5 12.1% 79.3% 8.6% 87.9% 2006 Gr. 3 17.6% 82.4% 0.0% 82.4% Gr. 4 16.9% 83.1% 0.0% 83.1% Gr. 5 9.1% 87.5% 3.4% 90.0% Butler School District 0630 NJASK Scores - Language Arts & Literacy Aaron Decker Elementary School and Richard Butler School, Codes 25 and 30
- 4. Narrowing the Achievement Gap © 2015 Carole J. Rafferty 4 -100.0% -90.0% -80.0% -70.0% -60.0% -50.0% -40.0% -30.0% -20.0% -10.0% 0.0% 10.0% 20.0% 30.0% 40.0% 50.0% 60.0% 70.0% 80.0% 90.0% 100.0% Butler School District Grade 3 - Aaron Decker Elementary School NJASK LAL Combined Proficiency Scores 2006-2014 Combined TP & TAP Avg. Total Partially Proficient 2006 2007 2008 2009 2010 2011 2012 2013 2014 Avg Combined TP & TAP Avg. 82.4% 83.8% 93.2% 54.4% 57.2% 53.2% 53.0% 54.0% 57.9% 65.5% Total Partially Proficient -17.6% -16.2% -6.8% -45.6% -42.9% -46.8% -47.0% -46.0% -42.0% -34.5%
- 5. Narrowing the Achievement Gap © 2015 Carole J. Rafferty 5 0.0% 10.0% 20.0% 30.0% 40.0% 50.0% 60.0% 70.0% 80.0% 90.0% 100.0% 2006 2007 2008 2009 2010 2011 2012 2013 2014 Butler School District Grade 3 - Aaron Decker Elementary School NJASK LAL Combined Proficiency Scores 2006-2014 Combined TP & TAP Avg. Total Partially Proficient 0.0% 10.0% 20.0% 30.0% 40.0% 50.0% 60.0% 70.0% 80.0% 90.0% 100.0% 2006 2007 2008 2009 2010 2011 2012 2013 2014 Butler School District Grade 3 - Aaron Decker Elementary School NJASK LAL Proficiency Scores 2006-2013 Total Proficient Total Partially Proficient Total Advanced Proficient NJASK Scores Language Arts & Literacy 2006-2014 Grade 3 - Aaron Decker Elementary School Butler School District
- 6. Narrowing the Achievement Gap © 2015 Carole J. Rafferty 6 NJASK Scores Language Arts & Literacy 2006-2014 Grade 3 - Aaron Decker Elementary School Butler School District 2006 2007 2008 2009 2010 2011 2012 2013 2014 Avg Combined TP & TAP Avg. 82.4% 83.8% 93.2% 54.4% 57.2% 53.2% 53.0% 54.0% 57.9% 65.5% Total Proficient 82.4% 83.8% 93.2% 52.6% 56.0% 53.2% 53.0% 53.0% 56.5% 64.9% Total Partially Proficient 17.6% 16.2% 6.8% 45.6% 42.9% 46.8% 47.0% 46.0% 42.0% 34.5% Total Advanced Proficient 0.0% 0.0% 0.0% 1.8% 1.2% 0.0% 0.0% 1.0% 1.4% 0.6%
- 7. Narrowing the Achievement Gap © 2015 Carole J. Rafferty 7 -100.0% -90.0% -80.0% -70.0% -60.0% -50.0% -40.0% -30.0% -20.0% -10.0% 0.0% 10.0% 20.0% 30.0% 40.0% 50.0% 60.0% 70.0% 80.0% 90.0% 2006 2007 2008 2009 2010 2011 2012 2013 2014 Butler School District Grade 4 - Aaron Decker Elementary School NJASK LAL Combined Proficiency Scores 2006-2013 Combined TP & TAP Avg. Total Partially Proficient 2006 2007 2008 2009 2010 2011 2012 2013 2014 Avg Combined TP & TAP Avg. 83.1% 76.1% 85.0% 66.3% 70.1% 60.8% 41.0% 62.0% 67.5% 68.0% Total Partially Proficient -16.9% -23.9% -15.0% -33.8% -29.8% -39.1% -59.0% -38.0% -32.5% -32.0%
- 8. Narrowing the Achievement Gap © 2015 Carole J. Rafferty 8 0.0% 10.0% 20.0% 30.0% 40.0% 50.0% 60.0% 70.0% 80.0% 90.0% 100.0% 2006 2007 2008 2009 2010 2011 2012 2013 2014 Butler School District Grade 4 - Aaron Decker Elementary School NJASK LAL Combined Proficiency Scores 2006-2013 Combined TP & TAP Avg. Total Partially Proficient 0.0% 10.0% 20.0% 30.0% 40.0% 50.0% 60.0% 70.0% 80.0% 90.0% 100.0% 2006 2007 2008 2009 2010 2011 2012 2013 2014 Butler School District Grade 4 - Aaron Decker Elementary School NJASK LAL Combined Proficiency Scores 2006-2013 Combined TP & TAP Avg. Total Partially Proficient NJASK Scores Language Arts & Literacy 2006-2014 Grade 4 - Aaron Decker Elementary School Butler School District
- 9. Narrowing the Achievement Gap © 2015 Carole J. Rafferty 9 NJASK Scores Language Arts & Literacy 2006-2014 Grade 4 - Aaron Decker Elementary School Butler School District 2006 2007 2008 2009 2010 2011 2012 2013 2014 Avg Combined TP & TAP Avg. 83.1% 76.1% 85.0% 66.3% 70.1% 60.8% 41.0% 62.0% 67.5% 68.0% Total Proficient 83.1% 73.1% 74.6% 62.2% 59.6% 57.4% 41.0% 59.0% 62.3% 63.6% Total Partially Proficient 16.9% 23.9% 15.0% 33.8% 29.8% 39.1% 59.0% 38.0% 32.5% 32.0% Total Advanced Proficient 0.0% 3.0% 10.4% 4.1% 10.5% 3.4% 0.0% 3.0% 5.2% 4.4%
- 10. Narrowing the Achievement Gap © 2015 Carole J. Rafferty 10 0.0% 10.0% 20.0% 30.0% 40.0% 50.0% 60.0% 70.0% 80.0% 90.0% 100.0% 2006 2007 2008 2009 2010 2011 2012 2013 2014 Butler School District Aaron Decker School and Richard T. Butler School NJASK Math Combined Proficiency Scores by Grade 2006-2014 Gr. 3 Gr. 4 Gr. 5 2006 2007 2008 2009 2010 2011 2012 2013 2014 Avg. Gr. 3 92.7% 83.8% 90.8% 80.7% 84.6% 92.0% 75.0% 86.0% 81.2% 85.7% Gr. 4 95.0% 91.0% 89.6% 73.0% 80.7% 79.5% 93.0% 79.0% 88.4% 85.1% Gr. 5 79.6% 84.5% 75.4% 78.3% 89.0% 86.3% 91.0% 91.0% 88.7% 84.4%
- 11. Narrowing the Achievement Gap © 2015 Carole J. Rafferty 11 Aaron Decker Elementary School and Richard Butler School, Codes 25 and 30 Butler School District 0630 NJASK Math Scores - 2006-2014 Total Partially Proficient Total Proficient Total Advanced Proficient Combined TP & TAP Avg. School Year & Grade 2014 Gr. 3 18.8% 37.7% 43.5% 81.2% Gr. 4 11.7% 39.0% 49.4% 88.4% Gr. 5 11.3% 40.8% 47.9% 88.7% 2013 Gr. 3 14.0% 40.0% 46.0% 86.0% Gr. 4 21.0% 47.0% 32.0% 79.0% Gr. 5 9.0% 36.0% 55.0% 91.0% 2012 Gr. 3 25.0% 49.0% 26.0% 75.0% Gr. 4 7.0% 54.0% 39.0% 93.0% Gr. 5 8.0% 55.0% 36.0% 91.0% 2011 Gr. 3 8.0% 58.1% 33.9% 92.0% Gr. 4 20.5% 60.2% 19.3% 79.5% Gr. 5 13.7% 43.2% 43.1% 86.3% 2010 Gr. 3 15.4% 53.6% 31.0% 84.6% Gr. 4 19.3% 42.1% 38.6% 80.7% Gr. 5 11.0% 52.0% 37.0% 89.0% 2009 Gr. 3 19.3% 45.6% 35.1% 80.7% Gr. 4 27.0% 50.0% 23.0% 73.0% Gr. 5 21.7% 37.7% 40.6% 78.3% 2008 Gr. 3 9.2% 57.9% 32.9% 90.8% Gr. 4 10.4% 47.8% 41.8% 89.6% Gr. 5 24.6% 58.0% 17.4% 75.4% 2007 Gr. 3 16.2% 50.0% 33.8% 83.8% Gr. 4 9.0% 58.2% 32.8% 91.0% Gr. 5 15.5% 62.1% 22.4% 84.5% 2006 Gr. 3 7.4% 66.2% 26.5% 92.7% Gr. 4 5.0% 51.7% 43.3% 95.0% Gr. 5 20.5% 70.5% 9.1% 79.6%
- 12. Narrowing the Achievement Gap © 2015 Carole J. Rafferty 12 -100.0% -90.0% -80.0% -70.0% -60.0% -50.0% -40.0% -30.0% -20.0% -10.0% 0.0% 10.0% 20.0% 30.0% 40.0% 50.0% 60.0% 70.0% 80.0% 90.0% 100.0% 2006 2007 2008 2009 2010 2011 2012 2013 2014 Butler School District Grade 3 - Aaron Decker School NJASK Math Combined Proficiency Scores 2006-2014 Combined TP & TAP Avg. Total Partially Proficient 2006 2007 2008 2009 2010 2011 2012 2013 2014 Avg. Combined TP & TAP Avg. 86.0% 75.0% 92.0% 84.6% 80.7% 90.8% 83.8% 92.7% 81.2% 85.2% Total Partially Proficient -14.0% -25.0% -8.0% -15.4% -19.3% -9.2% -16.2% -7.4% -18.8% -14.8%
- 13. Narrowing the Achievement Gap © 2015 Carole J. Rafferty 13 0.0% 10.0% 20.0% 30.0% 40.0% 50.0% 60.0% 70.0% 80.0% 90.0% 100.0% 2006 2007 2008 2009 2010 2011 2012 2013 2014 Butler School District Grade 3 - Aaron Decker School NJASK Math Combined Proficiency Scores 2006-2014 Combined TP & TAP Avg. Total Partially Proficient 0.0% 10.0% 20.0% 30.0% 40.0% 50.0% 60.0% 70.0% 80.0% 90.0% 100.0% 2006 2007 2008 2009 2010 2011 2012 2013 2014 Butler School District Grade 3 - Aaron Decker School NJASK Math Proficiency Scores 2006-2013 Total Proficient Total Partially Proficient Total Advanced Proficient NJASK Scores Math 2006-2014 Grade 3 - Aaron Decker School Butler School District
- 14. Narrowing the Achievement Gap © 2015 Carole J. Rafferty 14 NJASK Scores Math 2006-2014 Grade 3 - Aaron Decker School Butler School District 2006 2007 2008 2009 2010 2011 2012 2013 2014 Avg. Combined TP & TAP Avg. 86.0% 75.0% 92.0% 84.6% 80.7% 90.8% 83.8% 92.7% 81.2% 85.2% Total Proficient 40.0% 49.0% 58.1% 53.6% 45.6% 57.9% 50.0% 66.2% 37.7% 50.9% Total Partially Proficient 14.0% 25.0% 8.0% 15.4% 19.3% 9.2% 16.2% 7.4% 18.8% 14.8% Total Advanced Proficient 46.0% 26.0% 33.9% 31.0% 35.1% 32.9% 33.8% 26.5% 43.5% 34.3%
- 15. Narrowing the Achievement Gap © 2015 Carole J. Rafferty 15 NJASK Scores Math 2006-2014 Grade 4 - Aaron Decker School Butler School District 0.0% 10.0% 20.0% 30.0% 40.0% 50.0% 60.0% 70.0% 80.0% 90.0% 100.0% 2006 2007 2008 2009 2010 2011 2012 2013 2014 Butler School District Grade 4 - Aaron Decker School NJASK Math Combined Proficiency Scores 2006-2014 Combined TP & TAP Avg. Total Partially Proficient 0.0% 10.0% 20.0% 30.0% 40.0% 50.0% 60.0% 70.0% 80.0% 90.0% 100.0% 2006 2007 2008 2009 2010 2011 2012 2013 2014 Butler School District Grade 4 - Aaron Decker School NJASK Math Proficiency Scores 2006-2014 Total Proficient Total Partially Proficient Total Advanced Proficient
- 16. Narrowing the Achievement Gap © 2015 Carole J. Rafferty 16 -100.0% -90.0% -80.0% -70.0% -60.0% -50.0% -40.0% -30.0% -20.0% -10.0% 0.0% 10.0% 20.0% 30.0% 40.0% 50.0% 60.0% 70.0% 80.0% 90.0% 100.0% 2006 2007 2008 2009 2010 2011 2012 2013 2014 Butler School District Grade 4 - Aaron Decker School NJASK Math Combined Proficiency Scores 2006-2014 Combined TP & TAP Avg. Total Partially Proficient 2006 2007 2008 2009 2010 2011 2012 2013 2014 Avg. Combined TP & TAP Avg. 79.0% 93.0% 79.5% 80.7% 73.0% 89.6% 91.0% 95.0% 88.4% 85.1% Total Partially Proficient -21.0% -7.0% -20.5% -19.3% -27.0% -10.4% -9.0% -5.0% -11.7% -14.9%
- 17. Narrowing the Achievement Gap © 2015 Carole J. Rafferty 17 0% 10% 20% 30% 40% 50% 60% 70% 80% 90% 100% 2006 2007 2008 2009 2010 2011 2012 2013 Aaron Decker Elementary School English-Speaking Comparison Unknown Other Foreign Spanish English
- 18. Narrowing the Achievement Gap © 2015 Carole J. Rafferty 18 Aaron Decker Elementary School 025 Butler School District 0630 English Spanish Other Foreign Unknown 2006 96.5% 2.9% 0.6% 0.6% 2007 90.4% 7.1% 2.4% 2.4% 2008 96.8% 2.9% 0.3% 0.0% 2009 96.4% 2.6% 1.1% 0.0% 2010 94.1% 4.9% 1.1% 0.0% 2011 79.9% 10.6% 6.6% 2.9% 2012 83.0% 10.2% 4.5% 2.2% 2013 85.5% 9.2% 3.6% 1.8%
- 19. Narrowing the Achievement Gap © 2015 Carole J. Rafferty 19 Butler School District Richard Butler Middle School
- 20. Narrowing the Achievement Gap © 2015 Carole J. Rafferty 20 -100.0% -90.0% -80.0% -70.0% -60.0% -50.0% -40.0% -30.0% -20.0% -10.0% 0.0% 10.0% 20.0% 30.0% 40.0% 50.0% 60.0% 70.0% 80.0% 90.0% 2006 2007 2008 2009 2010 2011 2012 2013 2014 Butler School District Grade 5 - Richard Butler Middle School NJASK LAL Combined Proficiency Scores 2006-2014 Combined TP & TAP Avg. Total Partially Proficient 2006 2007 2008 2009 2010 2011 2012 2013 2014 Avg Combined TP & TAP Avg. 90.0% 87.9% 46.3% 66.7% 60.3% 64.7% 61.0% 71.0% 59.1% 67.4% Total Partially Proficient -9.1% -12.1% -53.7% -33.3% -39.7% -35.3% -39.0% -28.0% -40.8% -32.3%
- 21. Narrowing the Achievement Gap © 2015 Carole J. Rafferty 21 0.0% 10.0% 20.0% 30.0% 40.0% 50.0% 60.0% 70.0% 80.0% 90.0% 100.0% 2006 2007 2008 2009 2010 2011 2012 2013 2014 Butler School District Grade 5 - Richard Butler Middle School NJASK LAL Combined Proficiency Scores 2006-2014 Combined TP & TAP Avg. Total Partially Proficient 0.0% 10.0% 20.0% 30.0% 40.0% 50.0% 60.0% 70.0% 80.0% 90.0% 100.0% 2006 2007 2008 2009 2010 2011 2012 2013 2014 Butler School District Grade 5 - Richard Butler Middle School NJASK LAL Proficiency Scores 2006-2014 Total Proficient Total Partially Proficient Total Advanced Proficient NJASK Scores Language Arts & Literacy 2006-2014 Grade 5 - Richard Butler Middle School Butler School District
- 22. Narrowing the Achievement Gap © 2015 Carole J. Rafferty 22 NJASK Scores Language Arts & Literacy 2006-2014 Grade 5 - Richard Butler Middle School Butler School District 2006 2007 2008 2009 2010 2011 2012 2013 2014 Avg Combined TP & TAP Avg. 90.0% 87.9% 46.3% 66.7% 60.3% 64.7% 61.0% 71.0% 59.1% 67.4% Total Proficient 87.5% 79.3% 41.8% 63.8% 54.8% 64.7% 56.0% 70.0% 57.7% 64.0% Total Partially Proficient 9.1% 12.1% 53.7% 33.3% 39.7% 35.3% 39.0% 28.0% 40.8% 32.3% Total Advanced Proficient 3.4% 8.6% 4.5% 2.9% 5.5% 0.0% 5.0% 1.0% 1.4% 3.6%
- 23. Narrowing the Achievement Gap © 2015 Carole J. Rafferty 23 -100.0% -90.0% -80.0% -70.0% -60.0% -50.0% -40.0% -30.0% -20.0% -10.0% 0.0% 10.0% 20.0% 30.0% 40.0% 50.0% 60.0% 70.0% 80.0% 90.0% 100.0% 2006 2007 2008 2009 2010 2011 2012 2013 2014 Butler School District Grade 5 - Aaron Decker School NJASK Math Combined Proficiency Scores 2006-2014 Combined TP & TAP Avg. Total Partially Proficient 2006 2007 2008 2009 2010 2011 2012 2013 2014 Avg. Combined TP & TAP Avg. 91.0% 91.0% 86.3% 89.0% 78.3% 75.4% 84.5% 79.6% 88.7% 84.4% Total Partially Proficient -7.0% -8.0% -13.7% -11.0% -21.7% -24.6% -15.5% -20.5% -11.3% -15.3%
- 24. Narrowing the Achievement Gap © 2015 Carole J. Rafferty 24 NJASK Scores Math 2006-2014 Grade 5 - Aaron Decker School Butler School District 0.0% 10.0% 20.0% 30.0% 40.0% 50.0% 60.0% 70.0% 80.0% 90.0% 100.0% 2006 2007 2008 2009 2010 2011 2012 2013 2014 Butler School District Grade 5 - Richard Butler School NJASK Math Combined Proficiency Scores 2006-2014 Combined TP & TAP Avg. Total Partially Proficient 0.0% 10.0% 20.0% 30.0% 40.0% 50.0% 60.0% 70.0% 80.0% 90.0% 100.0% 2006 2007 2008 2009 2010 2011 2012 2013 2014 Butler School District Grade 5 - Richard Butler School NJASK Math Proficiency Scores 2006-2014 Total Proficient Total Partially Proficient Total Advanced Proficient
- 25. Narrowing the Achievement Gap © 2015 Carole J. Rafferty 25 NJASK Scores Math 2006-2014 Grade 5 - Aaron Decker School Butler School District 2006 2007 2008 2009 2010 2011 2012 2013 2014 Avg. Combined TP & TAP Avg. 91.0% 91.0% 86.3% 89.0% 78.3% 75.4% 84.5% 79.6% 88.7% 84.4% Total Proficient 36.0% 55.0% 43.2% 52.0% 37.7% 58.0% 62.1% 70.5% 40.8% 51.8% Total Partially Proficient 7.0% 8.0% 13.7% 11.0% 21.7% 24.6% 15.5% 20.5% 11.3% 15.3% Total Advanced Proficient 55.0% 36.0% 43.1% 37.0% 40.6% 17.4% 22.4% 9.1% 47.9% 32.6%
- 26. Narrowing the Achievement Gap © 2015 Carole J. Rafferty 26 70.0% 80.0% 90.0% 100.0% 2006 2007 2008 2009 2010 2011 2012 2013 Richard Butler Middle School English-Speaking Comparison Unknown Other Foreign Spanish English
- 27. Narrowing the Achievement Gap © 2015 Carole J. Rafferty 27 Richard Butler Middle School 030 Butler School District 0630 English Spanish Other Foreign Unknown 2006 90.0% 2.2% 4.4% 1.9% 2007 90.8% 2.9% 5.1% 1.3% 2008 94.2% 2.7% 2.7% 0.3% 2009 96.4% 1.4% 1.9% 0.0% 2010 96.2% 2.3% 1.6% 0.0% 2011 85.5% 6.8% 3.6% 4.0% 2012 86.9% 6.7% 3.5% 2.8% 2013 84.9% 8.4% 4.4% 2.3%