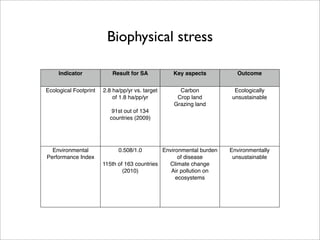
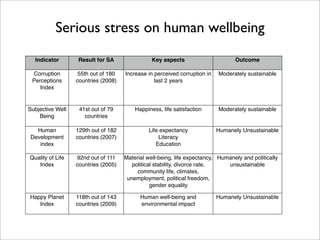
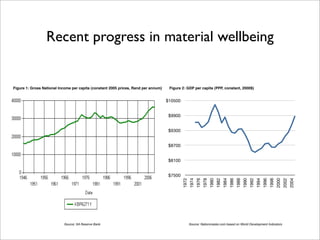
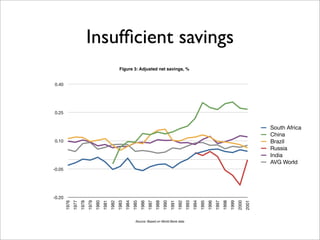
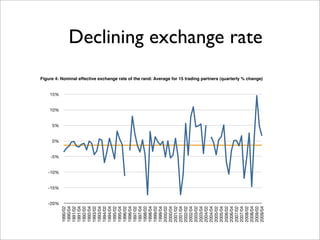
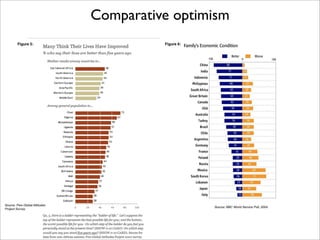
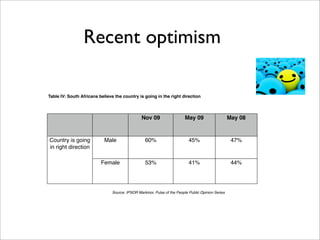
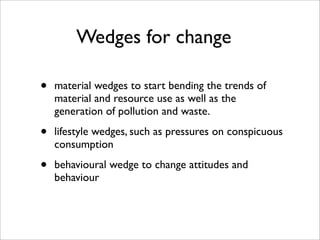
Factoring sustainability into
     South Africa’s future
                              Martin de Wit

Address delivered to World Future Society, 6 May 2010, BMW Pavillion, Cape
                                  Town.
Sustainability


•   Sustainability in its shortest
    definition is the capacity to endure

•   To endure one does not only need
    material goods, but also a mental
    and spiritual resilience and set of
    skills on how to cope.
Biophysical stress

     Indicator            Result for SA          Key aspects           Outcome


Ecological Footprint   2.8 ha/pp/yr vs. target     Carbon             Ecologically
                           of 1.8 ha/pp/yr        Crop land          unsustainable
                                                 Grazing land
                          91st out of 134
                         countries (2009)


  Environmental              0.508/1.0        Environmental burden   Environmentally
Performance Index                                   of disease        unsustainable
                       115th of 163 countries   Climate change
                               (2010)            Air pollution on
                                                   ecosystems
Serious stress on human wellbeing
  Indicator       Result for SA                 Key aspects                      Outcome

 Corruption        55th out of 180   Increase in perceived corruption in   Moderately sustainable
 Perceptions      countries (2008)               last 2 years
    Index


Subjective Well    41st out of 79        Happiness, life satisfaction      Moderately sustainable
    Being            countries

   Human          129th out of 182            Life expectancy              Humanely Unsustainable
 Development      countries (2007)                Literacy
    index                                        Education

Quality of Life   92nd out of 111    Material well-being, life expectancy, Humanely and politically
   Index          countries (2005)      political stability, divorce rate,    unsustainable
                                          community life, climates,
                                      unemployment, political freedom,
                                                gender equality

Happy Planet      118th out of 143         Human well-being and            Humanely Unsustainable
   Index          countries (2009)         environmental impact
Recent progress in material wellbeing


Figure 1: Gross National Income per capita (constant 2005 prices, Rand per annum)    Figure 2: GDP per capita (PPP, constant, 2000$)


                                                                                    $10500


                                                                                     $9900


                                                                                     $9300


                                                                                     $8700


                                                                                     $8100


                                                                                     $7500

                                                                                             1972
                                                                                                    1974
                                                                                                           1976
                                                                                                                  1978
                                                                                                                         1980
                                                                                                                                1982
                                                                                                                                       1984
                                                                                                                                              1986
                                                                                                                                                     1988
                                                                                                                                                            1990
                                                                                                                                                                   1992
                                                                                                                                                                          1994
                                                                                                                                                                                 1996
                                                                                                                                                                                        1998
                                                                                                                                                                                               2000
                                                                                                                                                                                                      2002
                                                                                                                                                                                                             2004
                           Source: SA Reserve Bank                                                  Source: Nationmaster.com based on World Development Indicators
Insufficient savings
                                                          Figure 3: Adjusted net savings, %


0.40


0.25


                                                                                                                                                                                       South Africa
                                                                                                                                                                                       China
0.10                                                                                                                                                                                   Brazil
                                                                                                                                                                                       Russia
                                                                                                                                                                                       India
                                                                                                                                                                                       AVG World
-0.05


-0.20
        1976
               1977
                      1978
                             1979
                                    1980
                                           1981
                                                  1982
                                                         1983
                                                                1984
                                                                       1985
                                                                              1986
                                                                                     1987
                                                                                            1988
                                                                                                   1990
                                                                                                          1991
                                                                                                                 1992
                                                                                                                        1993
                                                                                                                               1994
                                                                                                                                      1995
                                                                                                                                             1996
                                                                                                                                                    1997
                                                                                                                                                           1998
                                                                                                                                                                  1999
                                                                                                                                                                         2000
                                                                                                                                                                                2001
                                                                         Source: Based on World Bank data
-20%
                 -15%
                        -10%
                               -5%
                                     0%
                                          5%
                                               10%
                                                     15%
1990/02
1990/04
1991/02
1991/04
1992/02
1992/04
1993/02
1993/04
1994/02
1994/04
1995/02
1995/04
1996/02
1996/04
1997/02
1997/04
1998/02
1998/04
1999/02
1999/04
2000/02
2000/04
2001/02
2001/04
2002/02
2002/04
2003/02
2003/04
2004/02
2004/04
2005/02
2005/04
2006/02
2006/04
2007/02
2007/04
2008/02
2008/04
2009/02
                                                                                                                                                                         Declining exchange rate
                                                           Figure 4: Nominal effective exchange rate of the rand: Average for 15 trading partners (quarterly % change)


2009/04
Comparative optimism
        Figure 5:                        Figure 6:


Source: Pew Global Attitudes
                                                     Source: BBC World Service Poll, 2004.
Project Survey
Recent optimism

Table IV: South Africans believe the country is going in the right direction


                                               Nov 09                   May 09                     May 08


Country is going           Male                   60%                      45%                      47%
in right direction

                          Female                  53%                      41%                      44%


                               Source: IPSOR Markinor, Pulse of the People Public Opinion Series
Hope and the future

Once you choose hope, anything is possible -
  Christopher Reeve

We are all in the gutter, but some of us are looking at
 the stars - Oscar Wilde

To eat bread without hope is still slowly to starve to
  death - Pearl S. Buck

Who hopes for what he already has? But if we hope
 for what we do not yet have, we wait for it patiently
 - Apostle Paul in letter to Romans (Rom 8:24-25,
 NIV)
From hope towards an ethics of
                   sustainability


•   Factoring sustainability into South
    Africa’s future is in the first place to
    start acting on the individual and
    collective hope we have as a nation.

•   This hope can translate into deep
    changes in attitude and behaviour.
Wedges for change

•   material wedges to start bending the trends of
    material and resource use as well as the
    generation of pollution and waste.

•   lifestyle wedges, such as pressures on conspicuous
    consumption

•   behavioural wedge to change attitudes and
    behaviour
Time will tell whether that optimism
   (quoting Václav Havel) is...

not the conviction that something
         will turn out well,

 but the certainty that something
           makes sense,
  regardless of how it turns out.

Wfs Conference Martin De Wit

  • 1.
    Factoring sustainability into South Africa’s future Martin de Wit Address delivered to World Future Society, 6 May 2010, BMW Pavillion, Cape Town.
  • 2.
    Sustainability • Sustainability in its shortest definition is the capacity to endure • To endure one does not only need material goods, but also a mental and spiritual resilience and set of skills on how to cope.
  • 3.
    Biophysical stress Indicator Result for SA Key aspects Outcome Ecological Footprint 2.8 ha/pp/yr vs. target Carbon Ecologically of 1.8 ha/pp/yr Crop land unsustainable Grazing land 91st out of 134 countries (2009) Environmental 0.508/1.0 Environmental burden Environmentally Performance Index of disease unsustainable 115th of 163 countries Climate change (2010) Air pollution on ecosystems
  • 4.
    Serious stress onhuman wellbeing Indicator Result for SA Key aspects Outcome Corruption 55th out of 180 Increase in perceived corruption in Moderately sustainable Perceptions countries (2008) last 2 years Index Subjective Well 41st out of 79 Happiness, life satisfaction Moderately sustainable Being countries Human 129th out of 182 Life expectancy Humanely Unsustainable Development countries (2007) Literacy index Education Quality of Life 92nd out of 111 Material well-being, life expectancy, Humanely and politically Index countries (2005) political stability, divorce rate, unsustainable community life, climates, unemployment, political freedom, gender equality Happy Planet 118th out of 143 Human well-being and Humanely Unsustainable Index countries (2009) environmental impact
  • 5.
    Recent progress inmaterial wellbeing Figure 1: Gross National Income per capita (constant 2005 prices, Rand per annum) Figure 2: GDP per capita (PPP, constant, 2000$) $10500 $9900 $9300 $8700 $8100 $7500 1972 1974 1976 1978 1980 1982 1984 1986 1988 1990 1992 1994 1996 1998 2000 2002 2004 Source: SA Reserve Bank Source: Nationmaster.com based on World Development Indicators
  • 6.
    Insufficient savings Figure 3: Adjusted net savings, % 0.40 0.25 South Africa China 0.10 Brazil Russia India AVG World -0.05 -0.20 1976 1977 1978 1979 1980 1981 1982 1983 1984 1985 1986 1987 1988 1990 1991 1992 1993 1994 1995 1996 1997 1998 1999 2000 2001 Source: Based on World Bank data
  • 7.
    -20% -15% -10% -5% 0% 5% 10% 15% 1990/02 1990/04 1991/02 1991/04 1992/02 1992/04 1993/02 1993/04 1994/02 1994/04 1995/02 1995/04 1996/02 1996/04 1997/02 1997/04 1998/02 1998/04 1999/02 1999/04 2000/02 2000/04 2001/02 2001/04 2002/02 2002/04 2003/02 2003/04 2004/02 2004/04 2005/02 2005/04 2006/02 2006/04 2007/02 2007/04 2008/02 2008/04 2009/02 Declining exchange rate Figure 4: Nominal effective exchange rate of the rand: Average for 15 trading partners (quarterly % change) 2009/04
  • 8.
    Comparative optimism Figure 5: Figure 6: Source: Pew Global Attitudes Source: BBC World Service Poll, 2004. Project Survey
  • 9.
    Recent optimism Table IV:South Africans believe the country is going in the right direction Nov 09 May 09 May 08 Country is going Male 60% 45% 47% in right direction Female 53% 41% 44% Source: IPSOR Markinor, Pulse of the People Public Opinion Series
  • 10.
    Hope and thefuture Once you choose hope, anything is possible - Christopher Reeve We are all in the gutter, but some of us are looking at the stars - Oscar Wilde To eat bread without hope is still slowly to starve to death - Pearl S. Buck Who hopes for what he already has? But if we hope for what we do not yet have, we wait for it patiently - Apostle Paul in letter to Romans (Rom 8:24-25, NIV)
  • 11.
    From hope towardsan ethics of sustainability • Factoring sustainability into South Africa’s future is in the first place to start acting on the individual and collective hope we have as a nation. • This hope can translate into deep changes in attitude and behaviour.
  • 12.
    Wedges for change • material wedges to start bending the trends of material and resource use as well as the generation of pollution and waste. • lifestyle wedges, such as pressures on conspicuous consumption • behavioural wedge to change attitudes and behaviour
  • 13.
    Time will tellwhether that optimism (quoting Václav Havel) is... not the conviction that something will turn out well, but the certainty that something makes sense, regardless of how it turns out.