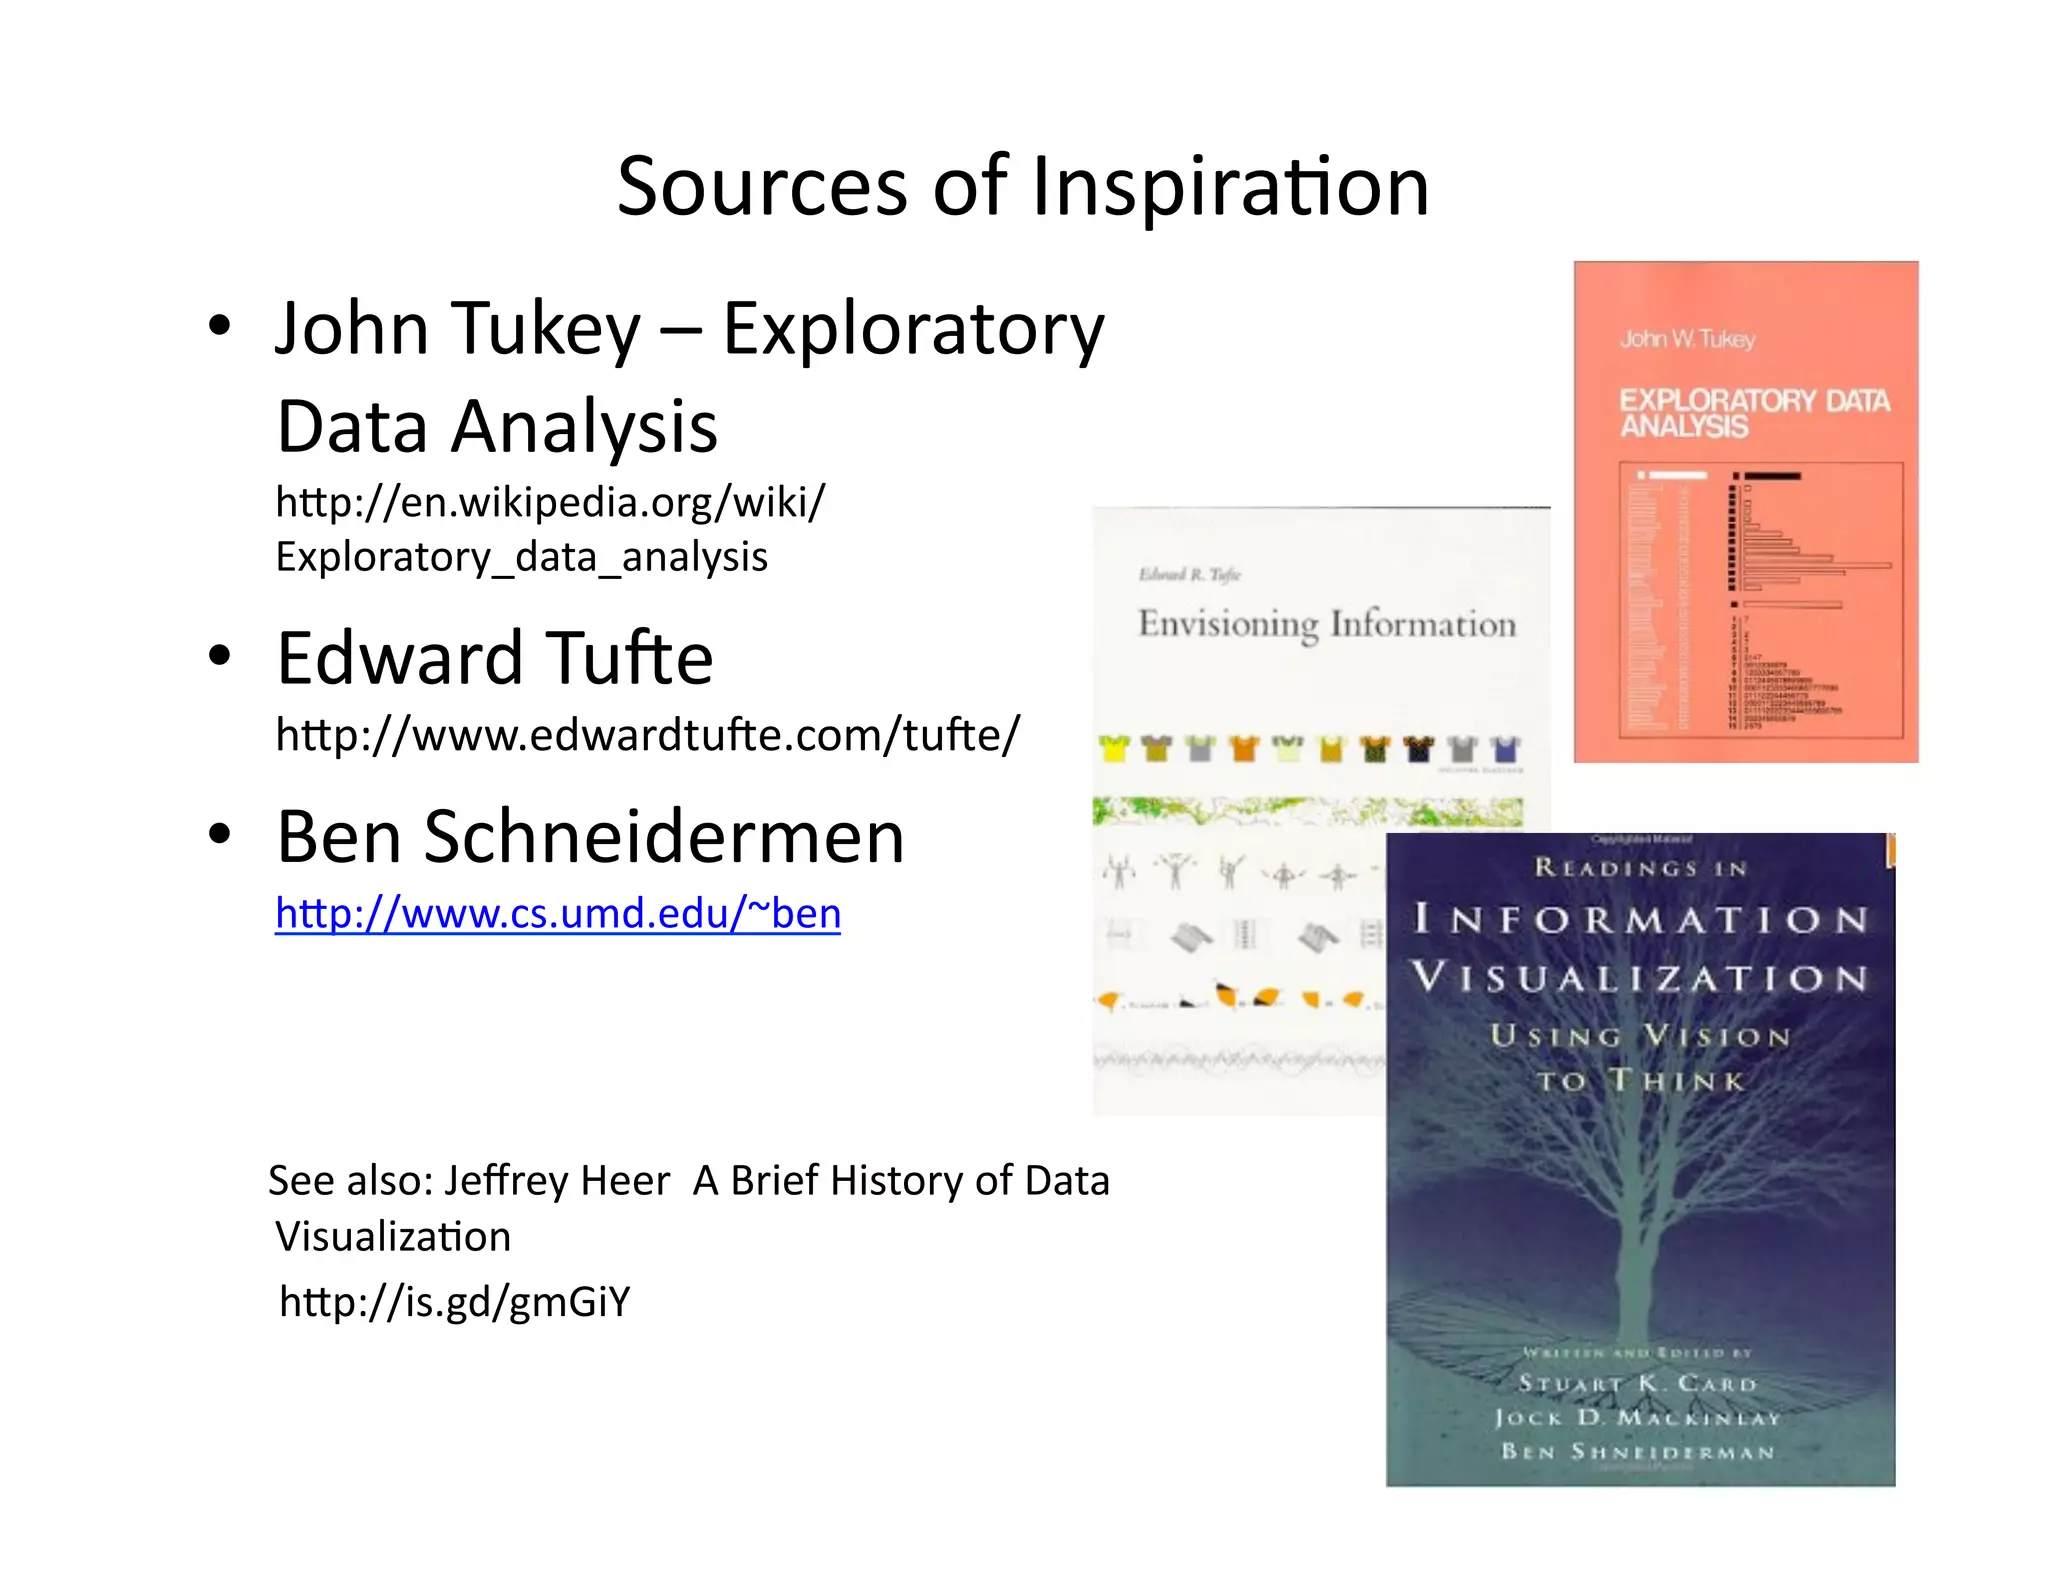
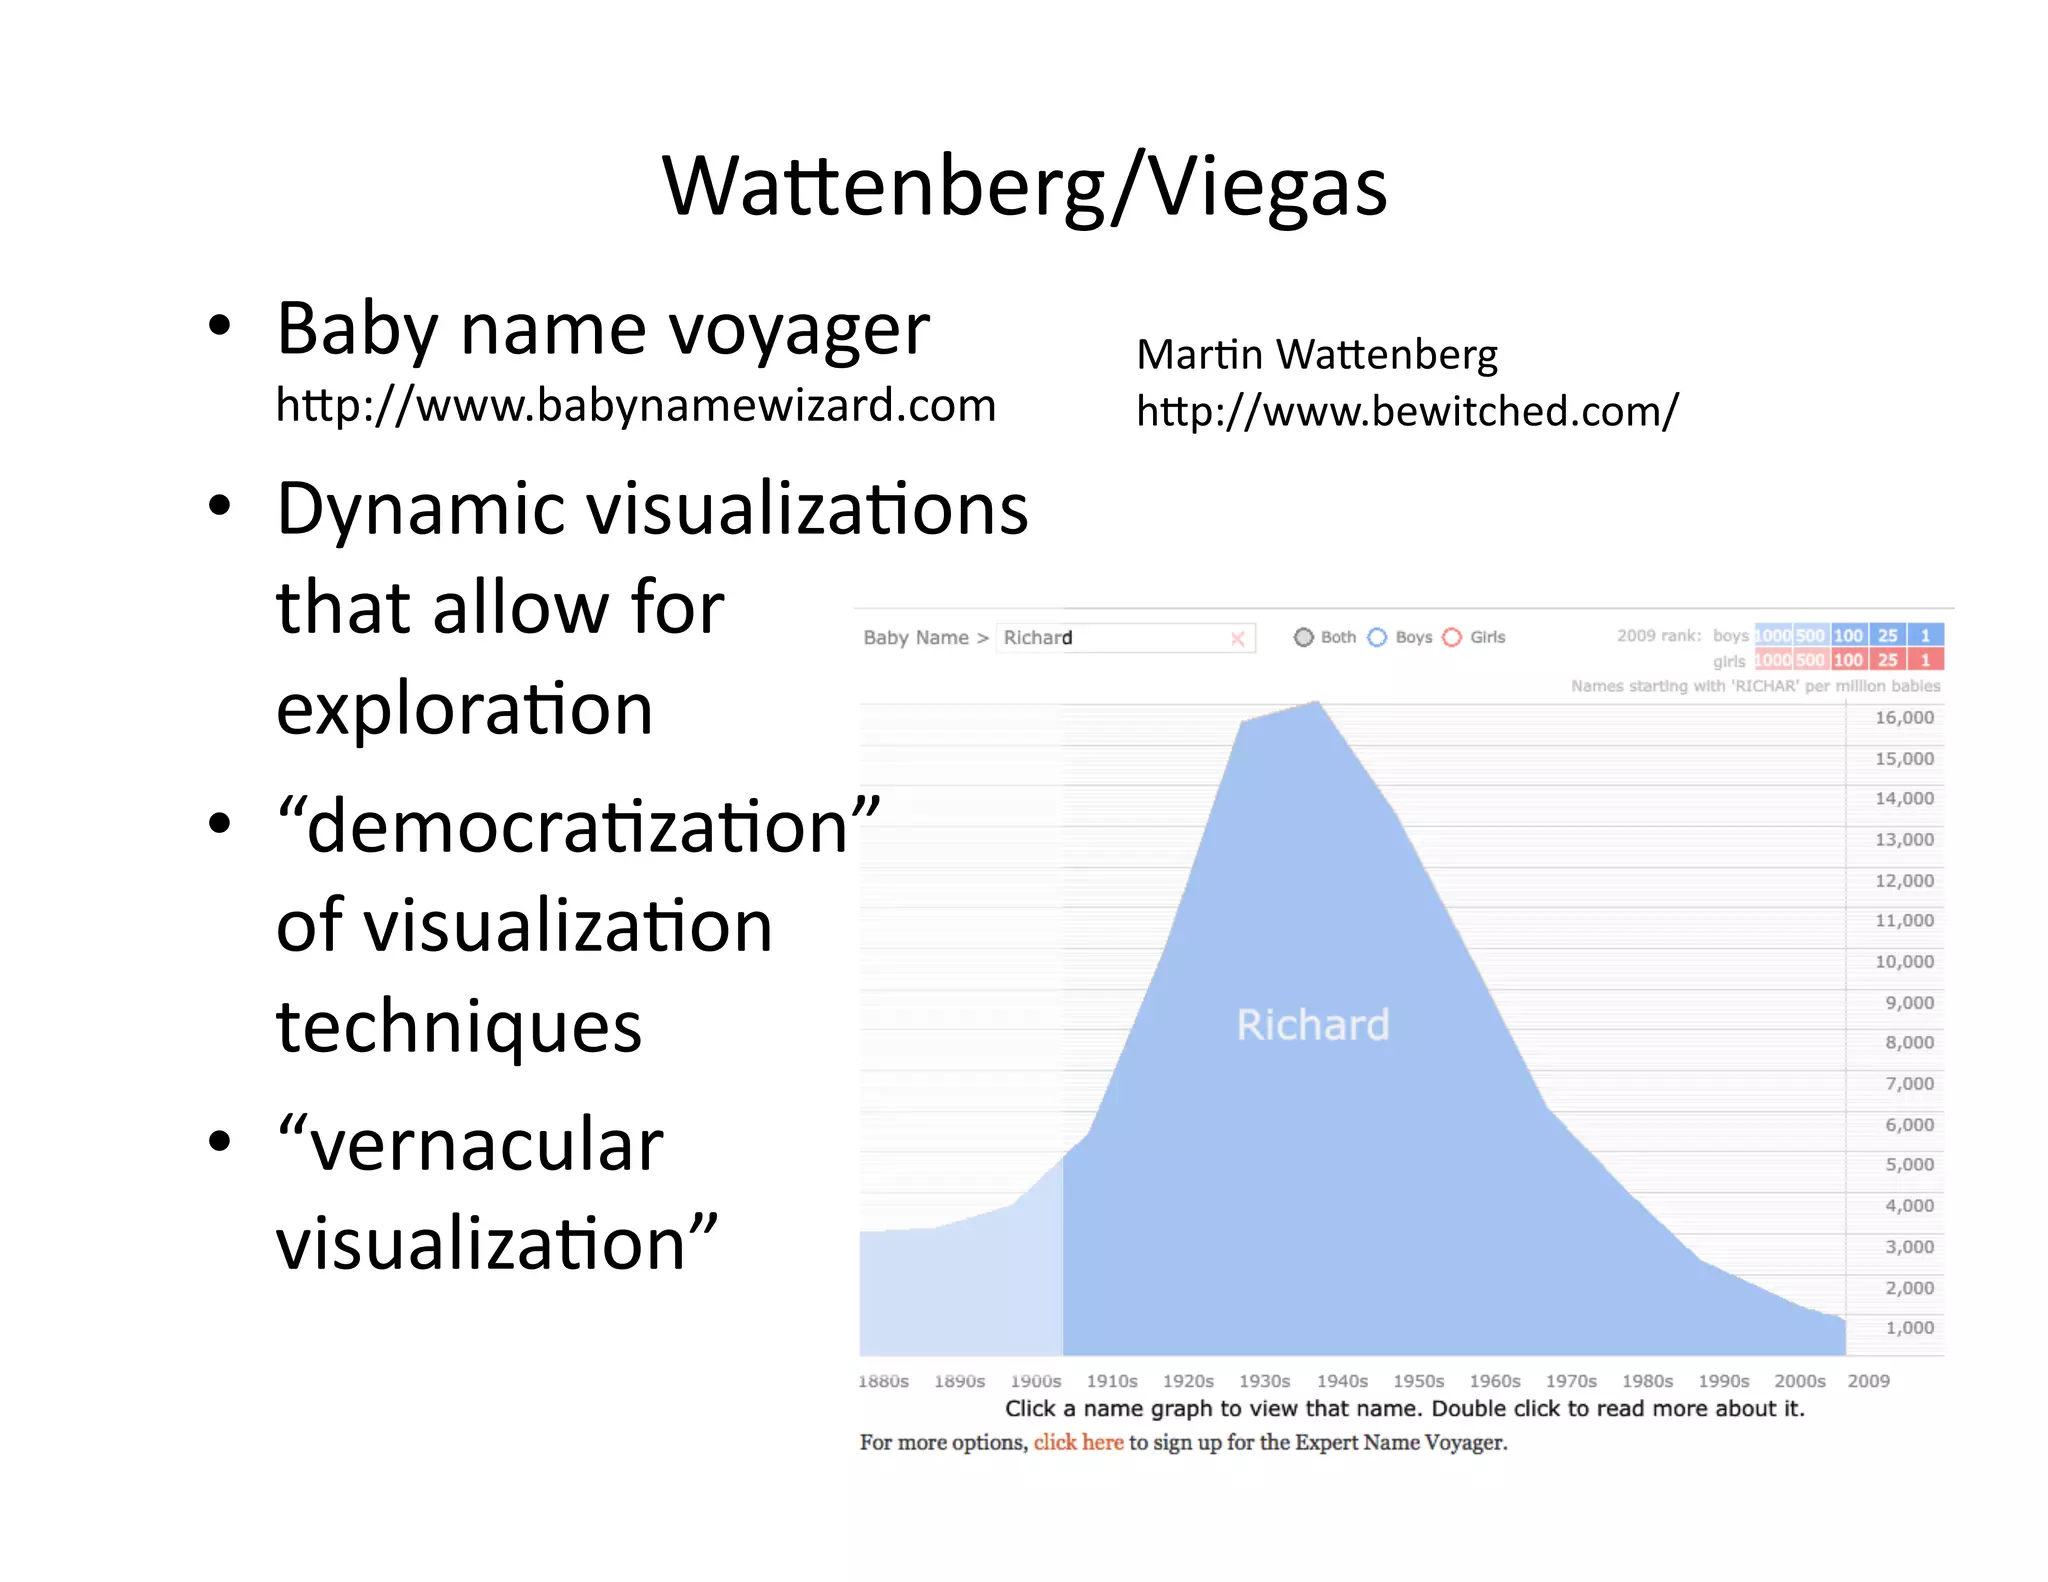
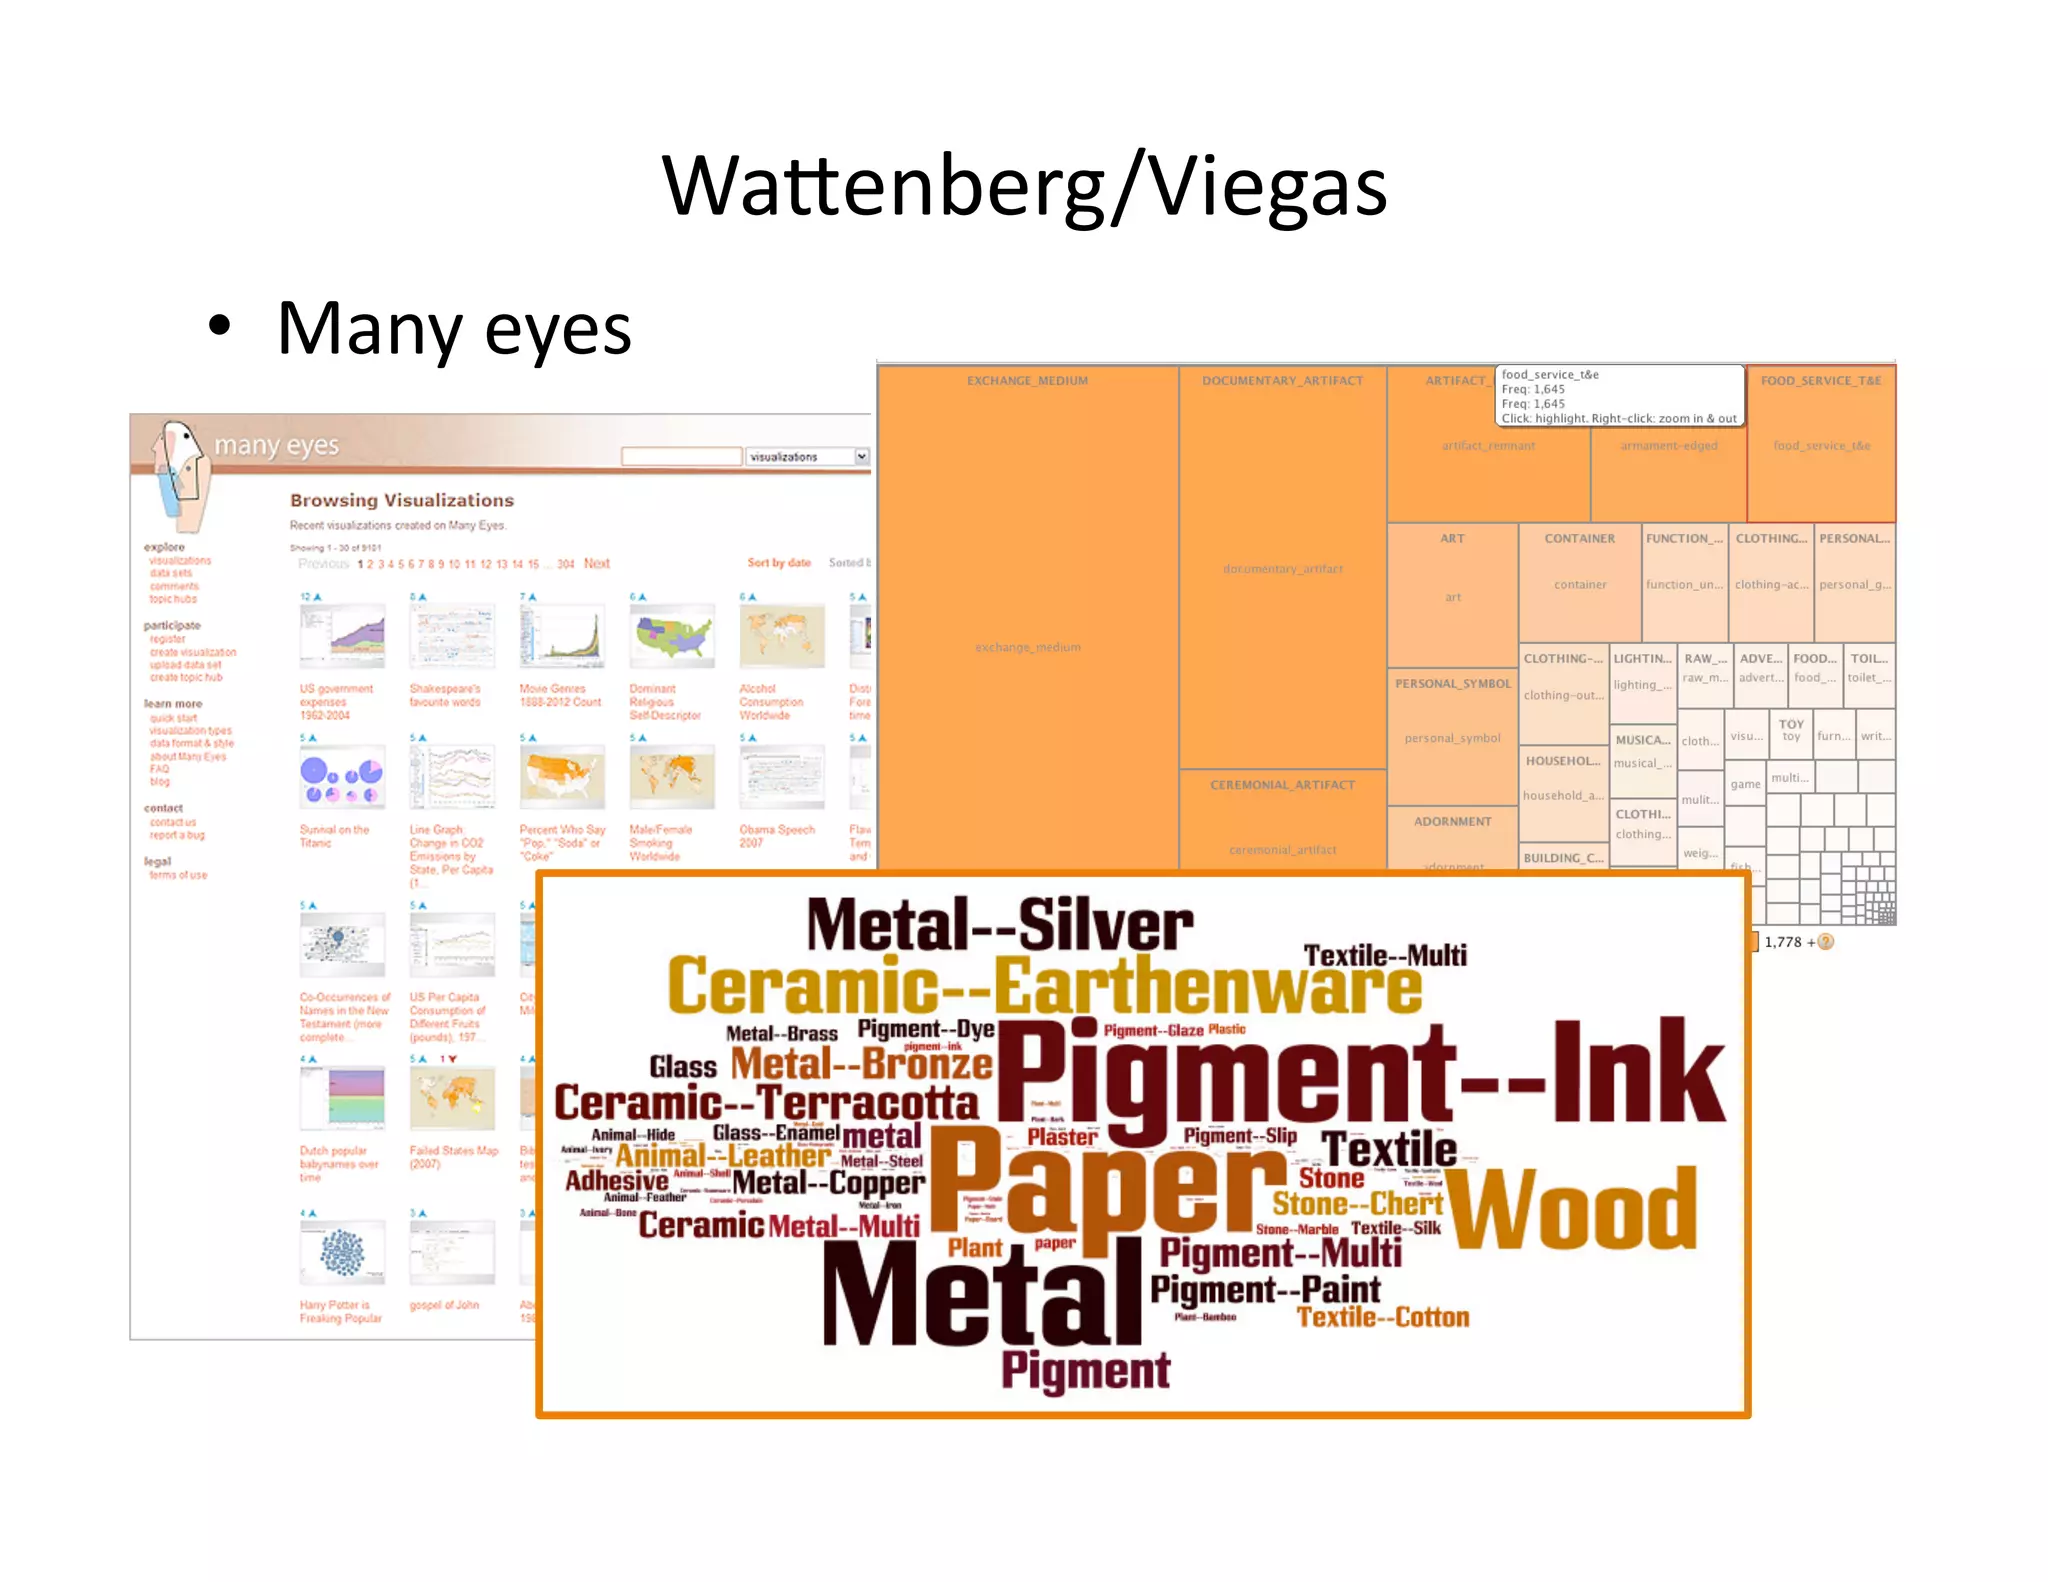
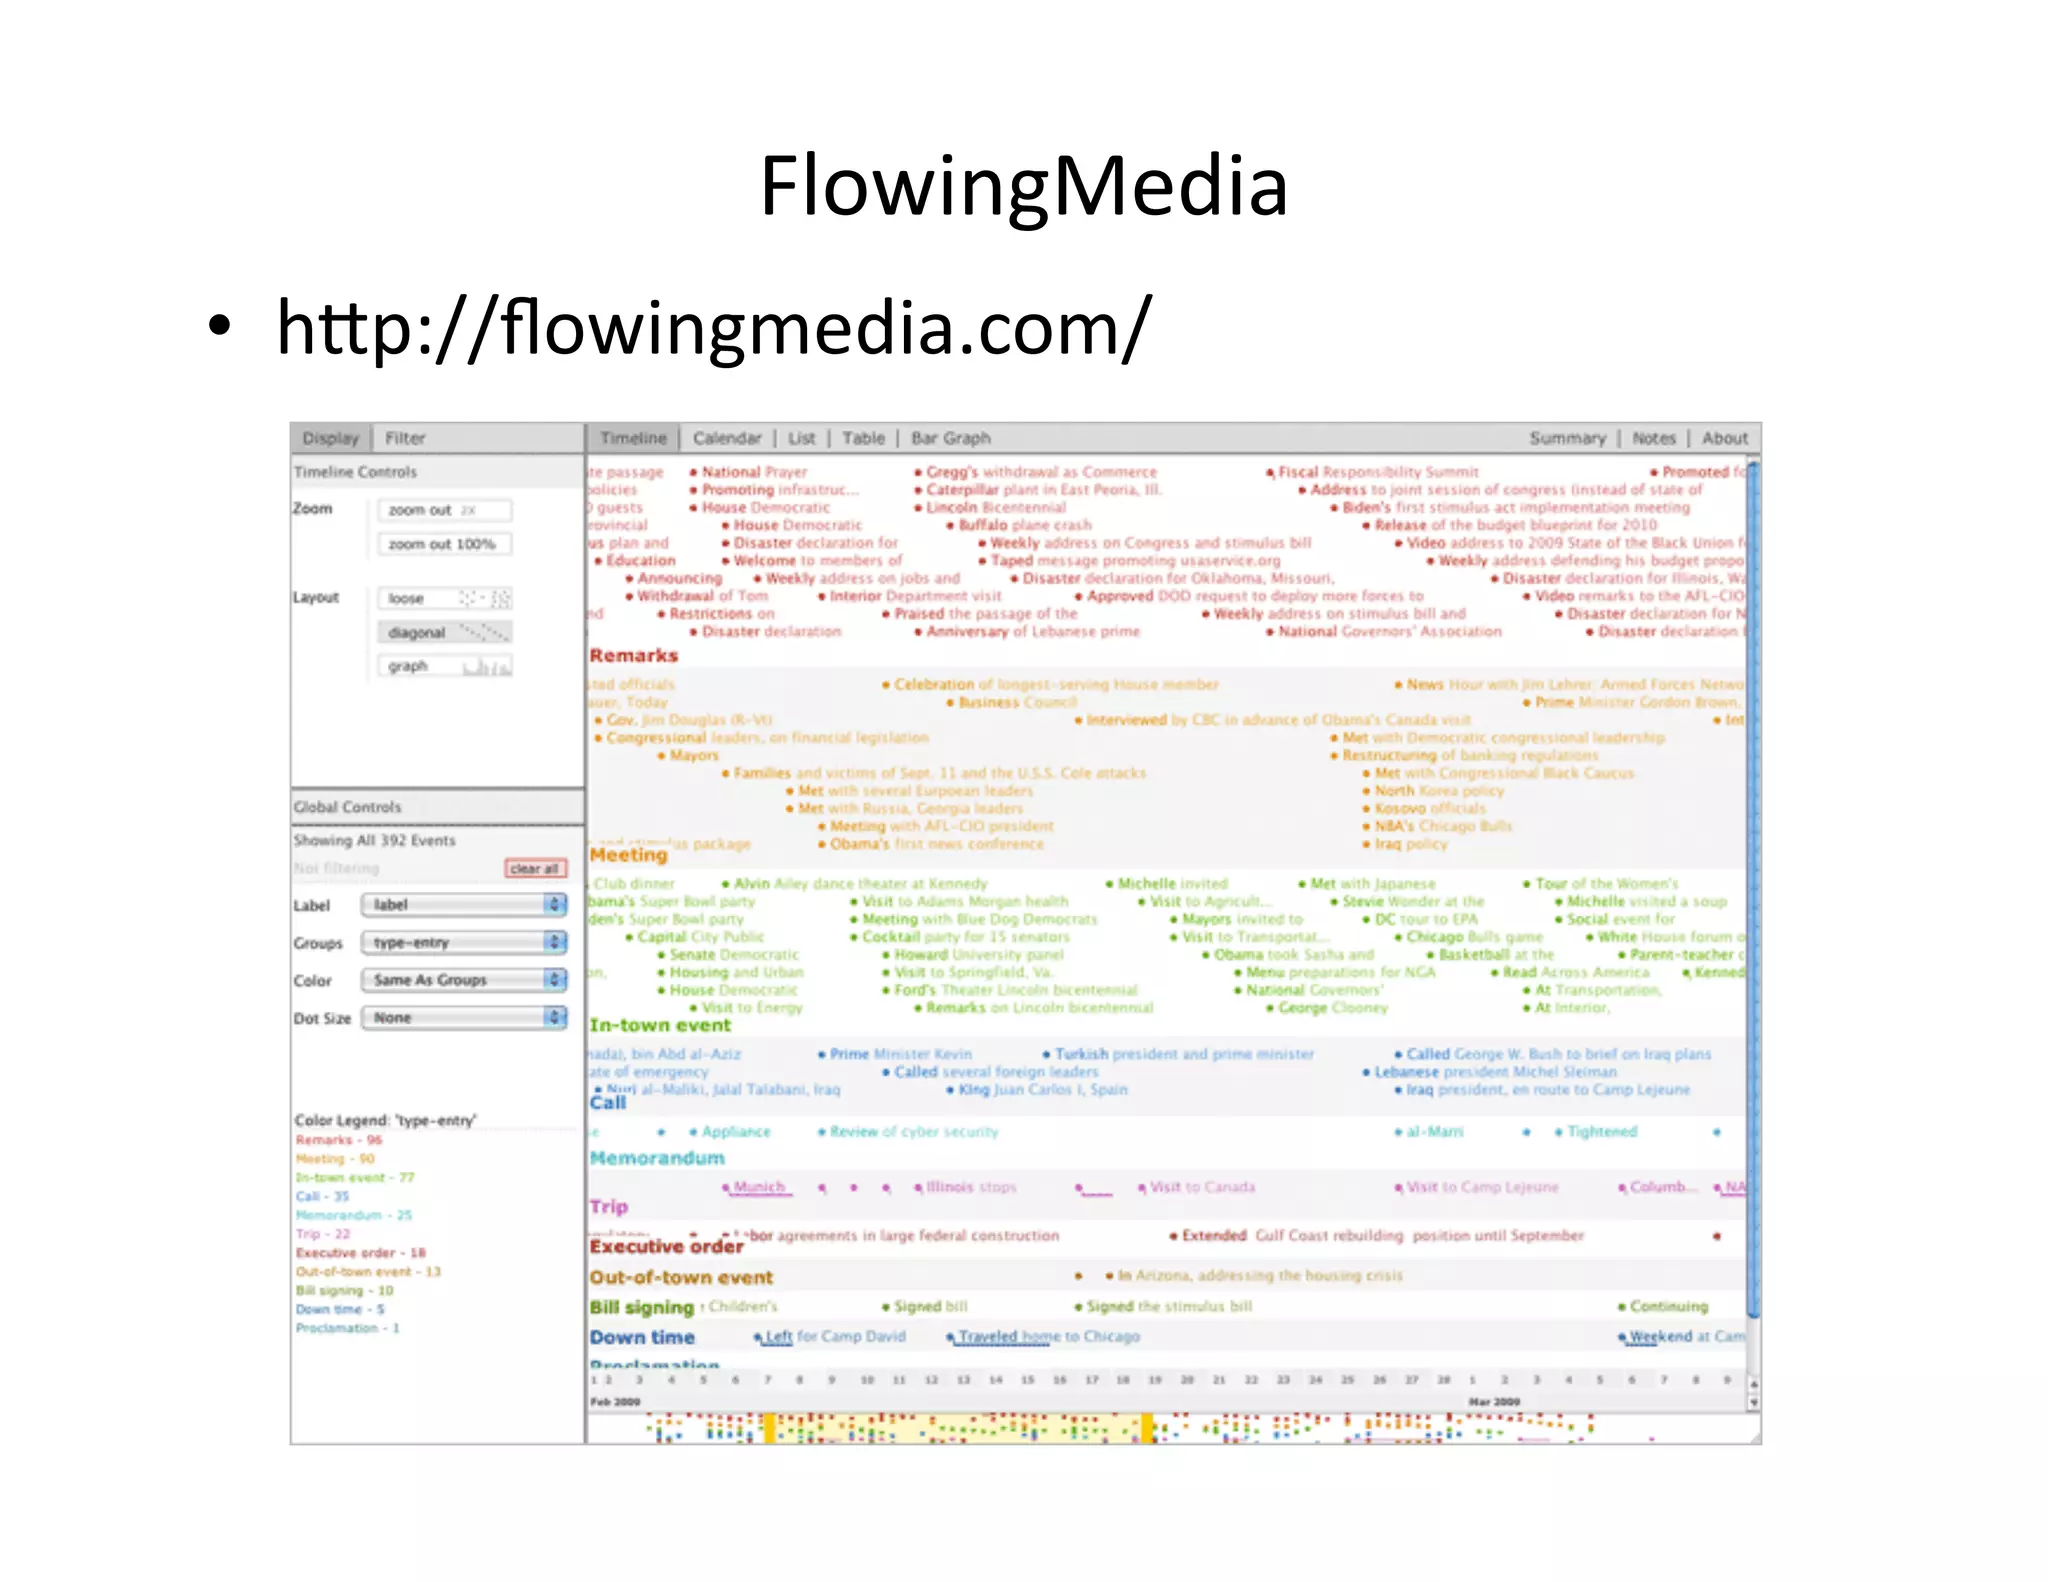
Sources	
  of	
  Inspira/on	
  
•  John	
  Tukey	
  –	
  Exploratory	
  
Data	
  Analysis	
  
h<p://en.wikipedia.org/wiki/
Exploratory_data_analysis	
  
•  Edward	
  TuDe	
  
h<p://www.edwardtuDe.com/tuDe/	
  
•  Ben	
  Schneidermen	
  
h<p://www.cs.umd.edu/~ben	


  See	
  also:	
  Jeffrey	
  Heer	
  	
  A	
  Brief	
  History	
  of	
  Data	
  
Visualiza/on	


  h<p://is.gd/gmGiY	
  
Wa<enberg/Viegas	
  
•  Baby	
  name	
  voyager	
  
h<p://www.babynamewizard.com	
  
•  Dynamic	
  visualiza/ons	
  
that	
  allow	
  for	
  
explora/on	
  
•  “democra/za/on”	
  	
  
of	
  visualiza/on	
  
techniques	
  
•  “vernacular	
  
visualiza/on”	
  
Mar/n	
  Wa<enberg	
  
h<p://www.bewitched.com/	
  
Wa<enberg/Viegas	
  
•  Many	
  eyes	
  	
  
FlowingMedia	
  
•  h<p://flowingmedia.com/	
  
Jeffrey	
  Heer	
  
•  Tools:	
  protovis.org	
  
Tracing	
  Genealogical	
  Data	
  with	
  
TimeNets	
  
h<p://vis.stanford.edu/papers//menets	
  
Jeffrey	
  Heer	
  
•  Collabora/ve	
  visualiza/on	
  
Visualiza/on	
  in	
  the	
  Humani/es	
  
•  Franco	
  MoreX	
  
Map	
  of	
  Sherlock	
  Holmes’	
  Inves/ga/ons	
  
MONK	
  Project	
  
•  h<p://www.monkproject.org/	
  
Cultural	
  Analy/cs	
  
•  Lev	
  Manovich,	
  Director	
  
SoDware	
  Studies	
  
Ini/a/ve	
  
h<p://lab.soDwarestudies.com	
  
•  Visual	
  Analysis	
  Toolkit	
  
•  GigaPixel	
  Presenter	
  
h<p://www.flickr.com/photos/culturevis/4038907270	
  
Cultural	
  Analy/cs	
  
•  Comparison	
  between	
  128	
  pain/ngs	
  by	
  Piet	
  Mondrian	
  (from	
  1904-­‐1917)	
  and	
  168	
  pain/ngs	
  by	
  Mark	
  Rothko	
  (from	
  
1934-­‐1970).	
  	
  
•  X	
  axis	
  -­‐	
  brightness	
  mean	
  
Y	
  axis	
  -­‐	
  satura/on	
  mean	
  
•  One	
  interes/ng	
  thing	
  revealed	
  by	
  this	
  visualiza/on:	
  in	
  the	
  1940s	
  Rothko	
  starts	
  at	
  exactly	
  the	
  same	
  part	
  of	
  
brightness/satura/on	
  space	
  where	
  Mondrian	
  arrives	
  by	
  1917.	
  
•  h<p://www.flickr.com/photos/culturevis/4396210509	
  
Spa/al	
  History	
  Project	
  
•  h<p://www.stanford.edu/group/spa/alhistory/cgi-­‐bin/site/index.php	
  
Mitchell	
  Whitelaw-­‐	
  Visible	
  Archives	
  
•  h<p://visiblearchive.blogspot.com/	
  
Commons	
  Explorer	
  
•  h<p://visiblearchive.blogspot.com/2010/03/commonsexplorer.html	
  
Urban,	
  Adamczyck,	
  Twidale	
  
Adamczyck	
  
•  YouTube	
  MCN	
  2010	
  channel	
  
h<p://bit.ly/dpFYlw	
  
•  Richard	
  J.	
  Urban	
  
Graduate	
  School	
  of	
  Library	
  &	
  Informa/on	
  Science	
  
University	
  of	
  Illinois	
  
rjurban@illinois	
  
h<p://www.richardurban.net	
  

Museum Information Visualization Research Files

  • 2.
    Sources  of  Inspira/on   •  John  Tukey  –  Exploratory   Data  Analysis   h<p://en.wikipedia.org/wiki/ Exploratory_data_analysis   •  Edward  TuDe   h<p://www.edwardtuDe.com/tuDe/   •  Ben  Schneidermen   h<p://www.cs.umd.edu/~ben              See  also:  Jeffrey  Heer    A  Brief  History  of  Data   Visualiza/on                h<p://is.gd/gmGiY  
  • 3.
    Wa<enberg/Viegas   •  Baby  name  voyager   h<p://www.babynamewizard.com   •  Dynamic  visualiza/ons   that  allow  for   explora/on   •  “democra/za/on”     of  visualiza/on   techniques   •  “vernacular   visualiza/on”   Mar/n  Wa<enberg   h<p://www.bewitched.com/  
  • 4.
  • 5.
  • 6.
    Jeffrey  Heer   • Tools:  protovis.org   Tracing  Genealogical  Data  with   TimeNets   h<p://vis.stanford.edu/papers//menets  
  • 7.
    Jeffrey  Heer   • Collabora/ve  visualiza/on  
  • 8.
  • 9.
    •  Franco  MoreX   Map  of  Sherlock  Holmes’  Inves/ga/ons  
  • 10.
    MONK  Project   • h<p://www.monkproject.org/  
  • 11.
    Cultural  Analy/cs   • Lev  Manovich,  Director   SoDware  Studies   Ini/a/ve   h<p://lab.soDwarestudies.com   •  Visual  Analysis  Toolkit   •  GigaPixel  Presenter  
  • 12.
  • 13.
    Cultural  Analy/cs   • Comparison  between  128  pain/ngs  by  Piet  Mondrian  (from  1904-­‐1917)  and  168  pain/ngs  by  Mark  Rothko  (from   1934-­‐1970).     •  X  axis  -­‐  brightness  mean   Y  axis  -­‐  satura/on  mean   •  One  interes/ng  thing  revealed  by  this  visualiza/on:  in  the  1940s  Rothko  starts  at  exactly  the  same  part  of   brightness/satura/on  space  where  Mondrian  arrives  by  1917.   •  h<p://www.flickr.com/photos/culturevis/4396210509  
  • 14.
    Spa/al  History  Project   •  h<p://www.stanford.edu/group/spa/alhistory/cgi-­‐bin/site/index.php  
  • 15.
    Mitchell  Whitelaw-­‐  Visible  Archives   •  h<p://visiblearchive.blogspot.com/  
  • 16.
    Commons  Explorer   • h<p://visiblearchive.blogspot.com/2010/03/commonsexplorer.html  
  • 17.
  • 18.
  • 19.
    •  YouTube  MCN  2010  channel   h<p://bit.ly/dpFYlw   •  Richard  J.  Urban   Graduate  School  of  Library  &  Informa/on  Science   University  of  Illinois   rjurban@illinois   h<p://www.richardurban.net