In 2013 the Mayors Water Council (MWC) released “Municipal Procurement: Procurement Process Improvements Yield Cost-Effective Public Benefits”, a report examining procurement practices in the water infrastructure sector. The report made a business case for considering alternative pipe material so local governments could realize public benefits (e.g., cost, performance, safety). The report suggested the need to change outdated procurement policies, and that the biggest impediment to adopting these changes stemmed from the reluctance of local procurement officials to break from convention.This report presents information from new research that demonstrates the merits of adopting open procurement policies and new practices that apply competitive consideration of alternative pipe materials. These policies will help local officials maximize
resources and practice good governance.
Yaz Emrani, M.S., P.E., Vice President of Carollo Engineers, Inc., and Co-chair of the OC Infrastructure Report Card Executive Committee, discussed the results of the Report Card and the ‘C+’ average grade awarded based on the 12 categories: Aviation (A-); Electric Power (C-); Flood Control and Levees (C-); Ground Transportation (C); Natural Gas (B-); Oil (B-); Parks, Recreation, and Environment (C+); School Facilities (C); Solid Waste (B); Surface Water Quality (D+); Wastewater (B); and Water Supply (B).
Municipalities today are constantly challenged while trying to improve the level of service to their citizens. In this session we will introduce the concept of Smart Water and show how we can lead the charge in providing value to citizens.
Bill Cesanek, co-chair of the APA Water and Planning Network, discusses the value of land use planning in achieving improved water efficiency for the 2020 Central Texas Water Conservation Symposium hosted by the Texas Living Waters Project.
9/8 THUR 12:15 | Keynote Ellen Dunham-JonesAPA Florida
In line with the conference theme, “What Will We Do Now?”,Ellen Dunham-Jones will open the conference with a discussion on how to transform the sprawl of suburbia into a more resilient and more urban future. Ms. Dunham-Jones co-authored
the book, “Retrofitting Suburbia”, which catalogs a full range of strategies from full-scale town center redevelopment to transformations of big box sites into churches, call centers, and public libraries to incremental strategies such as improving accessibility, so residents can age in place. Ms. Dunham-Jones is an award-winning architect, professor at the Georgia Institute of Technology and a leading authority on suburban redevelopment. She teaches and researches contemporary architectural urban design studios and theory. Her insights and their potential
for application in Florida should be of particular interest as communities come to terms with sprawling development patterns in the face of fewer available resources needed to serve them.
When it comes to selecting pipe for your trenchless application, there is no shortage of options — steel, iron, clay, concrete and plastic. Given the plethora of choices, the decision of which pipe to use for your project can be daunting. What you need is information on what each pipe brings to the table. To help you out, Trenchless Technology contacted pipe associations and manufacturers of the eight pipes typically used in trenchless projects to point out what their particular conduit offers. The information presented is intended to provide just a preliminary glimpse at the different pipe on the market. For more etail information, please contact the manufacturer, pipe association or your consulting engineer. All information presented was provided by the various pipe associations or manufacturers.
A presentation about protecting clean water during construction projects. Presented by Robert Roseen of Geosyntec Consulting during the Buzzards Bay Coalition's 2014 Decision Makers Workshop series. Learn more at www.savebuzzardsbay.org/DecisionMakers
Financial modeling of public private partnership in wastewater treatmentIJARIIT
This article basically determines the assets in which water resources are polluted the environment by anthropogenic
sources like agricultural and household formation. As matter of fact, Public think that the environmental impact of wastewater
pollution has increased day by day many conventional wastewater treatment techniques like chemical adsorption. Hence the
activated sludge is applied to remove the pollution but there are still some limitations which have high operation costs. The use
of waste water treatment in public and private works as a different medium is receiving increased interest so that its low
operation and maintenance costs. As per as the water treatment is concerned it is easy to have a good effectiveness and ability
for degrading contaminant. Hence, this paper reviews is the use of waste water treatment technologies to remove contaminants
from wastewater like a high oxidant which represent the main pollutants in wastewater as per as a financial modeling of the
public private partnership of wastewater treatment.
Presentation hold during EIP Water Conference in Porto, as part of the Porto Water Innovation Week in Session 8a “Water and the circular economy, part 3 – cities and water”
There are common misconceptions among design engineers regarding pipe stiffness, pipe
deflection, impact strength, abrasion, and design life when comparing PVC and fiberglass
(FRP) sewer pipes. When correct evaluations are done, PVC is the product of choice.
More Related Content
Similar to municipal procurement competitive bidding for pipes demonstrates significant local cost savings
9/8 THUR 12:15 | Keynote Ellen Dunham-JonesAPA Florida
In line with the conference theme, “What Will We Do Now?”,Ellen Dunham-Jones will open the conference with a discussion on how to transform the sprawl of suburbia into a more resilient and more urban future. Ms. Dunham-Jones co-authored
the book, “Retrofitting Suburbia”, which catalogs a full range of strategies from full-scale town center redevelopment to transformations of big box sites into churches, call centers, and public libraries to incremental strategies such as improving accessibility, so residents can age in place. Ms. Dunham-Jones is an award-winning architect, professor at the Georgia Institute of Technology and a leading authority on suburban redevelopment. She teaches and researches contemporary architectural urban design studios and theory. Her insights and their potential
for application in Florida should be of particular interest as communities come to terms with sprawling development patterns in the face of fewer available resources needed to serve them.
When it comes to selecting pipe for your trenchless application, there is no shortage of options — steel, iron, clay, concrete and plastic. Given the plethora of choices, the decision of which pipe to use for your project can be daunting. What you need is information on what each pipe brings to the table. To help you out, Trenchless Technology contacted pipe associations and manufacturers of the eight pipes typically used in trenchless projects to point out what their particular conduit offers. The information presented is intended to provide just a preliminary glimpse at the different pipe on the market. For more etail information, please contact the manufacturer, pipe association or your consulting engineer. All information presented was provided by the various pipe associations or manufacturers.
A presentation about protecting clean water during construction projects. Presented by Robert Roseen of Geosyntec Consulting during the Buzzards Bay Coalition's 2014 Decision Makers Workshop series. Learn more at www.savebuzzardsbay.org/DecisionMakers
Financial modeling of public private partnership in wastewater treatmentIJARIIT
This article basically determines the assets in which water resources are polluted the environment by anthropogenic
sources like agricultural and household formation. As matter of fact, Public think that the environmental impact of wastewater
pollution has increased day by day many conventional wastewater treatment techniques like chemical adsorption. Hence the
activated sludge is applied to remove the pollution but there are still some limitations which have high operation costs. The use
of waste water treatment in public and private works as a different medium is receiving increased interest so that its low
operation and maintenance costs. As per as the water treatment is concerned it is easy to have a good effectiveness and ability
for degrading contaminant. Hence, this paper reviews is the use of waste water treatment technologies to remove contaminants
from wastewater like a high oxidant which represent the main pollutants in wastewater as per as a financial modeling of the
public private partnership of wastewater treatment.
Presentation hold during EIP Water Conference in Porto, as part of the Porto Water Innovation Week in Session 8a “Water and the circular economy, part 3 – cities and water”
Similar to municipal procurement competitive bidding for pipes demonstrates significant local cost savings (20)
There are common misconceptions among design engineers regarding pipe stiffness, pipe
deflection, impact strength, abrasion, and design life when comparing PVC and fiberglass
(FRP) sewer pipes. When correct evaluations are done, PVC is the product of choice.
The Health, Safety, and Environmental Performance of PVC PipeManishPatel169454
PVC pipe is extensively utilized worldwide for water and sewer systems, owing to its proven track record of health and safety. Throughout its more than 70 years of use, PVC pipe has undergone rigorous evaluation and approval processes by governmental and accredited third-party testing and certification agencies. These assessments have consistently demonstrated that PVC pipe is a safer and healthier option compared to pipes made from alternative materials.
introduction to molecular oriented polyvinyl chloride pvco pipeManishPatel169454
The manufacturing process for PVCO causes realignment of the molecular structure
from random orientation to circumferential orientation. This increases the material’s
mechanical strength and toughness. Once completed, PVCO pipe has an HDB of 7,100
psi. Owing to PVCO’s different HDB values, the dimension ratio (DR) classification for
conventional PVC is not used for PVCO. Instead, PVCO is referenced only by pressure
class (PC) or pressure rating (PR).
This document covers PVC pressure pipe for potable water, reclaimed water, and sewer forcemain systems; and PVC non-pressure pipe for storm sewer and sanitary sewer systems. All pipes are made in lengths that are assembled at the job site. Each length has a belled end with a elastomeric gasket such that
each pipe length’s spigot end fits inside the belled end of the next pipe length.Environmental Product Declaration Program Operator
This document covers PVC and PVCO pressure pipe for potable water, reuse water, and sanitary force main systems; and PVC nonpressure pipe for gravity storm water and sanitary sewer systems. All pipes are made in lengths that are assembled at the job site. Each length has a belled end with a elastomeric gasket such that each pipe length’s spigot end fits inside the belled end of the next pipe length.
This document covers PVC and PVCO pressure pipe for potable water, reuse water, and sanitary force main systems; and PVC nonpressure pipe for gravity storm water and sanitary sewer systems. All pipes are made in lengths that are assembled at the job site. Each length has a belled end with a elastomeric gasket such that each pipe length’s spigot end fits inside the belled end of the next pipe length.
This document has been developed by the Uni-Bell PVC Pipe Association for use as a field installation guide. General information regarding the correct installation of gasketed-joint solid-wall PVC sewer pipe is included. Relevant product standards are:
ASTM D3034 “Standard Specification for Type PSM Poly (Vinyl Chloride) (PVC) Sewer Pipe and Fittings”
ASTM F679 “Standard Specification for Poly (Vinyl Chloride) (PVC) Large-Diameter Plastic Gravity Sewer Pipe and Fittings”
For more detailed technical information and for information on profile-wall PVC pipes, consult the pipe manufacturer or refer to ASTM D2321, “Standard Practice for Underground Installation of Thermoplastic Pipe for Sewers and Other Gravity-Flow Applications..” The Handbook of PVC Pipe: Design and Construction provides additional guidance on PVC pipe design and installation. For information on this publication, please contact Uni- Bell
hydraulic analysis pumping costs for pvc and ductile iron pipeManishPatel169454
This paper confronts the misleading hydraulic assertions put forth by the Ductile Iron Pipe Research Association (DIPRA) and demonstrates that, when utilizing industry-accepted data, PVC pipe emerges as more energy-efficient, cost-effective, and sustainable compared to ductile iron (DI) pipe. DIPRA contends that DI pipe incurs lower pumping costs than PVC pipe, attributing this to DI's larger inside diameters (ID) compensating for PVC's superior flow characteristics. However, the brochures and online calculator provided by DIPRA contain misleading information and flawed hydraulic assumptions, ultimately leading to biased results.
This document has been developed by the Uni-Bell PVC Pipe Association for design and installation of
PVC fittings where solid-wall PVC pipe is used in non-pressure applications.
The guide provides information on the wide range of fittings that are available for various dimension
ratios and outside diameters of PVC pipe through 60-inch.
Also included is information on installation practices that are intended to optimize the performance of
PVC fittings.
Wastewater conveyance generally falls into two categories: gravity flow and pressure flow. The mostcommon way to transport wastewater is through downward-sloped pipe by gravity flow.
When gravity sewers are not possible or economically practical, pressure from a lift station is used to convey wastewater through a pipe known as a “force main.”
WASTEWATER SYSTEMS
Wastewater conveyance generally falls into two
categories: gravity flow and pressure flow. The most
common way to transport wastewater is through
downward-sloped pipe by gravity flow. When gravity
sewers are not possible or economically practical,
pressure from a lift station is used to convey wastewater
through a pipe known as a “force main.”
This document specifically addresses internalpressure design of PVC force mains. Design of lift
stations is not included, although both single-pump
and multiple-pump scenarios are addressed.
ENVIRONMENTAL PRODUCT DECLARATIONS FOR UNDERGROUND PIPINGManishPatel169454
Assessment of environmental claims for materials and
products used in underground piping infrastructure can be a
daunting task, since there are many widely varying methods
that can provide contradictory results. The most logical
way to ensure valid sustainability assessment is to use an
internationally recognized, third-party certified method like
an Environmental Product Declaration (EPD).
Our mission is to promote use of longer-life, lower-maintenance, corrosion-proof PVC pipe in water and wastewater systems – for real sustainability, strength and long-term asset managemen
Uni-Bell PVC Pipe Association ENVIRONMENTAL PRODUCT DECLARATIONManishPatel169454
Our mission is to promote use of longer-life, lower-maintenance, corrosion-proof PVC pipe in water and wastewater systems – for real sustainability, strength and long-term asset managemen
Our mission is to promote use of longer-life, lower-maintenance, corrosion-proof PVC pipe in water and wastewater systems – for real sustainability, strength and long-term asset management
Competitive bidding for pipes Demonstrates Significant Local Cost SavingsManishPatel169454
American cities, adopting the use of advanced technology and better approaches to clean water and sewer are common and often required by law. Cities providing public water delivery have not only grown in population size and in number, but also in their attitudes toward public health, and innovations involving system
designs, technologies and accepted practices. In the 19th century cast iron was added to the common use of clay, lead and wooden pipes by cities to convey water and wastewater. In the 20th century, continued innovation carried ductile iron, concrete
and cement, and plastic pipes into the market. In the 21st century, new generations of plastics, advanced composites, and other materials are being added to a long list of
viable piping materials. Technological advancements in pipe materials have helped to support a growing national population while continuing to improve on cost and performance and achieve public health protection goals to guard against waterborne
parasites and toxic contaminants.
NO1 Uk best vashikaran specialist in delhi vashikaran baba near me online vas...Amil Baba Dawood bangali
Contact with Dawood Bhai Just call on +92322-6382012 and we'll help you. We'll solve all your problems within 12 to 24 hours and with 101% guarantee and with astrology systematic. If you want to take any personal or professional advice then also you can call us on +92322-6382012 , ONLINE LOVE PROBLEM & Other all types of Daily Life Problem's.Then CALL or WHATSAPP us on +92322-6382012 and Get all these problems solutions here by Amil Baba DAWOOD BANGALI
#vashikaranspecialist #astrologer #palmistry #amliyaat #taweez #manpasandshadi #horoscope #spiritual #lovelife #lovespell #marriagespell#aamilbabainpakistan #amilbabainkarachi #powerfullblackmagicspell #kalajadumantarspecialist #realamilbaba #AmilbabainPakistan #astrologerincanada #astrologerindubai #lovespellsmaster #kalajaduspecialist #lovespellsthatwork #aamilbabainlahore#blackmagicformarriage #aamilbaba #kalajadu #kalailam #taweez #wazifaexpert #jadumantar #vashikaranspecialist #astrologer #palmistry #amliyaat #taweez #manpasandshadi #horoscope #spiritual #lovelife #lovespell #marriagespell#aamilbabainpakistan #amilbabainkarachi #powerfullblackmagicspell #kalajadumantarspecialist #realamilbaba #AmilbabainPakistan #astrologerincanada #astrologerindubai #lovespellsmaster #kalajaduspecialist #lovespellsthatwork #aamilbabainlahore #blackmagicforlove #blackmagicformarriage #aamilbaba #kalajadu #kalailam #taweez #wazifaexpert #jadumantar #vashikaranspecialist #astrologer #palmistry #amliyaat #taweez #manpasandshadi #horoscope #spiritual #lovelife #lovespell #marriagespell#aamilbabainpakistan #amilbabainkarachi #powerfullblackmagicspell #kalajadumantarspecialist #realamilbaba #AmilbabainPakistan #astrologerincanada #astrologerindubai #lovespellsmaster #kalajaduspecialist #lovespellsthatwork #aamilbabainlahore #Amilbabainuk #amilbabainspain #amilbabaindubai #Amilbabainnorway #amilbabainkrachi #amilbabainlahore #amilbabaingujranwalan #amilbabainislamabad
Water scarcity is the lack of fresh water resources to meet the standard water demand. There are two type of water scarcity. One is physical. The other is economic water scarcity.
Industrial Training at Shahjalal Fertilizer Company Limited (SFCL)MdTanvirMahtab2
This presentation is about the working procedure of Shahjalal Fertilizer Company Limited (SFCL). A Govt. owned Company of Bangladesh Chemical Industries Corporation under Ministry of Industries.
Saudi Arabia stands as a titan in the global energy landscape, renowned for its abundant oil and gas resources. It's the largest exporter of petroleum and holds some of the world's most significant reserves. Let's delve into the top 10 oil and gas projects shaping Saudi Arabia's energy future in 2024.
Cosmetic shop management system project report.pdfKamal Acharya
Buying new cosmetic products is difficult. It can even be scary for those who have sensitive skin and are prone to skin trouble. The information needed to alleviate this problem is on the back of each product, but it's thought to interpret those ingredient lists unless you have a background in chemistry.
Instead of buying and hoping for the best, we can use data science to help us predict which products may be good fits for us. It includes various function programs to do the above mentioned tasks.
Data file handling has been effectively used in the program.
The automated cosmetic shop management system should deal with the automation of general workflow and administration process of the shop. The main processes of the system focus on customer's request where the system is able to search the most appropriate products and deliver it to the customers. It should help the employees to quickly identify the list of cosmetic product that have reached the minimum quantity and also keep a track of expired date for each cosmetic product. It should help the employees to find the rack number in which the product is placed.It is also Faster and more efficient way.
Student information management system project report ii.pdfKamal Acharya
Our project explains about the student management. This project mainly explains the various actions related to student details. This project shows some ease in adding, editing and deleting the student details. It also provides a less time consuming process for viewing, adding, editing and deleting the marks of the students.
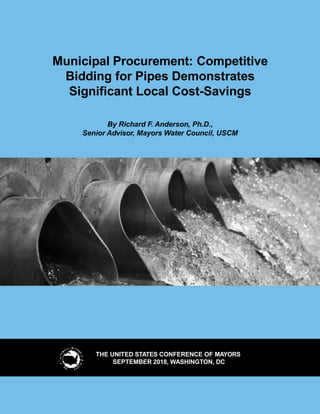
municipal procurement competitive bidding for pipes demonstrates significant local cost savings
1. THE UNITED STATES CONFERENCE OF MAYORS
SEPTEMBER 2018, WASHINGTON, DC
Municipal Procurement: Competitive
Bidding for Pipes Demonstrates
Significant Local Cost-Savings
By Richard F. Anderson, Ph.D.,
Senior Advisor, Mayors Water Council, USCM
2. THE UNI
TED ST
ATES CONFERENCE OF MAYORS
Steven K. Benjamin
Mayor of Columbia, SC
President
Bryan K. Barnett
Mayor of Rochester Hills, MI
Vice President
Greg Fisher
Mayor of Louisville, KY
Second Vice President
T
om Cochran
Executive Director and CEO
3. Municipal Procurement: Competitive
Bidding for Pipes Demonstrates
Significant Local Cost-Savings
By Richard F. Anderson, Ph.D.
Senior Advisor
U.S. Conference of Mayors Water Council
July 2018
5. Page 5
MAYOR’S BRIEFING
In today’s American cities, adopting the use of advanced technology and better
approaches to clean water and sewer are common and often required by law. Cities
providing public water delivery have not only grown in population size and in num-
ber, but also in their attitudes toward public health, and innovations involving system
designs, technologies and accepted practices. In the 19th century cast iron was added
to the common use of clay, lead and wooden pipes by cities to convey water and
wastewater. In the 20th century, continued innovation carried ductile iron, concrete
and cement, and plastic pipes into the market. In the 21st century, new generations of
plastics, advanced composites, and other materials are being added to a long list of
viable piping materials. Technological advancements in pipe materials have helped
to support a growing national population while continuing to improve on cost and
performance and achieve public health protection goals to guard against waterborne
parasites and toxic contaminants.
The daunting challenge cities face today is the urgent need to replace hundreds of
thousands of miles of aging and failing pipe. Pipes are the single most costly water and
sewer capital investment category. Mayors want efficient solutions that make the best
use of limited resources without compromising the performance or safety of their water
systems. One solution that municipalities can no longer afford to overlook is opening-
up their procurement processes so that managers have the freedom to consider all suit-
able project materials. Adopting practices and policies that encourage standardized
comparisons of different pipe materials for water, sewer, and stormwater projects pro-
vides mayors with an opportunity to reduce the local cost of pipes and maintain equal
or better public safety and material performance levels. A review of new information
reveals standardized cost comparisons demonstrate significant price point differences
and updating procurement policies can save as much as 30% of capital costs.
Background and Purpose
In 2013 the Mayors Water Council (MWC) released “Municipal Procurement: Pro-
curement Process ImprovementsYield Cost-EffectivePublicBenefits”,a report examining
procurement practices in the water infrastructure sector. The report made a business
case for considering alternative pipe material so local governments could realize public
benefits (e.g., cost, performance, safety). The report suggested the need to change out-
dated procurement policies, and that the biggest impediment to adopting these chang-
es stemmed from the reluctance of local procurement officials to break from convention.
This report presents information from new research that demonstrates the merits of
adopting open procurement policies and new practices that apply competitive consid-
eration of alternative pipe materials. These policies will help local officials maximize
resources and practice good governance.
There are three critical factors to consider when procuring water and sewer pipes:
cost, materials performance, and public safety. This paper examines each of these fac-
tors relying on new standardized comparisons for alternative pipe material cost, and
recent surveys reporting on pipe performance characteristics. Based on standard cost
comparisons between different pipe materials, it can be estimated that applying such
analysis in an open procurement process can yield substantial cost-savings without
having to sacrifice performance or safety.
Local Governments and the Affordability Crisis
Local governments are struggling to deal with historically high costs to provide water
and sewer infrastructure and services. Census estimates from 2015 suggest that cities
and counties spent over $118 billion in the water and sewer sectors, and recovered $114
6. billion (or 96 percent) through rates, charges and fees. Despite recent improvement in
customer revenues, the unrelenting increases in total costs are fueling household afford-
ability impacts that are both significant and widespread. Federal and State financial
assistance has been on the wane for over 30 years, but the U.S. Environmental Protec-
tion Agency (EPA) and State regulators continue to require greater levels of local spend-
ing to accomplish national goals by imposing unfunded mandates on local utilities. Cit-
ies are also facing a challenge to add as much as 25 percent to current water and
sewer capacity to service the expected 80 million new Americans the Census predicts
by 2051. These factors converge at the local level where cities are seeking efficiencies,
innovation and other cost-savings measures to take the pressure off rapidly rising rates.
The American Water Works Association estimates that it will cost over $1.3 trillion to
replace our nation’s water infrastructure. There are an estimated 240,000 water main
breaks/year, $2.6B wasted on lost water and sewer overflows due to aging pipes, and
at least 17% of potable water lost to leakage.
Residential water rates have gone up by 137% since 2000. A 2017 Michigan State
University study projected that water could be unaffordable for 1/3 of Americans in
five years. A 2016 US Government Accountability Office report surveyed ten mid and
large-sized cities with declining populations and found that the cost for water and
wastewater service is almost twice the affordability threshold for low-income custom-
ers in 40 percent of the cities it reviewed, with further rate increases on the way. To
make matters worse, these communities typically have some the oldest infrastructure
and receive the least amount of funding for infrastructure repair projects.
The Magnitude and Trajectory of Local
Investment in Water and Sewer Pipes
Local government spent over $359 billion between 1993 and 2017 on underground
assets. Material failure and replace/repair programs may be poor to excellent based on
factors such as asset management, implementation of best practices, and budget con-
straints. Cost and performance over time are critical elements of system design decisions,
so the magnitude of local pipe investments invites interest in procurement decisions.
A 25-year period (1993-2017) provides a long-term frame of reference and estimate
of cumulative investment. Construction investment in sewer line and pumps and waste-
water line and drains from 1993 to 2017 was $359 billion, while construction invest-
ments in water and sewer/wastewater plants was $313 billion during that same period.
INDICATOR – PIPES, PUMPS AND DRAINS S
E
W
E
R W
A
T
E
R W
A
S
T
E
W
A
T
E
R T
O
T
A
L
CUMULATIVE25-YEARI
N
VES
T
MENT1993-2017($BILLION) 192.4 127.5 39.2 359.1
2017 INVESTMENT ($ BILLION) 8.0 4.4 1.89 14.29
25-YEARA
VE
RA
G
EANNUALG
R
O
W
T
HRA
T
E(
%
) 4.34 1.76 4.9
2016 TO 2017 GROWTH RATE (%) -21.7 -21.4 -12.6
SOURCE: U.S. Census, State and Local Government Construction Spending
Page 6
T
able 1
7. Figure 1
THE COST OF PIPE PROCUREMENT
Pipes are one of largest single cost components of water and sewer/wastewater
systems (EPA estimates that pipes are 60% of project costs). The continual need for local
investments in pipes adds up over time. Spending on pipes can vary widely, (Figure
1 and Table 1), and there is an expectation that a large replacement cost is imminent
as existing pipes, especially cast iron pipe, approaches the end of its design life. The
pipes provide such a basic service in the community that they must perform with cer-
tainty, and that is why the pipe materials in use have undergone dramatic change. For
example, in the drinking water market, the pipes in use today (Table 2) have displaced
most wooden and lead pipes and cast iron and asbestos cement water mains are phas-
ing out. Similar changes have occurred in sewer and storm pipe markets where other
materials such as clay were once predominant.
“As mayor, it is my responsibility to explore options
that will get our rate payers the best bang for the buck.
The open procurement process, allowing the bidding
of different pipe materials, not only forced suppliers
to sharpen their pencils, it ended up saving the city
of Burton over $2 million by using PVC pipe instead
of ductile iron (DI) pipe on our five-phase $25 million
watermain replacement project. Even if we would have
chosen to use DI pipe, the open procurement process
forced the cost reduction of the DI materials that would
have saved about $200,000 in the project.”
~ Burton (
MI
) Mayor Paula Zelenko
Page 7
8. Piping is remarkably inter-changeable and many of today’s modern water systems
use a variety of materials. However, many systems restrict themselves to a single mate-
rial for all uses (e.g. “all storm pipes must be concrete”) or some categories of use
(e.g. “all water pipes 12” and larger must be ductile iron”). These restrictions are often
written into a city or county specification or ordinance and prevent engineers and
contractors from considering otherwise acceptable materials. These restrictions create
a ‘closed’ system, while expanding old standards to include alternative materials pro-
vides for ‘open’ competition.
A sensible local procurement approach can take advantage of changes in pipe
materials not only on a cost basis, but also on their performance characteristics. This
section summarizes several consultant studies recently released that examine cost dif-
ferentials of the major pipe materials based on pipe size and length.
Source: Folkm
an, Steven Ph.D., P
.E., (
March 2018)
These studies have found that communities with open procurement policies have
been able to lower their costs for purchasing pipes even in cases where the same
material is used. In fact, going from a closed to open policy on average can save local
governments 30 percent in capital costs on pipe, or roughly $100,000/mile.
BCC Research and Datahawks reviewed bid documents and interviewed local water
officials in 14 communities (cities and counties). They looked at the use and cost of dif-
ferent pipe materials and different lengths of pipe commonly used by cities, notably
ductile iron and plastic pipe (primarily HDPE and PVC).
Here is what the research found:
t AO FTUJNBUFE 78% P
GTZTUFNT B
M
M
P
XG
P
SP
O
M
ZPOF UZQFP
GNBUFSJBMJOD
F
S
U
B
J
OB
Q
Q
M
JD
B
-
tions (“closed competition”) leading to virtual monopolies.
t 5IF BWFSBHF D
P
T
UU
PS
F
Q
M
B
D
F ESJOLJOH XBUFS QJQFT JOBO iPQFO D
P
N
Q
F
U
J
U
J
P
O
w TZTUFN
is 26% per mile less expensive than in “closed competition” regions.
t FPS TUPSNXBUFS, UIF T
B
W
J
O
H
TGSPN iPQFO D
P
N
Q
F
U
J
U
J
P
O
w BWFSBHF 39% QFS NJMF.
t /BUJPOBMMZ, iPQFO D
P
N
Q
F
U
J
U
J
P
O
w D
P
VM
ET
B
W
F BO FTUJNBUFE $20.5 C
J
M
M
J
P
OG
P
S ESJOLJOH
water and $22.3 billion for storm water in pipe material costs alone over the next
10 years.
Researchers found evidence of the added cost ‘closed’ procurement policies impose
on local governments. The costs result not from any difference of materials, but rather
from a difference of procurement policy:
“Furthermore, ductile iron pipe of the same diameter was found to be less
costly in open bid cities than in closed bid cities: 8-inch ductile iron pipe cost,
on average, $71.69per foot in Port Huron (closed) and $62,39 in Grand Rapids
T
able 2
WHAT KIND OF WATER PIPES ARE UNDERGROUND IN YOUR CITY?
Folkman(2018)estimates thatfour types of
pipe materials make up 91 percentof water mains
t $J
U
JFTP
G
U
FOV
U
J
M
J[F UIFN JOD
PNCJ
O
BU
JPO
Page 8
The four commonly used pipes:
t D
BT
UJ
S
PO ($*
) 28 %
t EVD
U
J
M
F JS
PO (%
*
)28%
t QPM
Z
W
J
O
ZM
DIM
PS
JEF (17$)
22%t BT
CFT
U
PTD
FNFO
U
(A$) 13%
The remaining 9%of pipes used
t IJHI EFO
T
J
U
Z QPM
Z
FU
IZM
FO
F () %
1&
)
t T
U
F
F
M
t NPM
FD
VM
BS
M
ZPSJFO
U
FE 17$ (17$0 )
t D
POD
S
FU
F T
U
FFM
DZM
J
O
EFS($4$)
t PU
IFSNBU
FS
JBM
T
9. Page 9
(closed), in comparison to $58.60 in Livonia (open) and 55.64 in Monroe
(open). Therefore, even when ductile iron is considered by itself, 8-inch pipe
costs in closed bid cities were up to $16.05 higher than in open bid cities,
equivalent to a pipe cost inflation of up to 29%,”(BCC 2017).
A summary table included in the appendix presents selected information for each of
the research reports. The key information includes: pipe material, annual installation in
linear feet, pipe diameter and cost per foot, and while the information presented in the
studies covers 2013 to 2015, we focus on the 2015 cost per foot information, the latest
year of report availability.
Reevaluating the status quo and conducting cost comparisons can lead to choices
that yield benefit to the community and system users. These findings should be of great
interest to local officials that are looking for better options to upgrade their water sys-
tems, stretch resources and keep rates down.
Because the savings accrue at the project level, competition will speed the upgrad-
ing of water infrastructure and enable innovation to help provide clean, safe water and
reduce ongoing maintenance costs.
Pipe Performance Expectations
The American Water Works Association (AWWA) and the American Society for
Testing of Materials (ASTM) established outer diameter wall thickness standards for
pipes made of Cast Iron (CI), Ductile Iron (DI), Poly Vinyl Chloride (PVC), High Density
Polyethylene (HDPE) and Molecularly Oriented Poly Vinyl Chloride (PVCO). The stan-
dards establish a threshold of performance that all pipes are expected to meet. Thus,
pipes that meet these mechanical performance criteria, regardless of pipe material,
satisfy the standards. The standards are broken down by grouping pipe diameter sizes.
The AWWA standards have governed outer diameter (OD) sizes for pipes used
in municipal water systems since the 1970s. OD pipe size standardization for water
systems enable compatibility with connections for valves, hydrants, services and fittings
for different pipe materials and assures complete interchangeability with a minimal
amount of inventory required for operations and maintenance activities. The outer wall
diameter (wall thickness) is the most direct metric of pipe suitability for a project and
includes consideration of hydrostatic design stress (psi).
T
able 3
NUMBER OF REPORTED BREAKS NUMBER OF CITIES PERCENTAGE OF CITIES
1-25 101 35.8
26-50 54 19.1
51-100 47 16.7
101-200 42 14.9
201-300 7 2.5
301-500 11 3.9
> 500 20 7.1
TOTAL 282 100
SOURCE: Anderson, R. 2007, US Conference of Mayors
10. Page 10
These standards address many concerns such as meeting firefighting requirements:
“Fire flow standards require a minimum residual water pressure of 20 pounds per
square inch gauge (psig) during flow. It is common practice to maintain pressures of 60
to 75 psig in industrial and commercial areas and 30 to 50 psig in residential areas.
Distribution system mains and pipes must be designed to withstand these pressures.”
(/BUJPOBM ADBEFNJFT 1SFTT (64), 1982).
Why are pipes failing despite established standards for performance? Standards
describe the mechanical performance necessary for an application, or in the case of the
A/4*//4F 61 4UBOEBSE, UIBUUIF QJQF DPNQMJFTXJUI B
M
MIFBMUI SFHVMBUJPOTG
P
SNBUFSJBMT
that contact drinking water. But pipe standards do not specify what pipe to procure or
the environmental factors that may cause a pipe to fail prematurely such as the local soil
corrosivity, seismic conditions, or use. For existing pipe, age is also an important factor.
There is a growing body of information that characterizes the general decline of
infrastructure, and more specifically, breaks in water mains and sewer pipes. The
AWWA (2012) released a landmark report on underground infrastructure (pipes) that
unveiled the extent of decline and the urgency of addressing it. An AWWA follow-up
survey expressed this, “The top concern in the AWWA surveys for 2016 and 2017
is ‘renewal and replacement (R&R)’ of aging water and wastewater infrastructure”,
(AWWA 2017). Additionally, the American Society of Civil Engineers (ASCE) has
opined that water and wastewater infrastructure in America gets a D- grade in 2009,
(ASCE 2009); and a slight improvement to a D grade in 2017, (ASCE 2017). The EPA
has similar findings.
Two surveys provide local-government oriented findings: a 330-city survey conduct-
ed by the Conference of Mayors, (2007); and, a more recent survey of 308 utilities
conducted by Utah State University, (2018).
The Conference of Mayors released results of a 330-city survey examining the status
of asset management and condition assessments of water and sewer pipes and pipe
failures (Anderson, 2007). The findings demonstrate that pipe breaks are common (See
Table 3). Asset management programs were more likely to be found in larger systems.
Utah State University recently reported results from a survey of water main breaks,
(Folkman, March 2018). The survey included 308 drinking water utilities in the USA
and Canada with details from 281 on water main break data covering 170,569 miles
of pipe. This survey is an important contribution to the literature because it provides
estimates of pipe performance by type of pipe material.
Among the major findings of the Utah State University survey, several are important
because they directly address pipe performance in general and performance by pipe
material (adapted from Folkman, March 2018):
t 8BUFS NBJO CSFBL S
B
U
F
TIBWFJODSFBTFE 27% GSPN2012 U
P2018; SBJTJOHGSPN11 U
P
14 breaks on average for every 100 miles of pipe per year.
t 5IF 308 XBUFS T
V
Q
Q
M
ZTZTUFNT TVSWFZFE GPVOE U
I
B
U82% P
GD
B
T
UJSPO ($*) QJQFT BSF
more than 50 years old and experiencing a 46% increase in break rates.
t ANPOH UIF V
U
J
M
J
U
J
F
TTVSWFZFE, J
UXBT GPVOEU
I
B
UVTJOHB
T
T
F
UNBOBHFNFOUBOE PQFSB-
tions optimization (for example, pressure reduction and leak detection), help extend
the useful asset life.
t 0OMZ 45% P
G6
U
J
M
J
U
J
F
TDPOEVDUDPOEJUJPOBTTFTTNFOU P
GXBUFS NBJOT.
t 17$ QJQFIBE UIF M
P
X
F
T
UG
B
J
M
V
S
FS
B
U
FJOUIF TVSWFZFE V
U
J
M
J
U
J
F
TDPNQBSFE U
PD
B
T
UJSPO,
ductile iron, concrete, steel and asbestos cement pipes.
t $BTUJSPOBOE E
V
D
U
J
M
FJSPOQJQFTFYQFSJFODF IJHI G
B
J
M
V
S
FS
B
U
F
TJOD
P
S
S
P
T
J
W
FT
P
J
M
T
.
t MPTUV
U
J
M
J
U
J
F
TIBWF NPEFSBUF U
PIJHI T
P
J
MDPSSPTJPOSJTL.
A substantial portion of the current pipe inventory is cast iron and it is nearing the
end of its design life. Water and sewer system managers regularly consider whether to
repair or replace pipes. If repair, how, where, and for what linear measure? If doing a
replacement, also consider what pipe material has the best value.
11. Page 1
1
The local government utility surveys confirm the constancy of breaks. Earlier in this
report we noted that even with a downturn in pipe expenditures by local government,
pipes, the underground infrastructure, and their immediate system connectedness,
drains, lines, etc., continue to be among the top annual construction expenditures in the
public water and sewer sectors.
The repetitive nature of the repair and replace procurement activity adhering to
entrenched or convenient procurement policies is a direct impediment to cost-savings
by stifling innovation. Mayors should instead view it as an opportunity to try new
approaches and new pipe materials. If different pipe materials meet recommended
mechanical standards, then they should also have equal consideration in an open
bid process. This will introduce competition and should result in lower prices, even for
incumbent materials.
There are many claims and counterclaims about the efficiency, durability and safety
of pipes. Local procurement officials can obtain reliable information by contacting vari-
ous industry trade associations and state and federal agency resources. Officials can
also rely on consulting engineers for information.
PUBLIC SAFETY AND THE
ENVIRONMENT
Advances in drinking water treatment technologies have been tremendous since
1900, but the public health benefits are sometimes diminished with pipe failure. Cit-
JFT XJUI NBjPS VSCBO ESJOLJOH XBUFS TZTUFNT M
J
L
F +FSTFZ $JUZ, /+, BBMUJNPSF, M% BOE
Louisville, KY implemented best practices in the early 1900s – filtration and chlorination
– and achieved an immediate decline in infant and childhood morbidity and mortality
related to parasitic water borne pathogens. Since then, the invention and incorpora-
tion of many new treatment technologies in the late 1900s has further enhanced pub-
lic safety. Yet breakage, which includes corrosions and leaks, of any pipe, regardless
of material, has the potential to reintroduce waterborne pathogens to the consumer
through infiltration of the pipe. Similarly, breaking sewer pipes and wastewater pipes
are a concern for the environment and potential human impact (basement backups
and contaminated streams).
Chronic health impacts are important to recognize, and they may be associated with
broken or fully functional pipes. Chronic health impacts have been related to chemicals
or contaminants in drinking water that may be carcinogenic. For example, some of
the drinking water treatments applied can result in potential public health impacts. The
EPA sets drinking water standards that regulate the allowable levels of substances of
concern; and, the EPA has an action-forcing mechanism to consider new substances for
regulation on a regular basis.
The literature on acute and chronic public health impacts from contaminated water
is well established and not the primary concern of this report. While somewhat dated,
B /BUJPOBM 3FTFBSDI $PVODJM QVCMJDBUJPO QSPWJEFT B HPPE GPVOEBUJPO JO M
J
T
U
J
O
HBOE
describing some of these adverse health impacts and their drinking water causes,
(/BUJPOBM 3FTFBSDI $PVODJM (64) 4BGF %SJOLJOH 8BUFS $PNNJUUFF. 8BTIJOHUPO (%$):
1982). Drinking water safety is important, and it is local government that provides
some of the safest drinking water to hundreds of millions of people daily. Providing
24-hour service all the time is an expensive proposition and local government invested
over $65 billion in 2015, and still it is a challenge to ensure uninterrupted service.
Until the late 1980s, EPA was responsible for testing and certifying that materials
were safe to be used for both drinking water and waste water pipes. Following a
decision by the EPA to no longer do this work, the EPA (through a regulatory process)
QBTTFE UIF SFTQPOTJCJMJUZU
PUIF /BUJPOBM 4BOJUBUJPO FPVOEBUJPO (/4F). 4JODF UIFO UIF
/4F IBT EPOF B
M
MP
G UIF U
F
T
U
J
O
H BOE SFUFTUJOH P
G QJQJOH NBUFSJBMT UIBU HP JOUPXBUFS
12. Page 12
infrastructure projects. It is important to note that all materials, from the new and inno-
vative to the traditional, are tested and retested to ensure their safety.
5IF A/4*//4F 61 4UBOEBSE FOTVSFT UIBUESJOLJOH XBUFS QJQFT BSF TBGF G
P
SVTF BOE
that all pipes are tested for safety equally. The materials are tested before the pipes
are used commercially, by subjecting them to multiple tests, including if the pipes leach
chemicals or other substances into the water. Once the materials are certified, the test-
ing does not stop. Materials used in pipes are continuously tested throughout produc-
UJPO CZ /4F. 5IFTF BVEJUT BSF EPOF SBOEPNMZ UXJDF FBDI ZFBS BOE BMTP FOTVSF UIBU
quality control tests are being done by the manufacturer.
The Conference of Mayors adopted policies urging cities to consider environmental
impacts using life cycle analysis (LCA) when available and appropriate. LCAs have
become more widely available, and the Conference of Mayors provided an example in
relation to pipe materials (Anderson, 2013). It is important for mayors to weigh public
safety (including environmental externalities) as well as cost and performance of pipes.
Typically, an LCA considers several stages: production/extraction, construction pro-
cess, use, and end of life. Each stage of an LCA identifies inputs and outputs to assess
energy use, wastes, emissions and their environmental impact. The LCA provides “…
transparent disclosure of environmental impact and is used to standardize industry
comparisons” (Sustainable Solutions Corporation, Royersford, PA). Standardized com-
parisons provide a good tool to assess competing product claims technically and ana-
lytically. Local procurement officials may have authority to request the results of an
LCA for a single pipe material or multiple pipe materials. This report will not address
the claims and counterclaims on pipe material environmental impacts. However, we
encourage local officials to consider LCAs when making water infrastructure decisions.
The pipe industry is moving towards providing more transparent and higher-quality
information on their environmental performance that may be of use to local officials.
For example, Uni-Bell PVC Pipe Association commissioned an LCA on potable water,
gravity storm water, and sanitary sewer pipe systems that was reviewed in accordance
with ISO 14044 (a standardized review protocol ensuring the accuracy of an LCA). The
LCA led to a PVC pipe Environmental Product Declaration (EPD), which complies with
*40 14025 TUBOEBSETBOE XBT JOEFQFOEFOUMZDFSUJGJFECZ /4F *
O
U
F
S
O
B
U
J
P
O
B
M
.
There are many good resources that local officials can use to determine the safety
of piping materials and whether or not they are appropriate for their specific project.
These safety standards are based on data collected over long periods of time and
are reliable.
CONCLUSION
We reported in our 2013 review of local government water and sewer pipe pro-
curement practices that closed procurement that prohibits competition among different
pipe materials is prone to inefficiencies and the potential for substantial lost opportunity
costs. Cities invest significant resources in water and sewer pipes, then and now. The
case for considering alternative pipe materials that might perform as good or better
than conventional pipes used today, and cost less, is compelling. In the 2013 report
several communities provided anecdotal cases where alternative (PVC) pipe materials
were chosen, and cost savings were achieved. A business case approach made pos-
sible through open bid procurement was suggested to compare competitive pricing
and overall value, and the local procurement official could find assistance from knowl-
edgeable consulting engineers, or develop the tools needed to make accurate cost and
performance comparisons.
Five years later, 2018, the case for open competition is stronger. Closed procurement
and low bid policies may be state law in some cases but there is often an opportunity
for exception. Whether state law or local policy, the fact is that new information (both
knowledge and analytic tools) on cost, performance, public health and environmental
13. impact is readily available. Mayors and their departments can use this information
to lower or stabilize their pipe capital costs while meeting safety and performance
requirements.
A standardized cost per foot analytical tool such as the BCC and Datahawks
research used is of practical utility to local officials who make procurement decisions
and seek efficiencies and cost savings. The AWWA reports and Folkman’s survey make
a compelling case for the magnitude of the challenge to maintain and upgrade the
underground infrastructure. Folkman specifically emphasizes the increasing number of
local systems making decisions about replacing legacy pipes, such as cast iron, that are
aging out and the importance of comparing pipe cost, performance and environmental
impacts when procuring new pipes. These decisions will have a 50 to 100-year design
life expectation.
Public health impacts are substantially mitigated when potable water pipes are
maintained and operated properly. The potential for health impacts increases when
pipes fail, and sometimes when treatment and/or biofilm protocols are changed or
modified. Pipe failure can result in the introduction of waterborne parasites and inor-
ganic elements to the tap. Testing frequently detects organic contaminants in pipes with
no- or interrupted-flow. For example, stalled water and residual chlorine in drinking
water pipes broken by an earthquake have resulted in detection of tri-halo-methane
(THMs) at the tap when service continued. Asset management best practices as well as
detection technology can effectively address pipe failure.
Public safety includes environmental impacts as well as public health. Reports and
testing results on all materials used in water infrastructure for public health are widely
B
W
B
J
M
B
C
M
FG
P
SSFWJFX GSPN BDDSFEJUFE UIJSE QBSUJFT,JODMVEJOH/4F. 8 F TUBUFEJO2013,
and restate here, the use of Life Cycle Analysis helps differentiate the environmental
impacts of pipe materials according to a standard method of comparison. Some pipe
providers seek additional differentiation through an Environmental Product Declaration,
which requires third party verification of ISO certification. This sets a high bar for com-
paring environmental impacts.
Discussion Questions
As this paper points out there is plenty of evidence to show that open procurement
and bid processes are the future of “good government.” The big question is why is there
still substantial local resistance to making any change? Is the resistance due to a lack of
information and training of local procurement officials? Are consulting engineers being
allowed to share new ideas or are they limited by the existing norms or local/state ordi-
nances or laws? Are the cost, performance and safety information presented in a way
that is amenable to local procurement processes?
Changing behavior relies on changing attitudes, and the transparent and account-
able processes of open bid competition can lead the way. Mayors are strategically
positioned to play the leading role.
Page 13
14. Page 14
REFERENCES
American Water Works Association, 2012, Buried No Longer: Confronting Ameri-
ca’s Water Infrastructure Challenge, Denver, CO.
American Water Works Association, 2017 State of the Water Industry Report,
AWWA, 2017, available from: https://www.awwa.org/publications/opflow/abstract/
articleid/65762696.aspx.
American Society of Civil Engineers (ASCE), “2009 Infrastructure Report Card,”
available from: https://www.infrastructurereportcard.org/2009/sites/default/files/
RC2009_drinkwater.pdf
American Society of Civil Engineers (ASCE), “2017 Infrastructure Report Card,”
available from: http://www.asce.org/reportcard/
Anderson, R., March 2013, Municipal Procurement Process ImprovementsYield Cost-
Effective Public Benefits, Untied States Conference of Mayors, Washington, DC.
Anderson, R., September 2007, National City Water Survey 2007 – The Status of
Asset Management Programs in Public Water and Sewer Infrastructure in America’s
Major Cities, U.S. Conference of Mayors, Washington, DC.
BCC Research, February 15, 2016, Special Research Study: Comparison of Pipe-
line Installation Lengths and Costs in Two Cities, prepared for the American Chemistry
Council, (BCC Research, 49 Walnut Park, Wellesley, MA).
BCC Research, April 23, 2016, Special Research Study: Comparison of Water Main
Pipe Installation Lengths and Costs in North and South Carolina: Raleigh, Charlotte,
and Spartanburg/Greenville, prepared for the American Chemistry Council, (BCC
Research, 49 Walnut Park, Wellesley, MA).
B$$ 3FTFBSDI, /PWFNCFS 3, 2016, Special Research Study: Comparison of Water
Pipe Installation Lengths and Costs in Michigan: Port Huron, Grand Rapids, Monroe,
and Livonia, prepared for the American Chemistry Council, (BCC Research, 49 Walnut
Park, Wellesley, MA).
Datahawks, LLC, December 31, 2016, Special Research Study: Comparison of 8”
and 12” Water Main Pipe Installation Lengths and Costs in Closed Competition and
Open Bidding Arkansas Communities,(Datahawks, LLC, 4119 Lee Ave., Little Rock, AR).
BCC Research, February 24, 2017, Special Research Study: Nationwide Pipe Length
and Cost Savings Evaluation, prepared for the American Chemistry Council, (BCC
Research, 49 Walnut Park, Wellesley, MA).
Folkman Ph.D., P.E., Steven, (March 2018), Water Main Break Rates In the USA and
Canada: A Comprehensive Study - An Asset Management Planning Tool for Water
Utilities Water Main Break Rates Inthe USA and Canada.
Mack EA, Wrase S (2017) A Burgeoning Crisis? A Nationwide Assessment of the
Geography of Water Affordability in the United States.
/BUJPOBM ADBEFNJFT 1SFTT (64), 1982, Drinking Water and Health Volume 4.
/BUJPOBM 3FTFBSDI $PVODJM (64) 4BGF %SJOLJOH 8BUFS $PNNJUUFF. 8BTIJOHUPO (%$):
*4B/ -10: 0-309-03198-2
/4F *
O
UFS
O
B
U
JP
O
BM
,2015, Product Potable Water, Gravity Storm Water, and Sanitary
Sewer Pipe Systems Date of Issue May 15, 2015 Period of Validity 5 Years Declaration
/VNCFS &1%10047
&1%1SPHSBN 0QFSBUPS /4F *
O
U
F
S
O
B
U
J
P
O
B
M789 / . %JYCPSP3E. AOO ASCPS M* 48105
USA www.nsfsustainability.org.
Sustainable Solutions Corporation, Evaluating Life Cycle Assessments for Under-
ground Infrastructure, Royersford, PA, www.sustainablesolutionscorporation.com.
United States Government Accountability Office, September 2016, Water Infra-
structure: Information on Selected Midsize and Large Cities with Declining Populations.
GAO 16-785.
15. Page 15
APPENDIX:
BCC RESEARCH AND DATAHAWKS
SUMMARY FINDINGS
Ohio Communities
The two Ohio communities with closed bid systems paid average cost 32%-35%
higher per foot for pipe ($51.83), compared to the one open bid county that had a
near even blend of DI and plastic pipe ($33.33).
Carolina Communities
The one open bid community procured a near even blend of DI and plastic and had
categorically lower cost except for Spartanburg/Greenville 4” to 6” pipe. For 12” pipe,
closed systems paid an additional 50% markup ($57.73 per foot compared to $28.21).
Michigan Communities
Two open bid communities in Michigan utilized DIand plastic blends, and where the
blend was near even the cost was considerably lower than the two no bid communities
using DI only. The report also found clear evidence of the added cost ‘closed’ procure-
ment policies impose on local governments:
“Furthermore, ductile iron pipe of the same diameter was found to be less costly
in open bid cities than in closed bid cities: 8-inch ductile iron pipe cost, on average,
$71.69 per foot in Port Huron (closed) and $62,39 in Grand Rapids (closed), in com-
parison to $58.60 in Livonia (open) and 55.64 in Monroe (open). Therefore, even when
ductile iron is considered by itself, 8-inch pipe costs in closed bid cities were up to
$16.05 higher than in open bid cities, equivalent to a pipe cost inflation of up to 29%.”
Michigan also demonstrated similar savings, with closed systems paying 27% to
34%more in capital costs.
Arkansas Communities
Arkansas communities exhibit some cost complexity. The one open bid community
procured plastic pipe, but DI pipe in one of the closed bid communities was slightly
less costly.
The other two closed communities procuring DI pipe had a cost nearly twice that of
plastic, except for 8” pipe procured in Hot Springs.
16. LOCAL UNIT OPEN-BID
CITY
PIPE
MATERIAL
2015
AVERAGE
COST PER
FOOT
PIPE
DIAMETE
R (INCHES”)
COLUMBUS, OH N
O DUCTILE IRON $26.73 4” TO 6”
$4.6 MILLION
INVESTMENT
$53.39 6” TO 12”
80,621 FEET OF PIPE
INSTALLED
$82.98 OVER 12”
DELAWARE
COUNTY, OH
YE
S DUCTILE IRON
44%
$15.23 4” TO 6”
INCLUDES:DELAWARE,DUBLIN,WESTERVILLE,&P
O
W
E
L
L PLASTIC 56% $33.65 6” TO 12”
$7.9 MILLION INVESTMENT $80.83 OVER 12”
150,700 FEET OF PIPE INSTALLED
DAYTON, OH N
O DUCTILE IRON
90%
$31.49 4” TO 6”
$1.8 MILLION
INVESTMENT
WITH
PLASTIC PIPE
PLASTIC 10% $51.71 6” TO 12”
37,033 FEET OF PIPE
INSTALLED
EXCEPTIONS
IN
$122.73 OVER 12”
N
EIG
H
BO
R
H
O
O
D
S
Reference - BCC, February 15, 2016
Page 16
OHIO COMMUNITIES
LOCAL UNIT OPEN-BID
CITY
PIPE MATERIAL 2015
AVERAGE
COST PER
FOOT
PIPE
DIAMETE
R (INCHES”)
C
HA
R
LOT
T
E
,N
C YE
S DUCTILE IRON
47%
$22.15 4” TO 6”
$1.2 MILLION INVESTMENT PLASTIC 53% $25.18 6” TO 12”
37,800 FEET OF PIPE INSTALLED $65.87 OVER 12”
RALEIGH,N
C N
O DUCTILE IRON $29.77 4” TO 6”
$1.76 MILLION INVESTMENT $57.73 6” TO 12”
30,021 FEET OF PIPE INSTALLED $127.11 OVER 12”
SPARTANBURG/GREENVILLE,S
C N
O DUCTILE IRON
98.6%
$19.98 4” TO 6”
$4.6 MILLION INVESTMENT PLASTIC 1.4% $33.68 6” TO 12”
185,443 FEET OF PIPE INSTALLED $85.28 OVER 12”
Reference - BCC, February 15, 2016
CAROLINA COMMUNITIES
17. LOCAL UNIT OPEN-BID
CITY
PIPE
MATERIAL
2015
AVERAGE
COST PER
FOOT
PIPE
DIAMETE
R (INCHES”)
LIVONIA, MI
$1.5 MILLION
INVESTMENT
YE
S DUCTILE IRON
6%
PLASTIC 94%
$57.37
N/A
8”
12”
26,000 FEET OF PIPE
INSTALLED
MONROE, MI YE
S DUCTILE IRON
44%
$29.77 8”
$1.76 MILLION
INVESTMENT
PLASTIC 56% $57.73 12”
30,021 FEET OF PIPE
INSTALLED
GRAND RAPIDS,
MI
N
O DUCTILE IRON $70.88 8”
$0.69 MILLION
INVESTMENT
$74.39 12”
9,779 FEET OF PIPE
INSTALLED
PORT HURON, MI N
O DUCTILE IRON $104.33 8”
$2.8 MILLION
INVESTMENT 27,075
FEET OF PIPE
INSTALLED
$107.74 12”
Reference – BCC Research, Novem
ber 3, 2016
MICHIGAN COMMUNITIES
PIPEMA
T
E
R
IAL 2015A
V
E
RA
G
EC
O
ST
PE
RFO
O
T
PIPED
IAM
ET
E
R
(INCHES”)
HOT SPRINGS, AR N
O DUCTILE IRON $32.23 8”
$236,080 MILLION
INVESTMENT (2014 & 26,000
FEET OF PIPE INSTALLED
2015) $122.60 12”
CENTRAL ARKANSAS
WATER:
N
O DUCTILE IRON $119.41 8”
$161.71 12”
L
I
T
T
L
EROCK,N
O
R
T
HL
I
T
T
L
EROCK,SHERWOOD,M
A
U
M
E
LLE
$1.76M
IL
L
IO
NINV
E
ST
M
E
NT
30,021FE
E
TO
FPIPEINST
A
L
L
E
D
SPRINGDALE, AR N
O DUCTILE IRON $35.77 8”
$0.38 MILLION
INVESTMENT
$58.16 12”
7,655 FEET OF PIPE
INSTALLED
FAYETTEVILLE, AR N
O PLASTIC $38.40 8”
$109,069 MILLION
INVESTMENT 1,825
FEET OF PIPE
INSTALLED
$61.02 12”
ARKANSAS COMMUNI
TI
ES
LO
C
ALUN
IT O
PE
N-BIDC
IT
Y
Page 17
18. The Mayors Water Council
The Mayors Water Council (MWC) assists local governments in providing high
quality water resources in a cost-effective manner.
MWC provides a forum for local governments to share information on water
technology, management methods, operational experience, and financing of
infrastructure development.
MWC monitors and responds to federal legislative, regulatory or policy
proposals affecting the delivery of municipal water services.
MWC also provides a forum toassistlocal governments in exploring
competition and public-private partnership approaches, and alternative
methods of financing water infrastructure development.
Mayors Water Council Co-Chairs 2018
Mayor Jill T
echel, City of Napa CA
Mayor David Berger, City of Lima OH
19. THE UNITED STATES CONFERENCE OF MAYORS
1620 Eye Street, NW
Washington, DC 20006
T
el: 202-293-7330
Fax: 202-293-2352
usmayors.org